I’ve just opened a manual Long trade on Chicago Wheat because I think the market structure is right for an UP period.
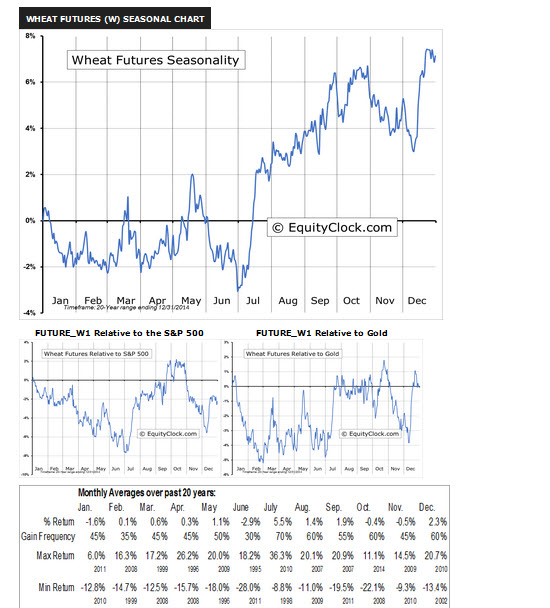
I thought I’d check on ‘wheat seasonality’ and I see that July is a good month historically … see attached.
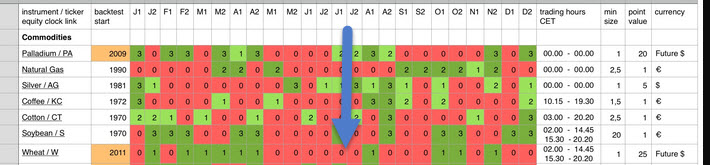
I then looked at the matrix on Page 1 for wheat seasonality and I note wheat gets a ‘0’ in July … see attached.
Am I reading something wrong or anybody got any thoughts please?
Thanks
GraHal
Gold closed long at 1am at 1200.1, loss from 1235.5.
@Patrick and everyone else interested
I got the answer from my IG contact that both CAC 1€ and EU Stocks50 1€ will be removed from PRT.
Best regards, David
@dajvop thank you
Your chart is 20 years to 2009 and my chart is 20 years to 2014. You wouldn’t think there be so much change in overall 12 month profile in 5 years?
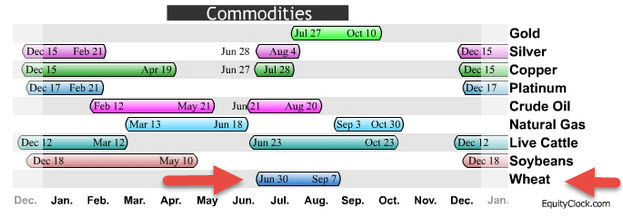
But there is also attached on equityclock.com shows latest on Seasonality … in their words
Identified below are the periods of seasonal strength for each market segment. Each bar will indicate a buy and sell date based upon the optimal holding period for each market sector/index.
Cheers
Grahal
PS How did you embed that chart in your post? I don’t appear to have that option (tried copy & paste and ctrl v etc)
Hi Grahal,
The page looks useful but unfortunately it is not solving the problem because the structure of the two codes are very different.
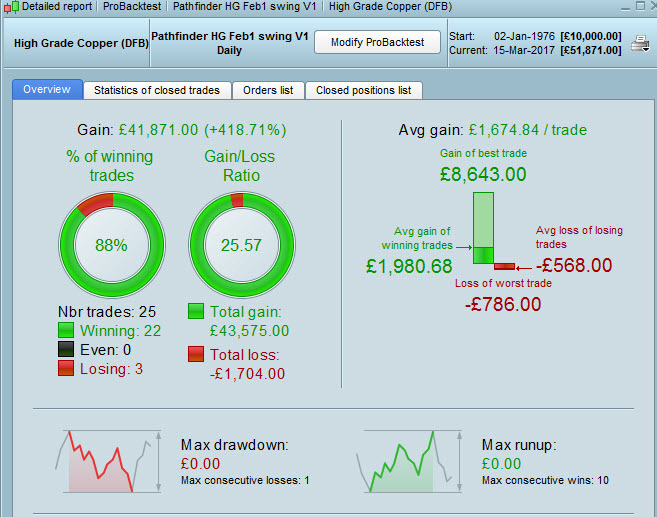
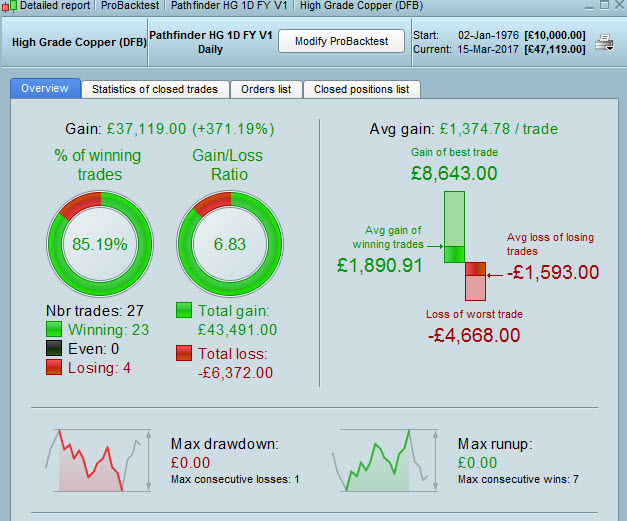
Attached again for a like for like comparison, the individual month of Feb1 and the full year algo, which only trades in the first half of February.
Would be nice if somebody could have a look because I think it would be very beneficial to use only a full year algo at the end of the day. (If we once finish the full year for all indices and commodities)
Regards
Oliver
Ah yeah I see what you mean O-jay8 … there’s ‘too much difference’ for the Code Diff checker to be useful.
Surely the Feb only version has to be better as there’s loads less Drawdown?? I’d be more comfortable with the Feb1 version … or am I missing something?
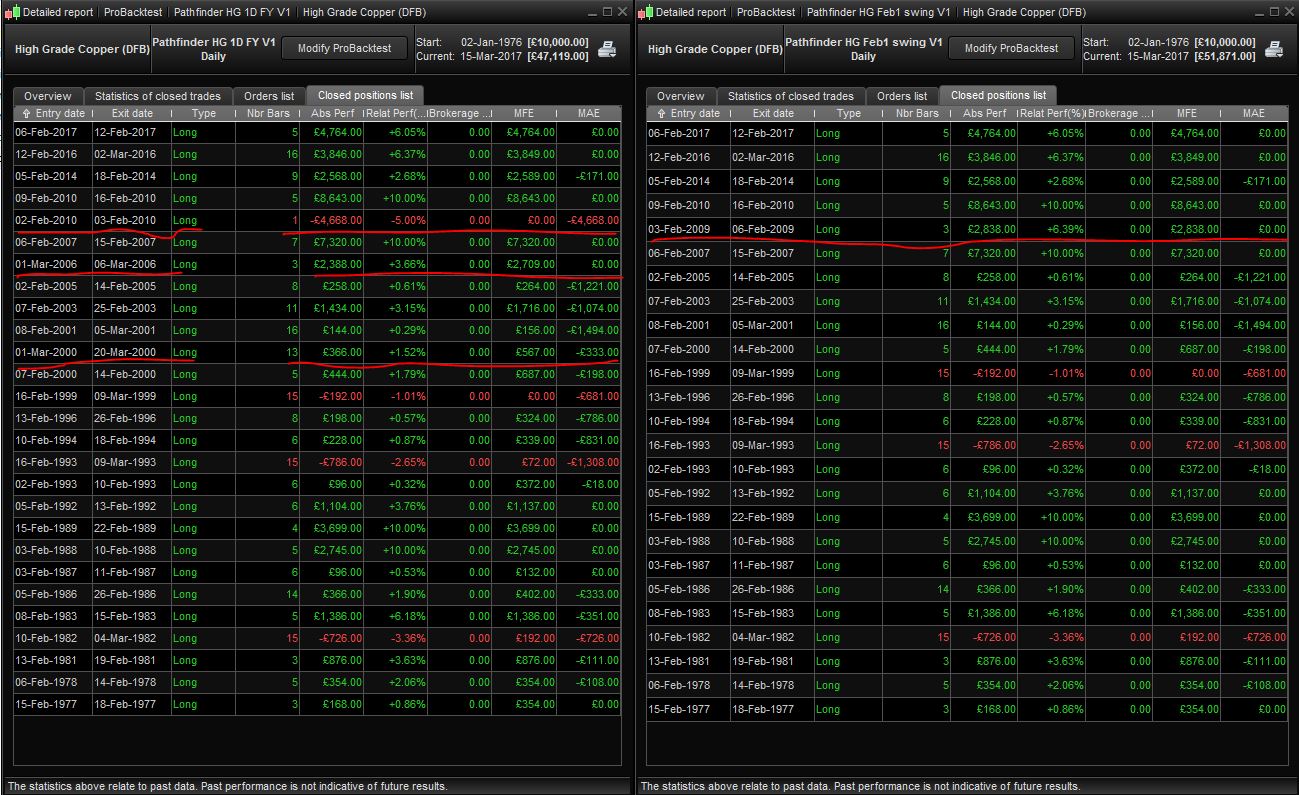
See attached for comparison since 2 Jan 1976
GraHal
[attachment file=”28640″]
[attachment file=”28641″]
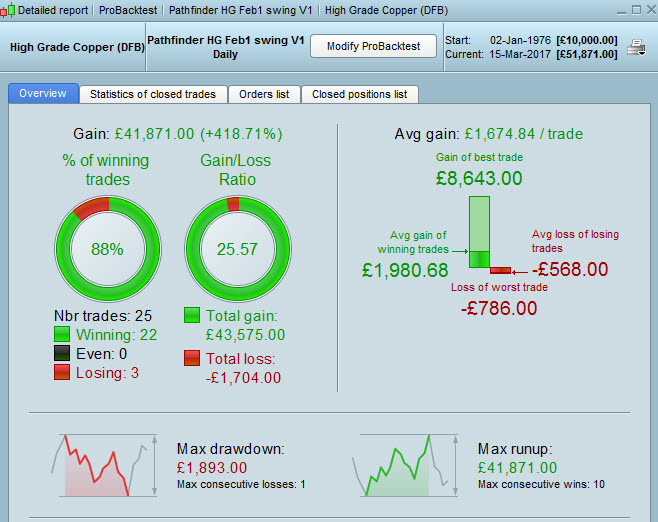
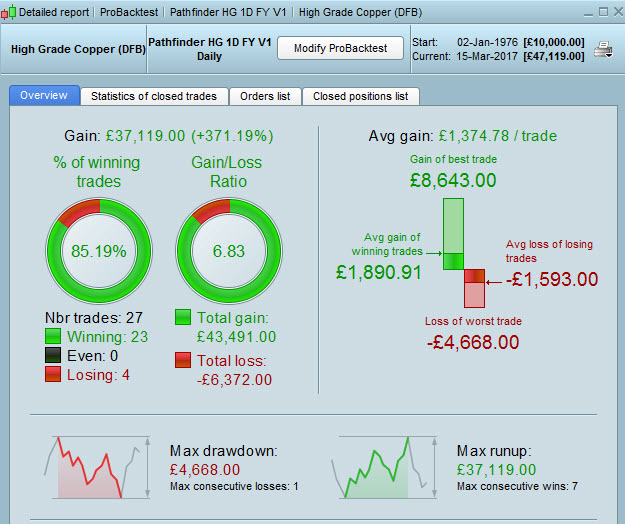
Ignore 2 screen shots above showing zero drawdown (I didn’t wait for the PRT server to compute the figure).
2 on the right do show DD.
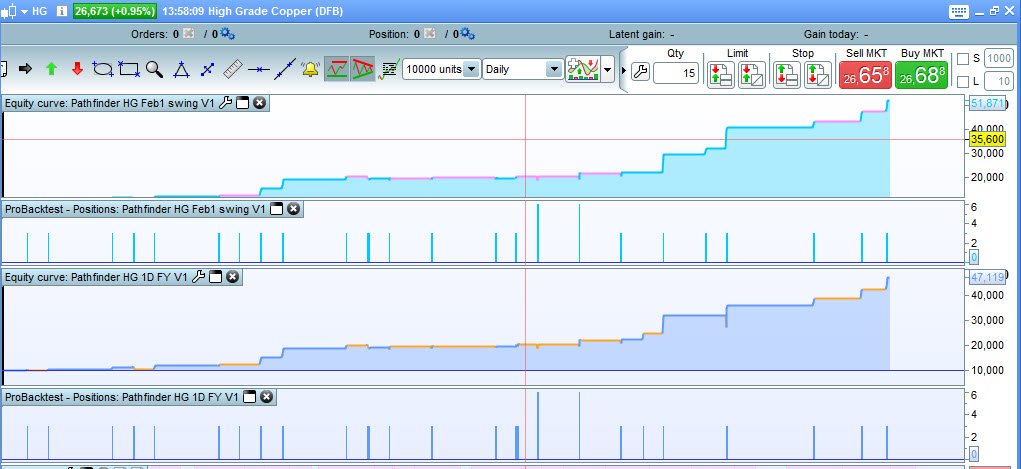
Attached are the curves for Feb1 and FY … very similar, but with 2 more trades in the FY system.
So what conclusion do we draw O-jay8 ?
GraHal
As you can see in my screenshot, highlighted with a red line, the FY V1 has 3 trades which do not occur for the Feb1.
And the Feb1 has one trade which does not occur in the FY V1.
The question is why, because in my opinion the results of the code should be the same. Only the structure is different.
Until we sort this out, I would of course rather trade the individual month of Feb1.
As it was the approach of Pfeiler with the full year algo, I would like to hear his opinion on this matter as well.
@ GraHal, another question, as I do spread betting as well, what do you use for corn and chicago wheat, DFB?
Regards
Oliver
@ojay: All I can offer right now is this link with an updated FY algo:
https://docs.google.com/spreadsheets/d/1pBoKX44kX_GSzHNc0CgueKdZAuWBCnauoK_bh8ht6j8/edit?usp=drivesdk
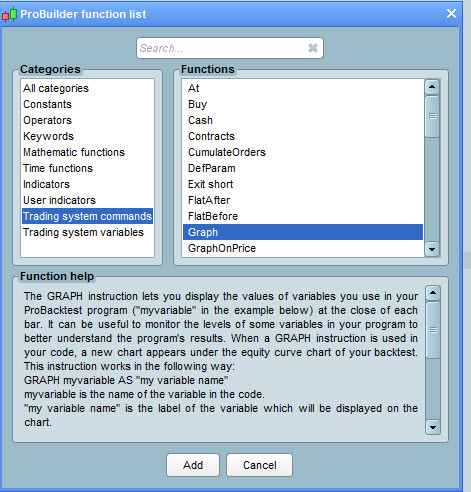
Please have a look at the calculation of ‘midofmonth’. The prt variable ‘Days’ does not count to the end of the month, so in this version it is calculated again (still not perfect but better, as you can see with the prt graph function
Hope this helps.
@ O-jay8 you’d need to isolate the 3 trades that are different and then examine the triggers and check out what is going on?
Use the GRAPH Function to isolate triggers … see attached.
Corn (DFB) Code C and Chicago Wheat(DFB) Code W … is that what you mean?
GraHal
@O-jay8
I have noted the following differences that does not appear in the other version:
FY: 2000-03-01, 2006-03-01, 2010-02-02
Feb1: 2009-02-03
Even though March1 is set to 0, there are 2 trades in that period for the FY version.
The differences in drawdown comes from the 2010-02-02 trade which was a loss.
@dajvop gold is still open for me!
@Bandido
Please upload your version.
Best regards, David
@dajvop
// Pathfinder Trading System based on ProRealTime 10.2
// Breakout system triggered by previous daily high/low crossings with smart position management
// Version 2 - long only
// Instrument: GOLD mini 1D, 0.3 points spread, account size 10.000 Euro
// Rating c

// ProOrder code parameter
DEFPARAM CUMULATEORDERS = true  // cumulate orders if not turned off
DEFPARAM PRELOADBARS = 10000

// define instrument signalline with help of multiple smoothed averages
ONCE periodFirstMA = 5
ONCE periodSecondMA = 10
ONCE periodThirdMA = 6// x1 //nr 1 (between 1 -10)

// define filter parameter
ONCE periodLongMA = 10//x2 //nr 2 (check values beetween 10 -100)

// define position and money management parameter
Capital = 10000
Risk = 5 // in %
equity = Capital + StrategyProfit
maxRisk = round(equity * Risk / 100)

x= 1

PositionSize = x

ONCE stopLossLong = 5 //x1 nr 3 (between 5-10) in %
ONCE takeProfitLong = 5.25 //x2 nr 4 (between 3-10) in %

maxPositionSizeLong = MAX(15, abs(round(maxRisk / (close * stopLossLong / 100) / PointValue) * pipsize))

ONCE maxCandlesLongWithProfit = 11 //x1 nr 5 (between  5 - 15) take long profit latest after x candles
ONCE maxCandlesLongWithoutProfit = 14  //x2 nr 6 (between  5 - 15) limit long loss latest after x candles

// define saisonal position multiplier for each month 1-15 / 16-31 (>0 - long / <0 - short / 0 no trade)
ONCE January1 = 0
ONCE January2 = 0
ONCE February1 = 0
ONCE February2 = 0
ONCE March1 = 3
ONCE March2 = 0
ONCE April1 = 0
ONCE April2 = 0
ONCE May1 = 0
ONCE May2 = 0
ONCE June1 = 0
ONCE June2 = 0
ONCE July1 = 0
ONCE July2 = 0
ONCE August1 = 0
ONCE August2 = 0
ONCE September1 = 0
ONCE September2 = 0
ONCE October1 = 0
ONCE October2 = 0
ONCE November1 = 0
ONCE November2 = 0
ONCE December1 = 0
ONCE December2 = 0

// calculate daily high/low (include sunday values if available)
dailyHigh = DHigh(1)
dailyLow = DLow(1)

// calculate instrument signalline with multiple smoothed averages
firstMA = WilderAverage[periodFirstMA](close)
secondMA = TimeSeriesAverage[periodSecondMA](firstMA)
signalline = TimeSeriesAverage[periodThirdMA](secondMA)

// set saisonal multiplier
currentDayOfTheMonth = Date - ((CurrentYear * 10000) + CurrentMonth * 100)
midOfMonth = 15
IF CurrentMonth = 1 THEN
IF currentDayOfTheMonth <= midOfMonth THEN
saisonalPatternMultiplier = January1
ELSE
saisonalPatternMultiplier = January2
ENDIF
ELSIF CurrentMonth = 2 THEN
IF currentDayOfTheMonth <= midOfMonth THEN
saisonalPatternMultiplier = February1
ELSE
saisonalPatternMultiplier = February2
ENDIF
ELSIF CurrentMonth = 3 THEN
IF currentDayOfTheMonth <= midOfMonth THEN
saisonalPatternMultiplier = March1
ELSE
saisonalPatternMultiplier = March2
ENDIF
ELSIF CurrentMonth = 4 THEN
IF currentDayOfTheMonth <= midOfMonth THEN
saisonalPatternMultiplier = April1
ELSE
saisonalPatternMultiplier = April2
ENDIF
ELSIF CurrentMonth = 5 THEN
IF currentDayOfTheMonth <= midOfMonth THEN
saisonalPatternMultiplier = May1
ELSE
saisonalPatternMultiplier = May2
ENDIF
ELSIF CurrentMonth = 6 THEN
IF currentDayOfTheMonth <= midOfMonth THEN
saisonalPatternMultiplier = June1
ELSE
saisonalPatternMultiplier = June2
ENDIF
ELSIF CurrentMonth = 7 THEN
IF currentDayOfTheMonth <= midOfMonth THEN
saisonalPatternMultiplier = July1
ELSE
saisonalPatternMultiplier = July2
ENDIF
ELSIF CurrentMonth = 8 THEN
IF currentDayOfTheMonth <= midOfMonth THEN
saisonalPatternMultiplier = August1
ELSE
saisonalPatternMultiplier = August2
ENDIF
ELSIF CurrentMonth = 9 THEN
IF currentDayOfTheMonth <= midOfMonth THEN
saisonalPatternMultiplier = September1
ELSE
saisonalPatternMultiplier = September2
ENDIF
ELSIF CurrentMonth = 10 THEN
IF currentDayOfTheMonth <= midOfMonth THEN
saisonalPatternMultiplier = October1
ELSE
saisonalPatternMultiplier = October2
ENDIF
ELSIF CurrentMonth = 11 THEN
IF currentDayOfTheMonth <= midOfMonth THEN
saisonalPatternMultiplier = November1
ELSE
saisonalPatternMultiplier = November2
ENDIF
ELSIF CurrentMonth = 12 THEN
IF currentDayOfTheMonth <= midOfMonth THEN
saisonalPatternMultiplier = December1
ELSE
saisonalPatternMultiplier = December2
ENDIF
ENDIF

// define trading filters
// use fast and slow averages as filter because not every breakout is profitable
f1 = close > Average[periodLongMA](close)
f2 = close < Average[periodLongMA](close)

// long position conditions
l = signalline CROSSES OVER dailyHigh

// short position conditions
s = signalline CROSSES UNDER dailyLow

// long entry with order cumulation
IF (l AND f2) THEN

// check saisonal booster setup and max position size
IF saisonalPatternMultiplier > 0 THEN
IF (COUNTOFPOSITION + (positionSize * saisonalPatternMultiplier)) <= maxPositionSizeLong THEN
BUY positionSize * saisonalPatternMultiplier CONTRACT AT MARKET
ENDIF
ELSIF saisonalPatternMultiplier <> 0 THEN
IF (COUNTOFPOSITION + positionSize) <= maxPositionSizeLong THEN
BUY positionSize CONTRACT AT MARKET
ENDIF
ENDIF

stopLoss = stopLossLong
takeProfit = takeProfitLong

ENDIF

// short entry means close long position
IF  (s AND f1)  THEN
SELL AT MARKET
ENDIF

// stop and profit management
posProfit = (((close - positionprice) * pointvalue) * countofposition) / pipsize
numberCandles = (BarIndex - TradeIndex)
m1 = posProfit > 0 AND numberCandles >= maxCandlesLongWithProfit
m2 = posProfit < 0 AND numberCandles >= maxCandlesLongWithoutProfit

// take profit after max candles
IF LONGONMARKET AND (m1 OR m2) THEN
SELL AT MARKET
ENDIF

// superordinate stop and take profit
SET STOP %LOSS stopLoss
SET TARGET %PROFIT takeProfit