

Learn. Code.
Trade. Share.
The world's largest community for ProRealTime™ users —
2,000+ free strategies, forums in 5 languages, and AI-powered trading tools.
[ SCRIPTS LIBRARY ]
1,700+ Free Trading Codes
for ProRealTime™
Every script is free, community-vetted, and ready to paste directly into ProRealTime™. Strategies, indicators, screeners, workspaces — all in one place.
 Indicators
New
Indicators
New
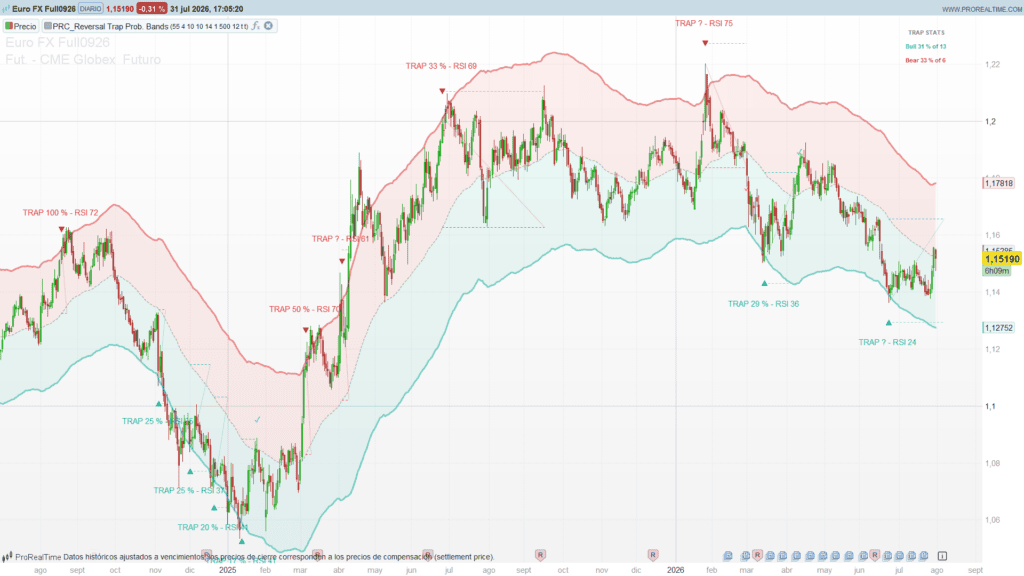
Reversal Trap Probability Bands
 ·
2 days ago
·
2 days ago
 Indicators
New
Indicators
New
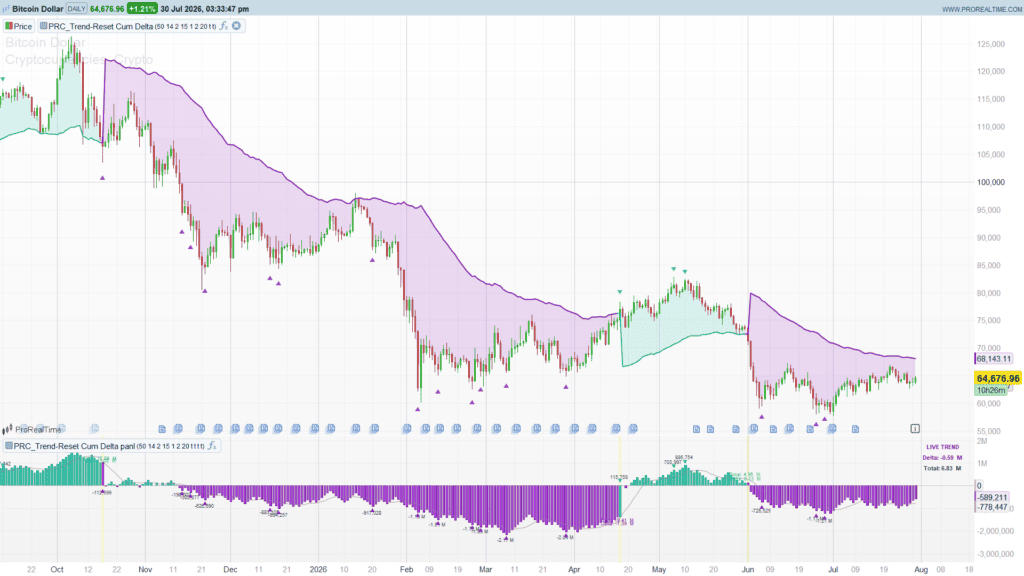
Trend-Reset Cumulative Delta
·
3 days ago
 Indicators
New
Indicators
New
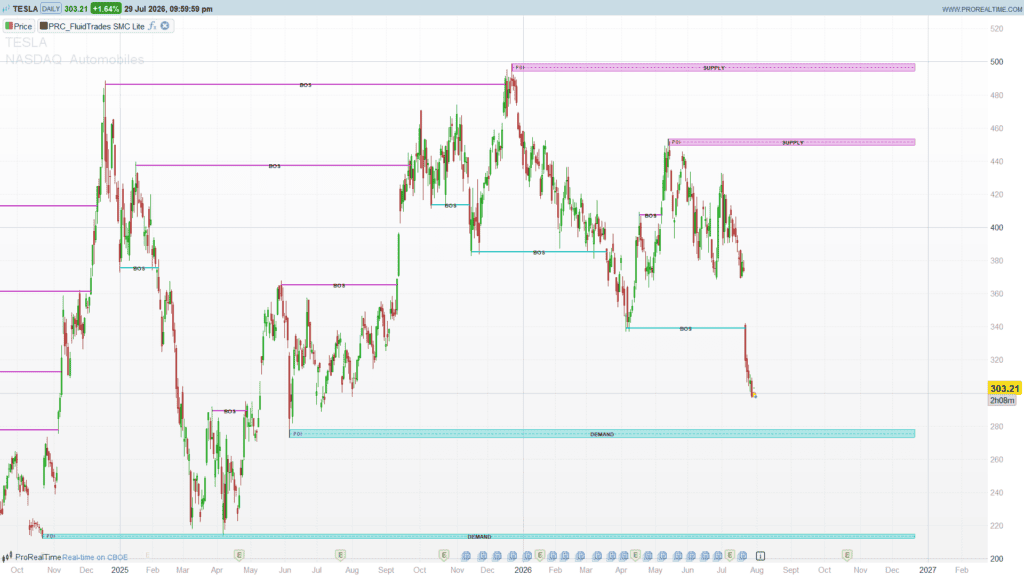
Supply and Demand Zones – SMC Lite
·
3 days ago
 Indicators
New
Indicators
New
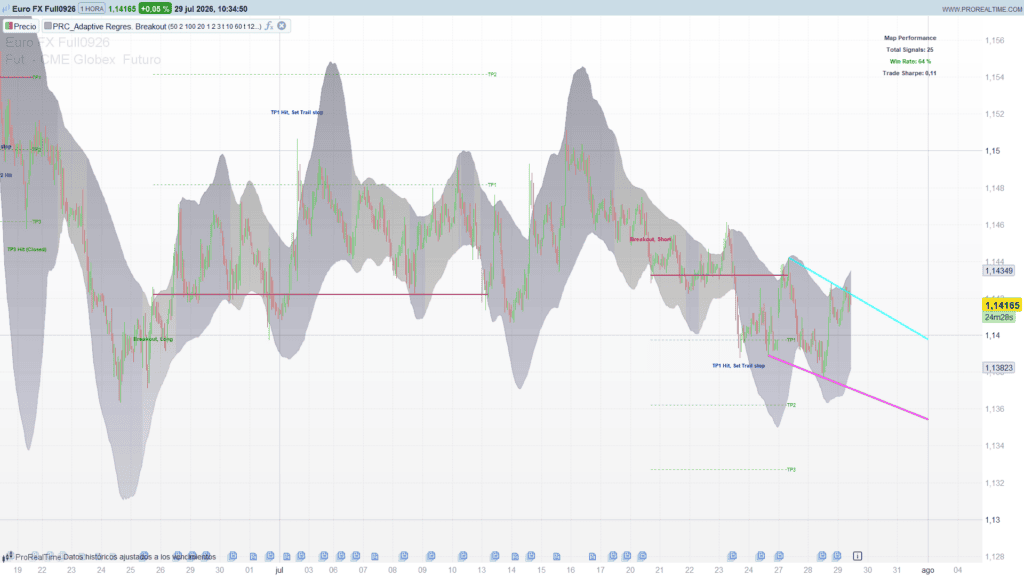
Adaptive Regression Breakout Map
·
4 days ago
 Indicators
New
Indicators
New
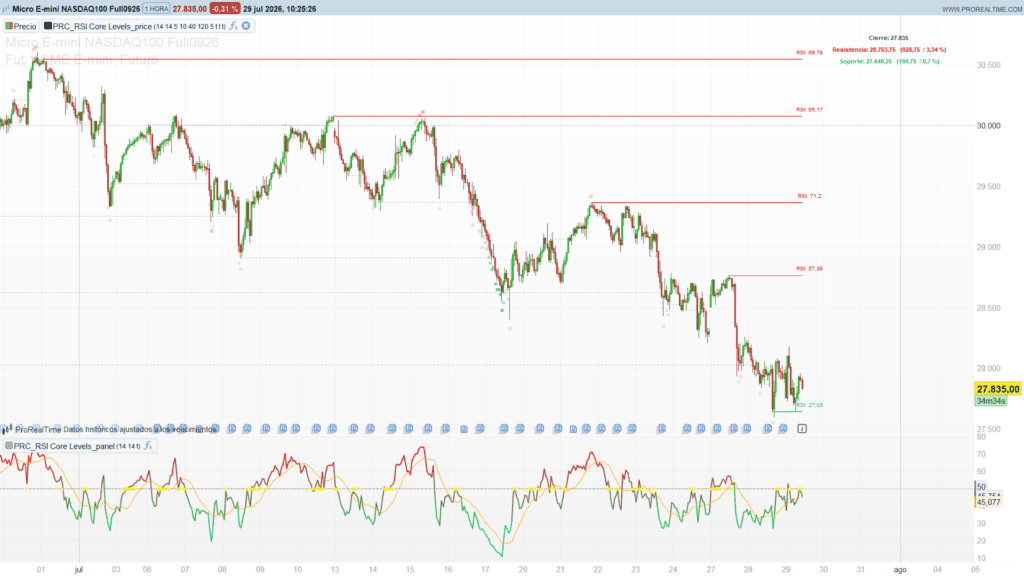
RSI Core Levels Heatmap
·
4 days ago
 Indicators
New
Indicators
New
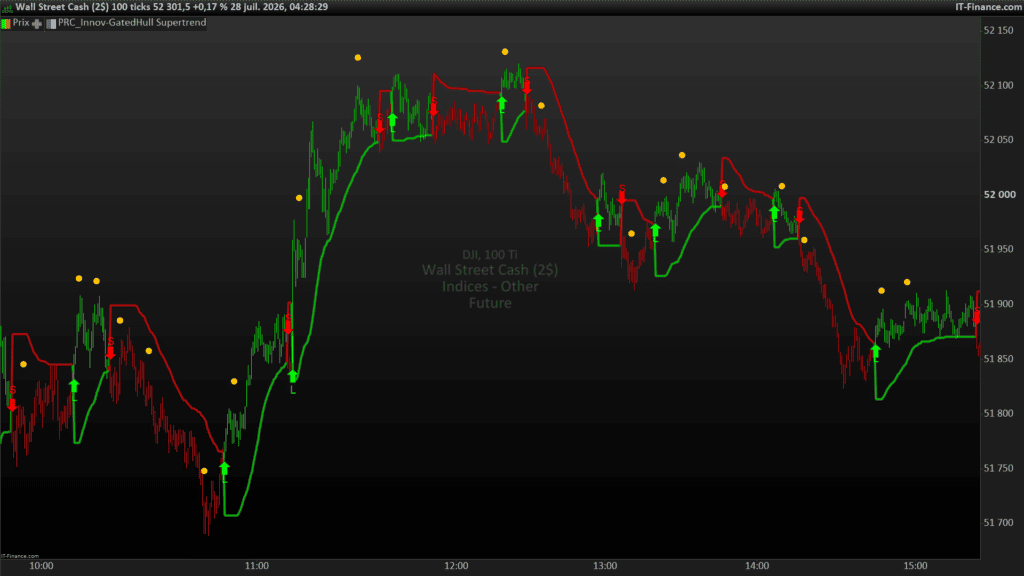
Innovation-Gated Hull Supertrend
Worldwide
Trading &
Coding Forums
Engage in trading & programming discussions with ProRealTime™ users from all over the world.


Find your tribe.
Trade as a team.
ProRealCode Groups let traders form focused communities around shared strategies, instruments, or trading styles — public or private.

Strategy building.
Zero coding required.
ProRealBlocks is a visual drag-and-drop builder that lets you construct complete ProRealTime™ trading strategies using pre-built logic blocks — no ProBuilder knowledge needed.
BUY 1 CONTRACT AT MARKET
ENDIF
Community-crafted
code blocks.
Thousands of reusable ProBuilder snippets, shared and reviewed by the community — organized by category, ready to paste directly into ProRealTime™.

Thousands of strategies.
Generated in minutes.
ProRealQuant uses Monte Carlo sampling to build, test, and rank thousands of trading strategies automatically — so you focus only on the best performers.
Randomizes parameters across thousands of combinations to uncover robust, edge strategies.
Filter by Profit Factor, Win Rate, Max Drawdown, Ulcer Index, PnL, and more simultaneously.
Top performers are saved with full ProBuilder code, metrics, and equity curve PNG.
Learn & Explore,
With Our Knowledge Base
A complete resource hub to understand, use, and master ProRealTime™ — from official documentation to video walkthroughs.
Browse Docs


Ready to Learn.
Code. Trade. Share.
Join thousands of traders and coders building the future together.