Low-High Bands

Low-High Bands

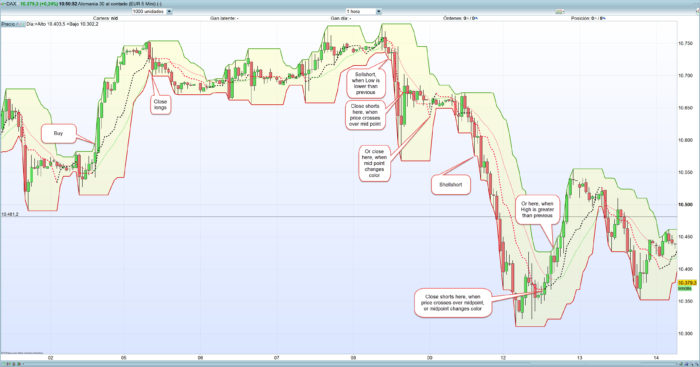
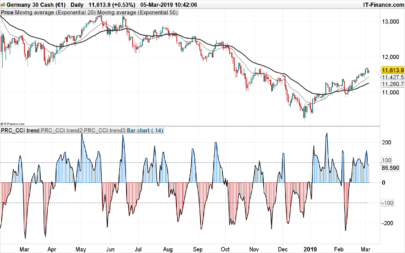
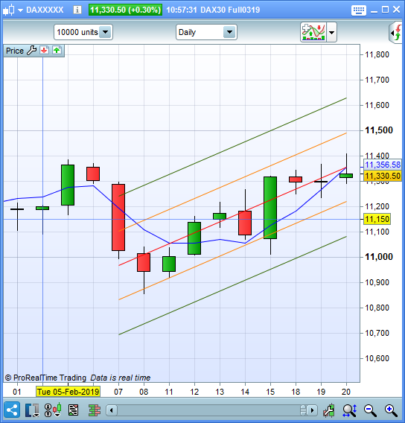
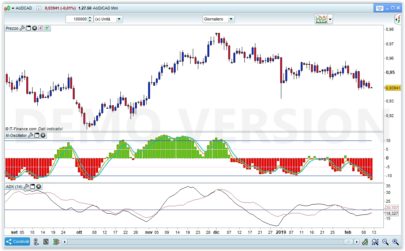
This is a very simple indicator, but useful for longs and shorts.

It gives the highest high, the lowest low, the middle point between both and an exponential average of the middle point of the last x periods.

There are some possibilities which can indicate the in and out for each trade:

  1. Buy longs if the upper band is higher than the previous value
  2. Or if the mid point changes the color from red to black
  3. Close longs if lower bands is lower than previous value
  4. Or if midpoint changes from black to red
  5. The same procedure for shorts

The standard values of the variables are:

x=10 (number of periods of the bands)

y=8 (number of periods of the EMA, exponential average of the middle point)

You can also play with the EMA instead of the mid point, if you want, or change the periods of bands and EMA depending on the timeframe or on your aggressiveness.


Share this

Risk disclosure:

No information on this site is investment advice or a solicitation to buy or sell any financial instrument. Past performance is not indicative of future results. Trading may expose you to risk of loss greater than your deposits and is only suitable for experienced investors who have sufficient financial means to bear such risk.

ProRealTime ITF files and other attachments : How to import ITF files into ProRealTime platform?

PRC is also on YouTube, subscribe to our channel for exclusive content and tutorials

  1. supertiti • 09/16/2016 #

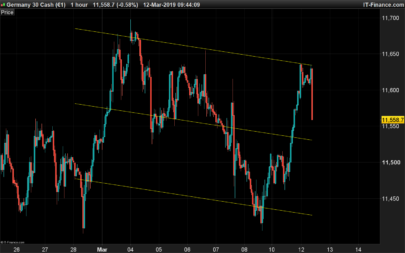
    Ne serait ce pas un canal de Donchian ?

  2. Petrus • 09/16/2016 #

    I never worked with the Donchian channel, but yes, you are right Supertiti: they are very similar, almost the same.

  3. supertiti • 09/16/2016 #

    Hola Petrus
    Estas aficionado de vino para tener este mote ?
    El canal de donchian es la base de todo ! tengo uno “personalizado” que funciona de maravilla desde hace años.
    un saludo desde Cadiz

  4. Petrus • 09/16/2016 #

    Hombre, no te diré que no me guste el vino, y en especial éste, pero aún me faltan muchos trades positivos para poder comprar alguna botellita de esta marca… 😉
    De todas formas tiene su mérito el reinventar el canal de Donchian sin conocerlo, no? :-))

    • Petrus • 09/16/2016 #

      Saludos desde Barcelona!

avatar
Register or

Likes

avatar avatar avatar
Related users ' posts
cdc.andersson Hello, when trying to include this wonderful Dynamic RSI on my trading system i get the erro...
Rafyone Bonjour Nicolas et bonne année lol J'ai une erreur qui apparait concernant drawbarchart une...
Nicolas Je pense que tu n'utilises pas le bon éditeur de code, cette instruction est compatible uniq...
Kris75 Hi, This is great !! anyone ever developped a strategy about it ???
swapping hello Kris75, not that I know but it is possible to make a scenario ;)
digitation Hi swapping, Thanks for sharing this useful tool. I was wondering how difficult it would be...
Real Pro Great work gabri. I have this coded on Amibroker and I have done lots of backtesting but ne...
gabri Hi Real Pro, this indicator assists novices of the Wyckoff system. Wyckoff himself thought t...
tatie hi Gabri, I just came across the wyckoff method and was looking for the weiss wave indica...
Vonasi There is another version of this indicator that can plot the same lines but onto an indicato...
Martin35 Hello Vonasi, do you think it is possible with PRT to code with the same principle as on thi...
Vonasi A modified version of this indicator can be found here: https://www.prorealcode.com/topi...
abhay I am getting a shading between the lines, how can I avoid that. I just want to see lines as ...
Vonasi Delete the 'Color Zone' in the indicator settings window.
dau710 Are the Bulls Blue & the Bears Red?
dau710 Many thanks :)
Nicolas
7 years ago
Hans63 Thank you swapping
FREDNC @Nicolas merci pour se remarquable indicateur, reste à voir comment on va pourvoir l'intégre...
Diamant Bonjour à vous tous, D'après vous, quelle serais la bonne période pour du trading 15 minute...
arnaudat Merci nicolas, j'ai déjà pris cette version et en plus je suis sur les futures. Par contre d...
ullle73 hi nicolas, when im making a strategy out of this i get the error "PRC_VWAP z-score" called ...
Nicolas Please open a new topic in the ProOrder forum section and post the code there in order to ch...
hartgeld Hallo Atxeel, sehr interessanter Code, habe das installiert und funktioniert. Danke! Kannst ...
atxeel Hallo hartgeld, die Ziele sind schlicht, bspw. die Range beträgt 10 Punkte, dann ist das Zie...
AlexWoe89 Hi, thanks for the code. Do you have an idea, if you can also draw pre-market data on char...
Thomas Hello swapping. Very good idea. Can I use and modify the code? I would like to add a few mor...
Razz Hello swapping the indicator is very good! Can you tell me how I can add 2 lines in the dist...
swapping Hello wanjpt, I do not see how to do it because the calculation is for 12 candles of 5mn onl...
wanjpt Thanks swapping.
Thomas @wanjpt https://www.prorealcode.com/prorealtime-indicators/opening-range-eur-with-close-and...
Brisvegas Thats Awesome thank you
Vinks_o_7 Thanks Vonasi !
Tarkus1954 Hi. When I add this indicator it loads it in a separate window. How do I get the indicator...
Nicolas By adding it on the price chart. Use the wrench on the left upper side of the price chart.
ervelasco Thank you for your posting! I was missing the indicator when trying to select Keltner bands ...
swapping fib1236 = (hiday-lowday)*1.236+lowday DrawSegment(startbar,fib1236,barindex,fib1236) colou...
swapping Oups ! Nicolas il y a un problème avec l'insertion de code en utilisant le bouton [Add PRT ...
swapping fib1236 = (hiday-lowday)*1.236+lowday DrawSegment(startbar,fib1236,barindex,fib1236) colour...

Top