

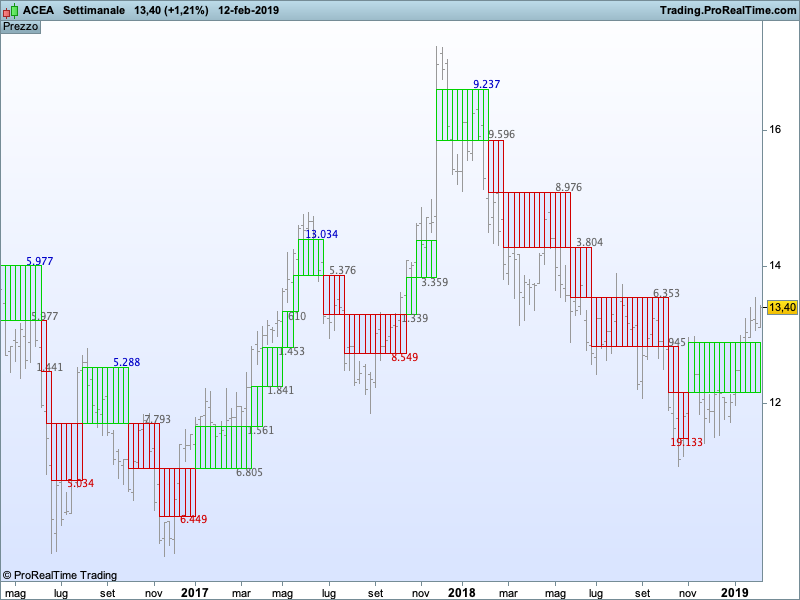
Renko box on price with volumes
February 13, 2019, 10:01 AM
Indicators
2 Comments
This indicator will be OBE as soon as the new version of prorealtime will be released (Renko charts will have volumes showing according to the teaser) but it will be still useful for all the traders that don’t want to switch completely to a chart that ignore time. The indicator draws the volume of the exchanged shares for the period depicted by the box.
Blue skies!!
//percbox=1
//mm=3
//period=14

if barindex>1 and barindex<=(period) then
 boxsize=average[barindex](range)
else
 boxsize = percbox*average[period,MM](TR(close))
endif
if barindex<=1 then
 boxsize=range
endif
once topprice = high
once bottomprice = topprice-boxsize//close - boxsize

i=1
while (close>topprice+(i*boxsize)) do

 if (close<topprice+((i+1)*boxsize)) then
  topprice=topprice+i*boxsize
  bottomprice=topprice-boxsize
 endif
 i=i+1
wend

j=1
while (close<bottomprice-(j*boxsize)) do
 if (close>bottomprice-((j+1)*boxsize)) then
  bottomprice=bottomprice-j*boxsize
  topprice=bottomprice+boxsize
 endif
 j=j+1
wend


if topprice>topprice[1] then
 green=210
 red=0
 long=1
 if long=1 and long[1]=-1 then
  DRAWTEXT("#con#", barindex, bottomprice[1]*0.995) coloured (210,0,0)
  con=round(volume/1000)
  ref=con
 endif
 if long=1 and long[1]=1 then
  DRAWTEXT("#ref#", barindex, bottomprice[1]*0.995) coloured (100,100,100)
  ref=round(volume/1000)
 endif
endif

if topprice<topprice[1] then
 green=0
 red=210
 long=-1
 if long=-1 and long[1]=1 then
  DRAWTEXT("#con#", barindex, topprice[1]*1.005) coloured (0,0,200)
  con=round(volume/1000)
 endif
 if long=-1 and long[1]=-1 then
  DRAWTEXT("#ref#", barindex, topprice[1]*1.005) coloured (100,100,100)
  ref=round(volume/1000)
 endif
endif

DRAWRECTANGLE(barindex, topprice, barindex+1, bottomprice) coloured (red,green,0)
if topprice=topprice[1] then
 con=con+round(volume/1000)
 ref=ref+round(volume/1000)
endif
RETURN
Download
Filename:
Mio-Renko-ATR-box-and-volume.itf
Downloads:
505
Master
Developer by day, aspiring writer by night. Still compiling my bio... Error 404: presentation not found.
Author’s Profile
Loading...