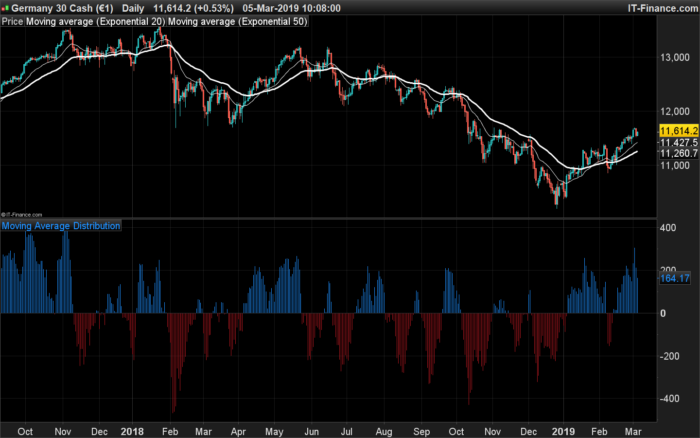
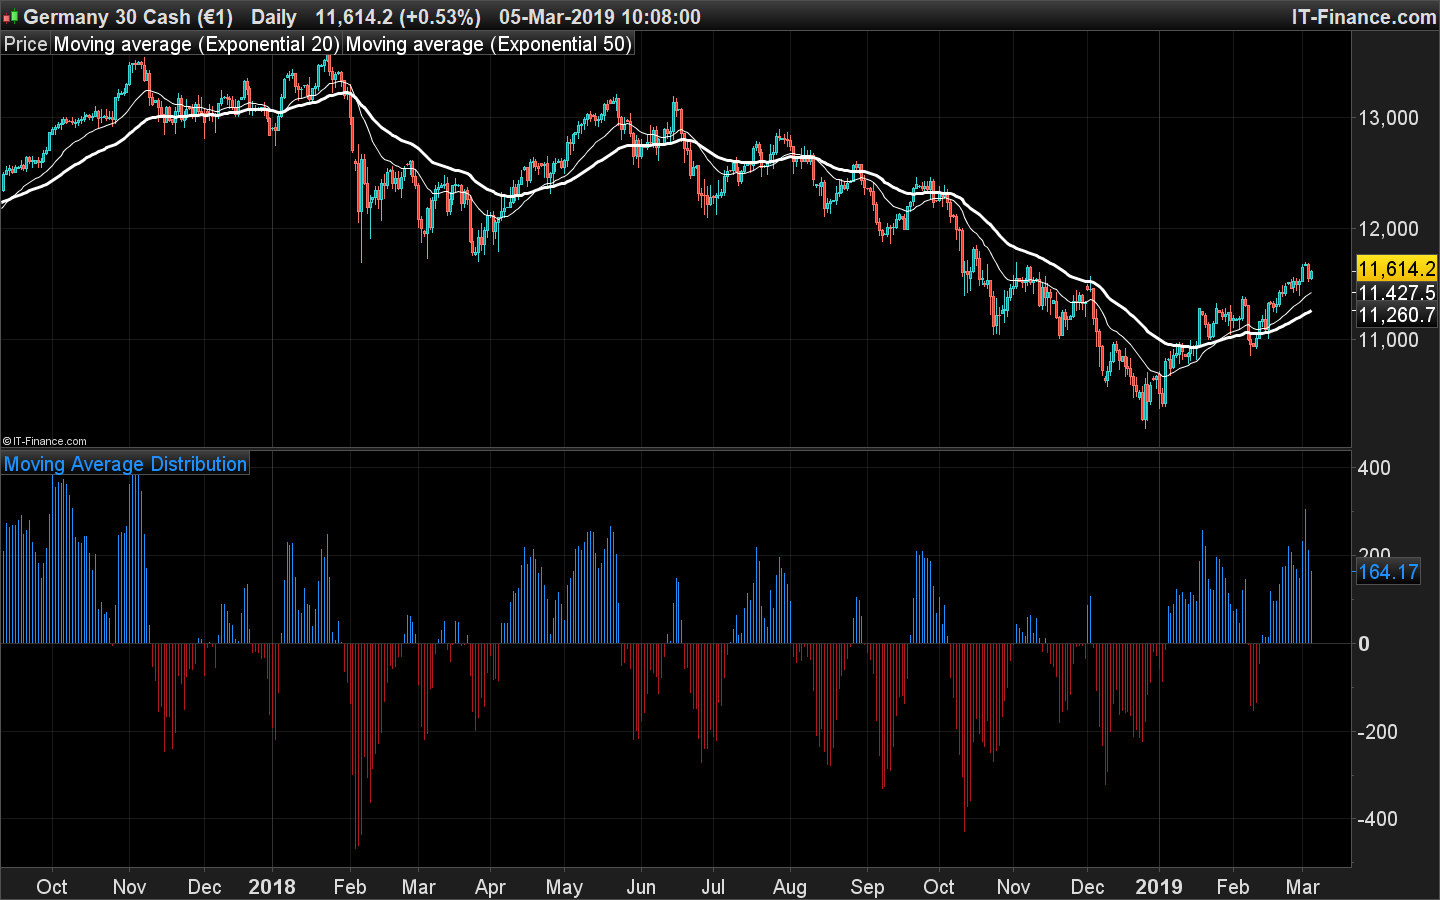
Indicator based on Shay Campbells’ E-Mini Swing Trading System where he uses a technique to enter the market based on pull backs of the price based upon a Moving Average Distribution indicator.
“Using a very short moving average of median price does a good job of defining a usable equilibrium point. A distribution can then be calculated around that equilibrium by subtracting the equilibrium point from the market price.
To normalize these readings for volatility, this result is then divided by the recent daily range of price.
- Buy Signal= Trend Direction is Up (6 to 9 month Mov Ave) and the MA Distribution registers a significant Pullback, i.e, negative value.
- Sell Signal= Trend Direction is Down and the MA Distribution registers a significant Pullback, i.e, positive value.”
The code calculate the Average Daily Range, so in order to make it possible, please extend the units displayed on your chart to have at least the ADRperiod number of days. Should not be a problem on a daily timeframe though.
Coded following a request in this topic: How would you create a Mov Ave Distribution Histogram?
|
1 2 3 4 5 6 7 8 9 10 11 12 13 14 15 16 17 18 19 20 21 22 23 24 25 26 27 28 29 30 31 32 |
//PRC_MovingAverage Distribution | indicator //05.03.2019 //Nicolas @ www.prorealcode.com //Sharing ProRealTime knowledge // --- settings ShortMAPeriod = 20 ADRperiod = 20 // --- end of settings //compute ADR sum=0 for i = 0 to ADRperiod-1 do sum=sum+(dhigh(i)-dlow(i)) next adr=sum/ADRperiod shortMA=average[ShortMAPeriod](medianprice) diff=medianprice-shortMA r=176 g=23 b=31 MAD=(diff*100)/adr if MAD>0 then r=30 g=144 b=255 endif return MAD coloured(r,g,b) style(histogram) as "Moving Average Distribution" |
Share this
No information on this site is investment advice or a solicitation to buy or sell any financial instrument. Past performance is not indicative of future results. Trading may expose you to risk of loss greater than your deposits and is only suitable for experienced investors who have sufficient financial means to bear such risk.
ProRealTime ITF files and other attachments :PRC is also on YouTube, subscribe to our channel for exclusive content and tutorials

Nicolas, I detected a problem with this indicator when I want to change the medium short period; you can do this only by varying the code while it is impossible to do it directly on the indicator chart settings. Thank you
It may be possible that the variables are still present in the code while they are also in the settings. In this case, delete the variables in the code (lines 7 and 8).
I found this solution, thanks
thanks Nicolas