

Low-High Bands
September 16, 2016, 10:35 AM
Indicators
5 Comments
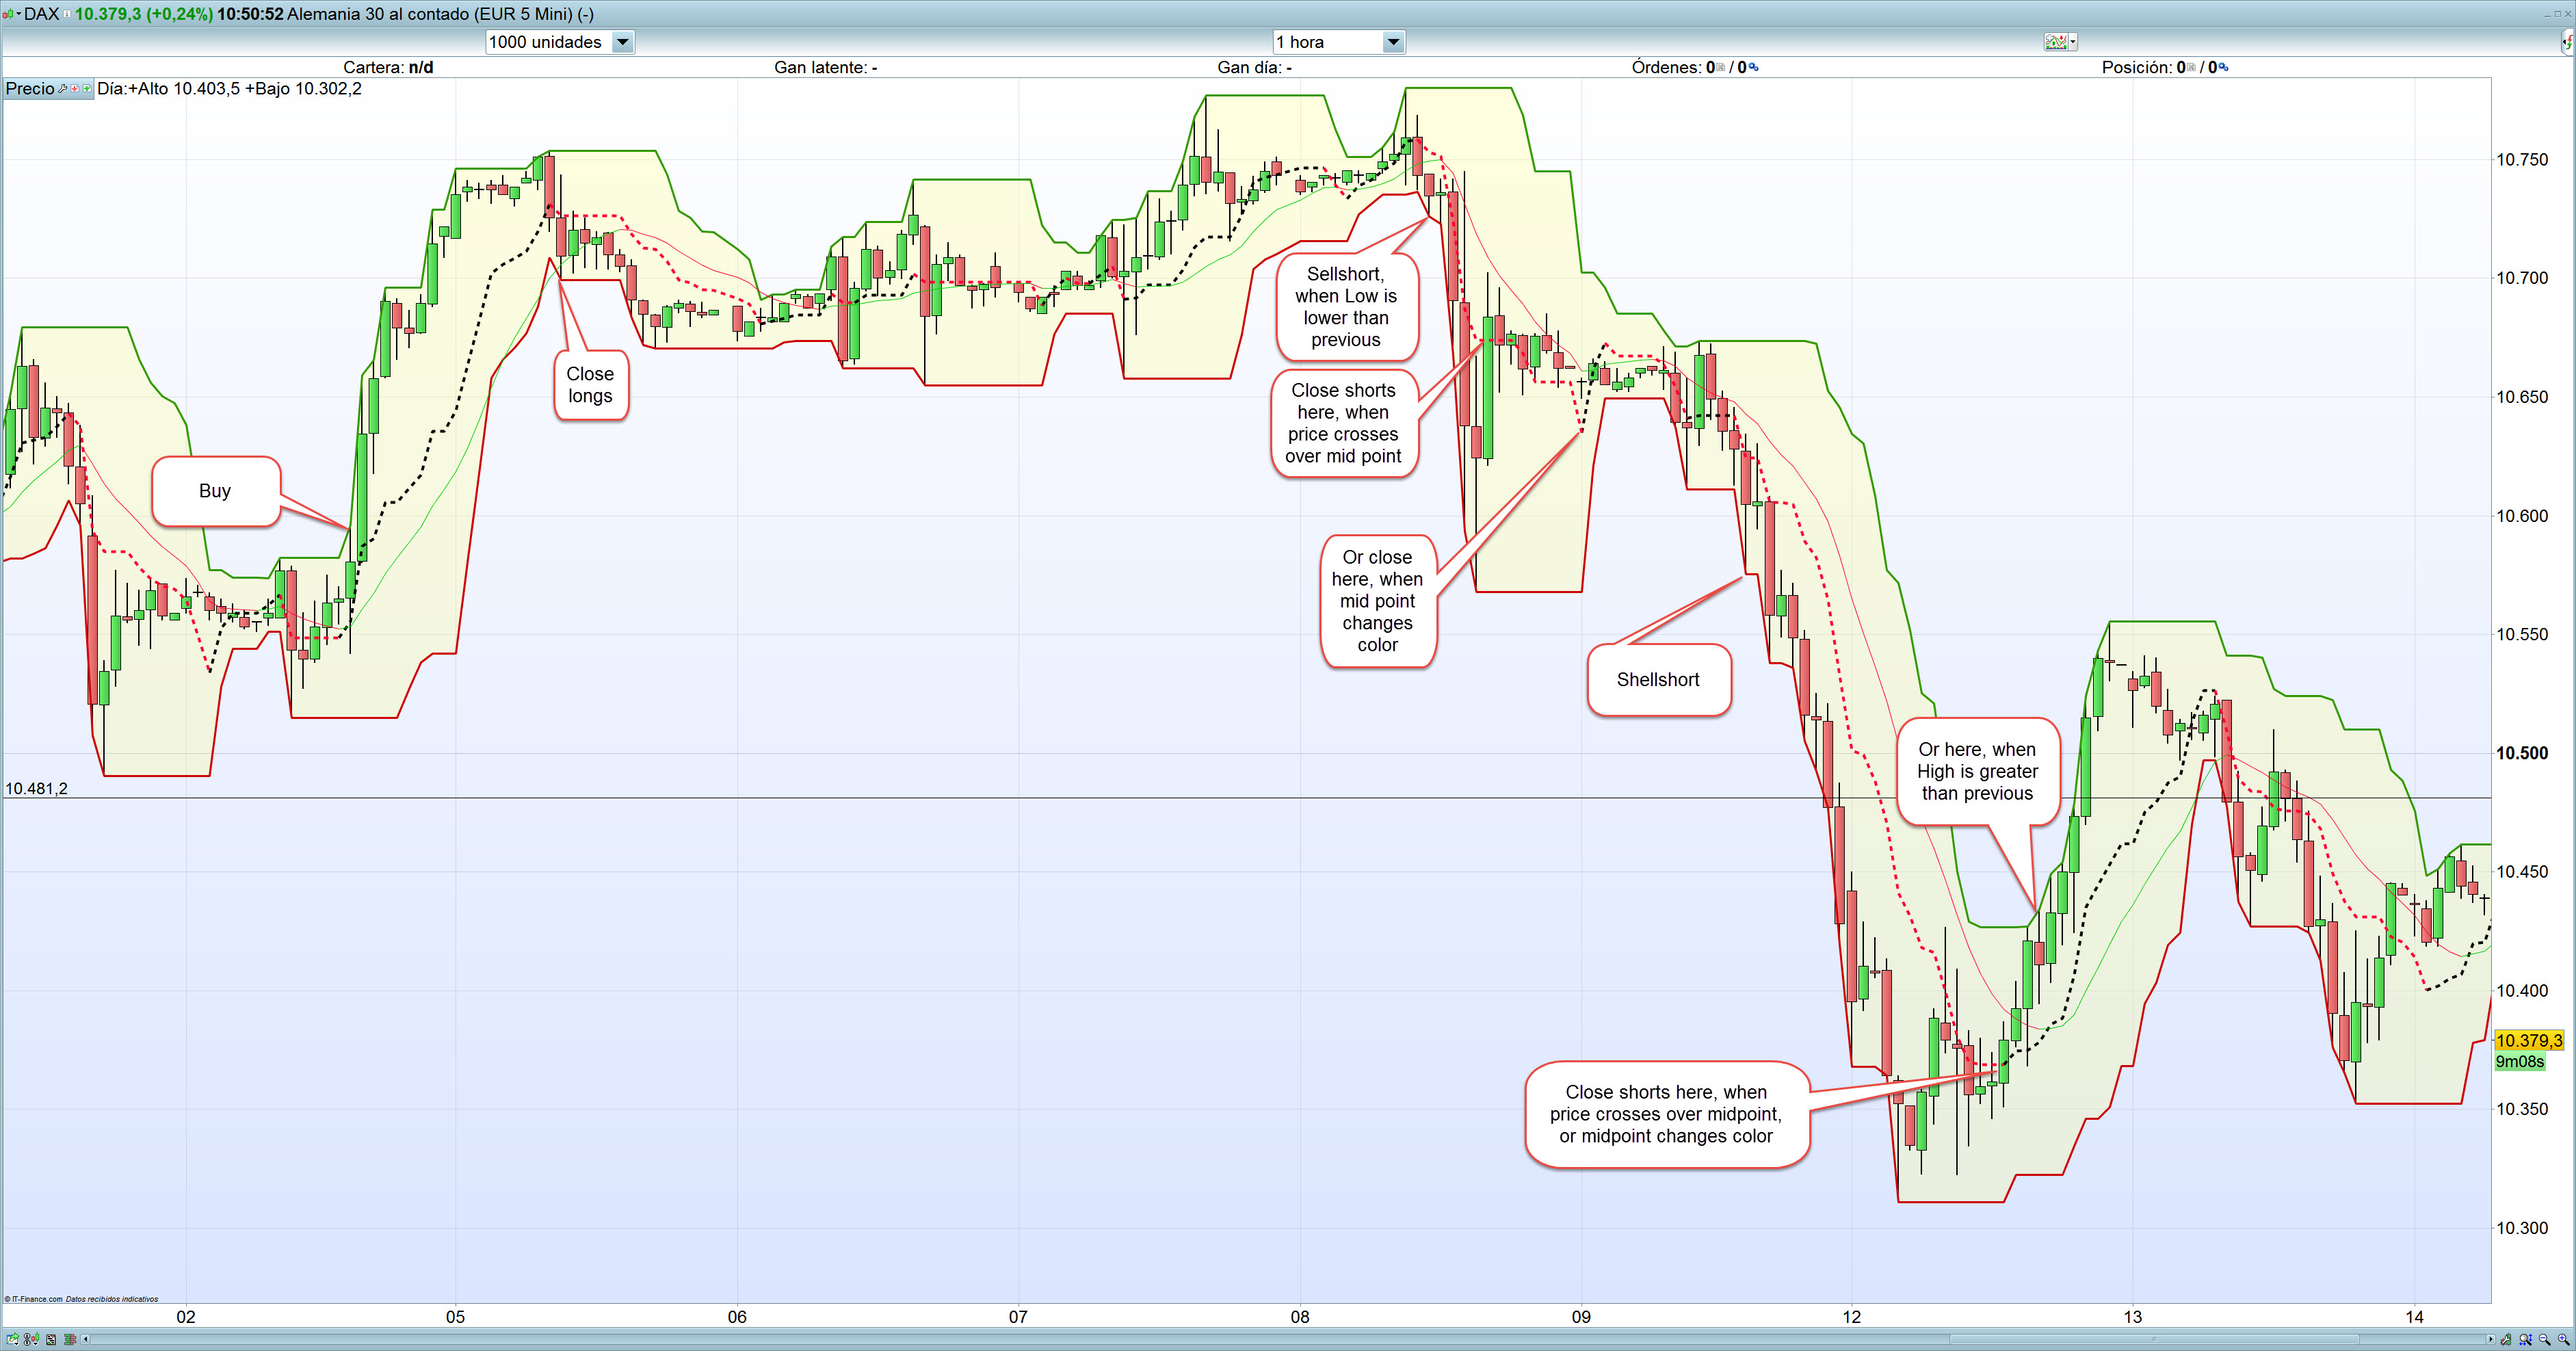
This is a very simple indicator, but useful for longs and shorts.
It gives the highest high, the lowest low, the middle point between both and an exponential average of the middle point of the last x periods.
There are some possibilities which can indicate the in and out for each trade:
- Buy longs if the upper band is higher than the previous value
- Or if the mid point changes the color from red to black
- Close longs if lower bands is lower than previous value
- Or if midpoint changes from black to red
- The same procedure for shorts
The standard values of the variables are:
x=10 (number of periods of the bands)
y=8 (number of periods of the EMA, exponential average of the middle point)
You can also play with the EMA instead of the mid point, if you want, or change the periods of bands and EMA depending on the timeframe or on your aggressiveness.
c1=highest[x](high)//x=10
c2=lowest[x](low)
c3=c2+(c1-c2)/2//Mid point
mpm=ExponentialAverage[y](c3)//y=8
RETURN c1 AS "Highest", c2 AS "Lowest", c3 AS "Mid point", mpm AS "EMA over Midpoint"
Download
Filename:
Low-High-Bands.itf
Downloads:
199
Veteran
Operating in the shadows, I hack problems one by one. My bio is currently encrypted by a complex algorithm. Decryption underway...
Author’s Profile
Loading...