







M-Oscillator
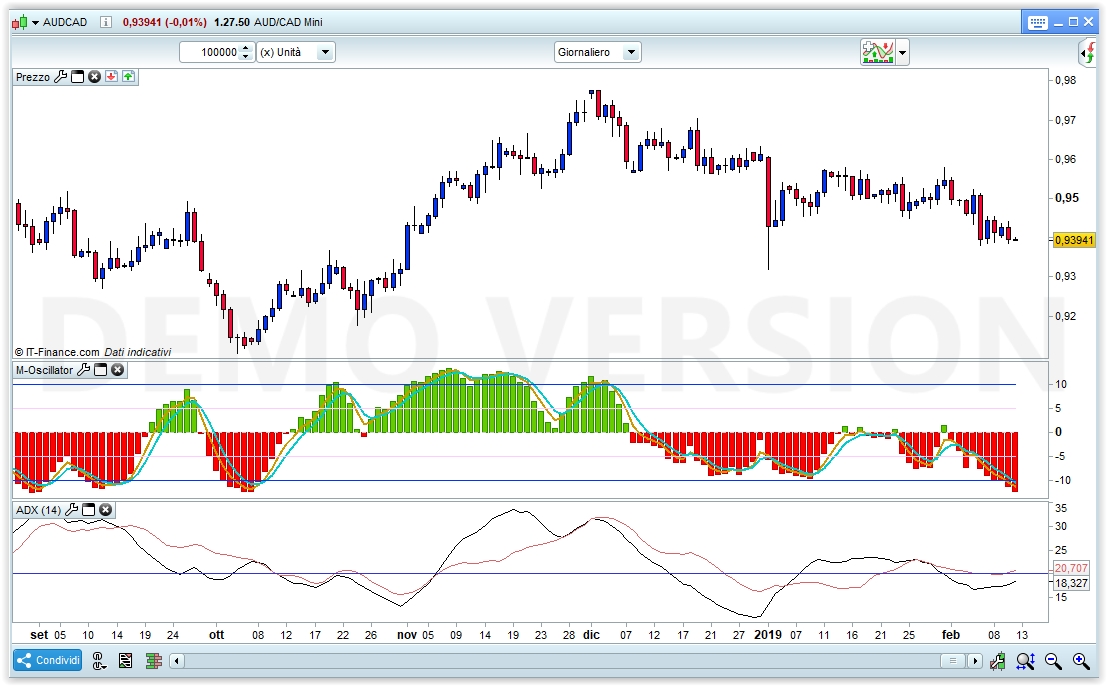
M – Oscillator
An improvement of the Momentum Oscillator – Published on IFTA Journal 2018 by Mohamed Fawzy (pages 28-53)
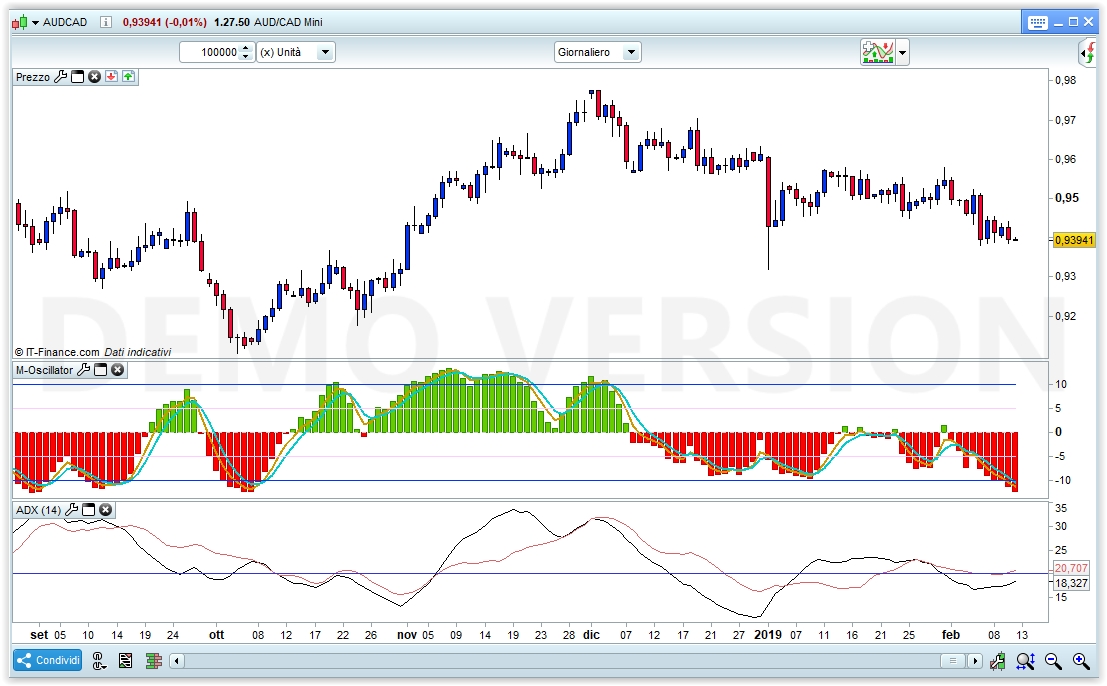
a value > 10 is considered OverBought
a value < -10 is considered OverSold
In sharp upward moves the M-Oscillator ranges from 5 to 14
In sharp downward moves the M-Oscillator ranges from -5 to -14
In an UpTrend value ranges from 0 through 14
In a DownTrend value ranges from 0 through -14
Usually a SHORT signal is generated when, after entering the OB area, the M-Oscillator re-crosses it downwards
Usually a LONG signal is generated when, after entering the OS area, the M-Oscillator re-crosses it upwards
(such indications are valid in sideways markets, because in trending markets, values may remain in the OS/OS area
for quite a long time)
ADX can be used in conjunction to detect a range when its value is < 25
Divergences, like for other oscillators, can be taken advantage of.
DEFPARAM CalculateOnLastBars = 1000
Period = 14                       //Number of Periods
ct     = close                    //Today's close
S      = 0
FOR i  = 1 TO Period
   cp  = close[i]
   r = (ct - cp) > 0              //R = Today's CLOSE - Previous Day's CLOSE,  1 = today > yesterday
   IF r = 0 THEN
      r = ((ct - cp) < 0) * -1    //R = Today's CLOSE - Previous Day's CLOSE, -1 = today < yesterday
   ENDIF
   s = s + r                      //Sum up all r's
NEXT
Ema5 = ExponentialAverage[5](s)   //Histogram
Ema3 = ExponentialAverage[3](Ema5)//M-Oscillator
Ema3b= ExponentialAverage[3](Ema3)//Signal Line
RETURN Ema5 AS "Histo",Ema3 AS "M-Oscillator",Ema3B AS "Signal Line", 0 AS "Zero", 10 AS "Ob", -10 AS "Os",5 AS "MidUP",-5 AS "MidDN"
Comments
You must be logged in to post a comment.
Thank you swapping.

This is a rally interesting indicator. I read the whole article and I tried to run some quick backtest. The results are very variable. What I noticed though is that if the Ichimoku Kumo is used to define the trend (and not the EMA60) the percentage of winning trades increases significantly and also the gain per trade....food for thoughts :)
Great! Thanks.

Sorry for my late reply. I’ll make it and open a new topic quite soon.
The above link is to the IFTA Journal as reported on the indicator
Grazie luxrun

ah ah ! je n'avais pas vue celui-ci, excellent robert ;)