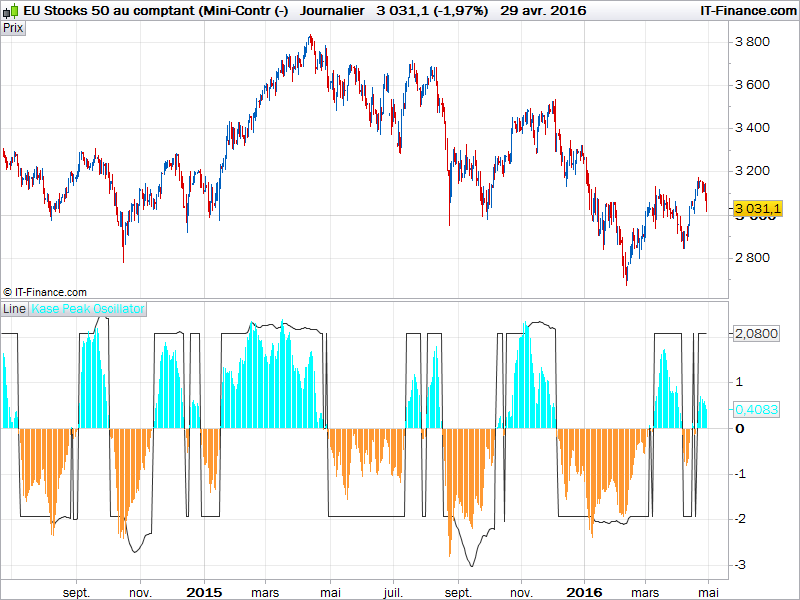
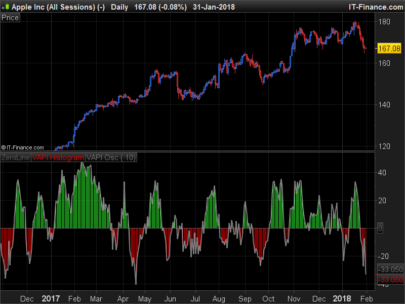
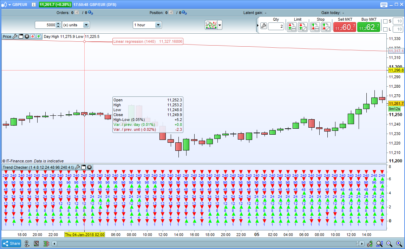
The Kase Peak Oscillator is made of statistical observation of prices over the last KPeriod. It automatically adapt its cycle to any timeframe or instrument by using a percentile rank of what happen now in comparison of the whole distribution of past values.
The KPeriod would be adapted to trade horizons.
|
1 2 3 4 5 6 7 8 9 10 11 12 13 14 15 16 17 18 19 20 21 22 23 24 25 26 27 |
KPeriod = 30 sq = sqrt(KPeriod) rge = averagetruerange[KPeriod] RWHL = ((High-Low[KPeriod])-(High[KPeriod]-Low)) / (rge*sq) Pk = weightedaverage[3](RWHL) mnn = average[KPeriod](Pk) dSum=0 for i = 0 to KPeriod do dSUM = dSUM+(Pk[i]-mnn)*(Pk[i]-mnn) next sd = sqrt(dSUM/KPeriod) v1 = MAX(2.08,mnn+(1.33*sd)) v2 = MIN(-1.92,mnn-(1.33*sd)) if (pK[1]>=0 and pK>0) then Line = v1 elsif (pK[1]<=0 and pK<0) then Line = v2 else Line = 0 endif RETURN Line as "Line", pK as "Kase Peak Oscillator" |
Share this
No information on this site is investment advice or a solicitation to buy or sell any financial instrument. Past performance is not indicative of future results. Trading may expose you to risk of loss greater than your deposits and is only suitable for experienced investors who have sufficient financial means to bear such risk.
ProRealTime ITF files and other attachments :
Find other exclusive trading pro-tools on ![]()
PRC is also on YouTube, subscribe to our channel for exclusive content and tutorials


Hi Nicolas,
I found the original code for the Kase Peak Oscillator in Metatrader.
The current public version uses predefined fixed values of 2.08 and -1.92 for the Peak Out line. As you’ll recall the KPO uses a 50 period cycle look back (looking for max values of the RWI Low and Highs) which allows it to use “a statistical measure of trend or serial dependency over a look-back length that adapts automatically to the most significant cycle length.”
I also have the code for the Kase Permission Screen and the Kase CD (convergence/divergence) Indicator. Would you like me to post it here or add it to the conversation in post #5675 — Choppiness Index and Range Trading where I posted info about Kase’s PeakOscillator? There is also an improved version of the Kase Dev Stop using a RWI crossover.
Cheers
Brad
You can create a new thread instead to keep things clear. Do you need new conversion to prorealtime from these new codes?
Yes thanks, if you could, they’re in Metatrader and I think you will find them an improvement, particularly having the Kase CD as well. I’ll clean them up a bit so the lines and lines of spacing of between portions of the code are minimised.p.s. I posted on the indicator builder part of the forums earlier (Subject starts with “This looks interesting – this indicator measures how many ATR units…” The first post had a wrong bit of code but I couldn’t find it when i searched the forum, I reposted with the correct bit of code and now I come back to that Safari tab hours later and the text is still in the bottom of the window in the editor? So I looked for it but again but I can’t see it in the forum, so I posted it again… It occurs to me now that there may actually be 3 posts up now…. sorry if there is, (it’s the last one thats relevant).Cheers
p.s. Is there a way to send you a private message on this forum Nicolas?
You can use the contact form in the help section of the navigation bar (top menu) of the website.
Cheers Nicolas, I sent an email earlier this evening.
Hi Nicolas, re-upping the coding request as you suggested for the genuine version of Kase’s Oscillator and Con/Divergence indicator. If you recall this is the one that had a statistical 78% leading signal entry accuracy (the indicator is accurate in signifying coming market turns) when tested on 47,000 days of data, or about 185 years in total. A higher accuracy entry will have a positive knock on effect on the more important aspects of money management risk/reward ratios, that can in turn increase trade size, and lower drawdowns. Thanks, Bard
FYI: I found this other code in an old NL forum:
pri=Customcloselen=psmooth=catr = AverageTrueRange[len](pri)/// Kase Peak Osc ///RWH=(High-Low[len])/(atr*SQRT(len))RWL=(High[len]-Low)/(atr*SQRT(len))X=RWH-RWLpek=WeightedAverage[smooth](X)mean=Average[len](pek)sd=STD[len](pek)c1=(mean+(1.33*sd)) > 2.08c2=(mean-(1.33*sd)) < -1.92c3=pek[1] >= 0 And pek > 0c4=pek[1] <= 0 And pek < 0If c1 Thenv1=mean+(1.33*sd)Elsev1=2.08EndifIf c2 Thenv2=mean-(1.33*sd)Elsev2=-1.92EndifIf c3 Thenv3=v1Elsif c4 Thenv3=v2Elsev3=0Endif/// Kase CD ///pk=WeightedAverage[smooth](X)KCD=(pk)-Average[8](pk)Return pek as “Kase Peak Osc”, v3 as “Peak Osc Line”, KCD as “Kase CD”(p = length (30) ; c = smooth (3))
Thanks very much Nicolas, but I can’t post my reply here if I want to add a url link. When I added a URL link in my first original reply I inserted the url and this page then just jumped to the bottom of the page and every time I try to get back to this text field where I am writing this now it jumps back to the bottom of the page? It’s impossible and very frustrating as I’ve never seen this problem with my Macbook + Safari on any other public forums I have used! I just refreshed this page to see if that helped thinking the cookie might at least save my original reply here (because I can’t access it due to the jumping page issue) but it’s an empty white text box and I have lost the text of my original reply… so I’m having to start my reply all over again. (What your reading right now is my second attempt and I won’t be able to add the url link I wanted).I am going to move this Kase Peak Oscillator, Kase CD and Kase Permission Screen to a new thread as you suggested.I was trying to reply to point out that the 2.08 and -1.92 for the Peak Out line are an incorrect work around to Kase’s original code which I emailed you on the 1st March. Pls see my very first comment above.CheersBard