

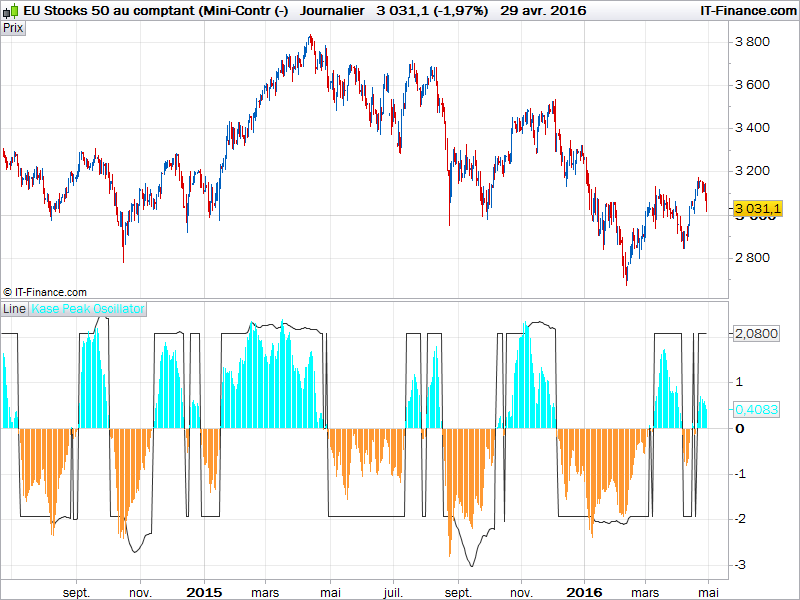
Kase Peak Oscillator
April 30, 2016, 10:28 AM
Indicators
9 Comments
The Kase Peak Oscillator is made of statistical observation of prices over the last KPeriod. It automatically adapt its cycle to any timeframe or instrument by using a percentile rank of what happen now in comparison of the whole distribution of past values.
The KPeriod would be adapted to trade horizons.
KPeriod = 30

sq = sqrt(KPeriod)
rge = averagetruerange[KPeriod]
RWHL = ((High-Low[KPeriod])-(High[KPeriod]-Low)) / (rge*sq)
Pk = weightedaverage[3](RWHL)

mnn = average[KPeriod](Pk)

dSum=0
for i = 0 to KPeriod do
 dSUM = dSUM+(Pk[i]-mnn)*(Pk[i]-mnn)
next
sd = sqrt(dSUM/KPeriod)

v1 = MAX(2.08,mnn+(1.33*sd))
v2 = MIN(-1.92,mnn-(1.33*sd))

if (pK[1]>=0 and pK>0) then
 Line = v1
elsif (pK[1]<=0 and pK<0) then
 Line = v2
else
 Line = 0
endif

RETURN Line as "Line", pK as "Kase Peak Oscillator"
Download
Filename:
Kase-Peak-Oscillator.itf
Downloads:
106
Master
I created ProRealCode because I believe in the power of shared knowledge. I spend my time coding new tools and helping members solve complex problems.
If you are stuck on a code or need a fresh perspective on a strategy, I am always willing to help. Welcome to the community!
Author’s Profile
Loading...