







Volume Accumulation Percentage Indicator
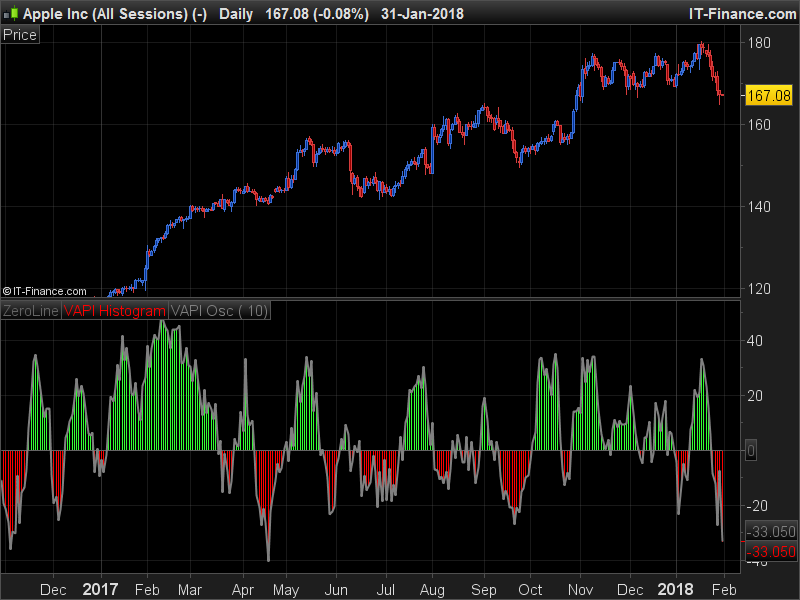
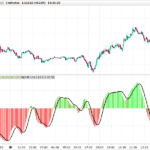
Volume Accumulation Percentage Indicator (VAPI) is a variation of the classic volume-accumulation indicators. It uses volume the same way as OBV except that it assigns volume weights based on intraday volatility .
In a positive trend, if the stock price is close to a (local) new high, the VAPI should be at its maximum as well (and vice versa for a negative trend). If the market is looking for a direction, if the price is in the bottom side of his current trading range and if, at the same moment the VAPI osc slopes up, there is accumulation on the stock and that the prices should start to climb. The SELL signal is given when the VAPI decreases (distribution). Divergences are usually very effective too.
(description from its original author LazyBear, code original from tradingview platform).
Translated by a request in the Italian ProRealTime’s indicators section.
//PRC_VolumeAccumPercent VAPI | indicator
//31.01.18
//Nicolas @ www.prorealcode.com
//Sharing ProRealTime knowledge
//translated from tradingview code
//original author: LazyBear

// --- settings
length=10
// ---

x=(2*close-high-low)/(high-low)
tva=summation[length](volume*x)
tv=summation[length](volume)
va=100*tva/tv

r=50
g=255
b=50
if va<0 then
 r=255
 g=0
 b=0
endif

return 0 coloured(100,100,100) as "ZeroLine", va coloured(r,g,b) style(histogram,1) as "VAPI Histogram", va coloured(128,128,128) style(line,2) as "VAPI Osc"
Hola Nicolas, a ver si me puedes ayudar. Hay un indicador que se llama volumen stop de bolsatrilera que esta aqui en prorealcode.Este indicador da buenas señales.El indicador pinta la vela en azul cuando es alcista y en negro cuando es bajista.Yo necesitaria un proescreener que detecte las acciones que han pintado la vela azul, alcista.Gracias de antemano y un saludo.