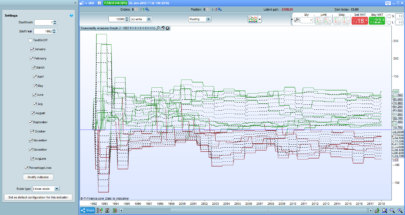
Being aware of seasonality is an important part of any traders toolbox so I wrote this indicator to analyse any market month by month from any available date in the past to the present month.
Apply on any market but only on monthly charts.
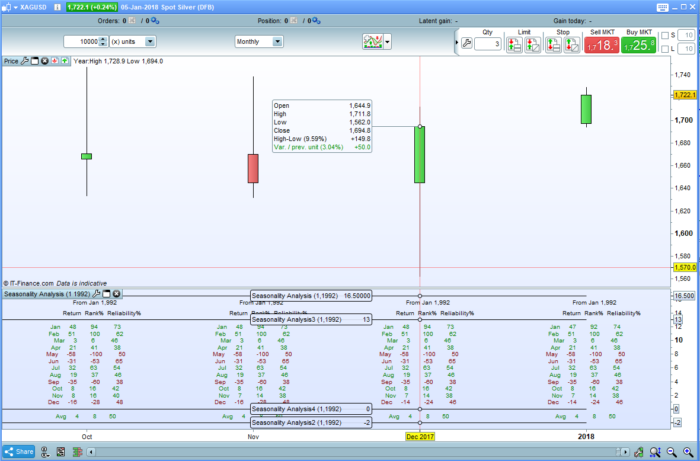
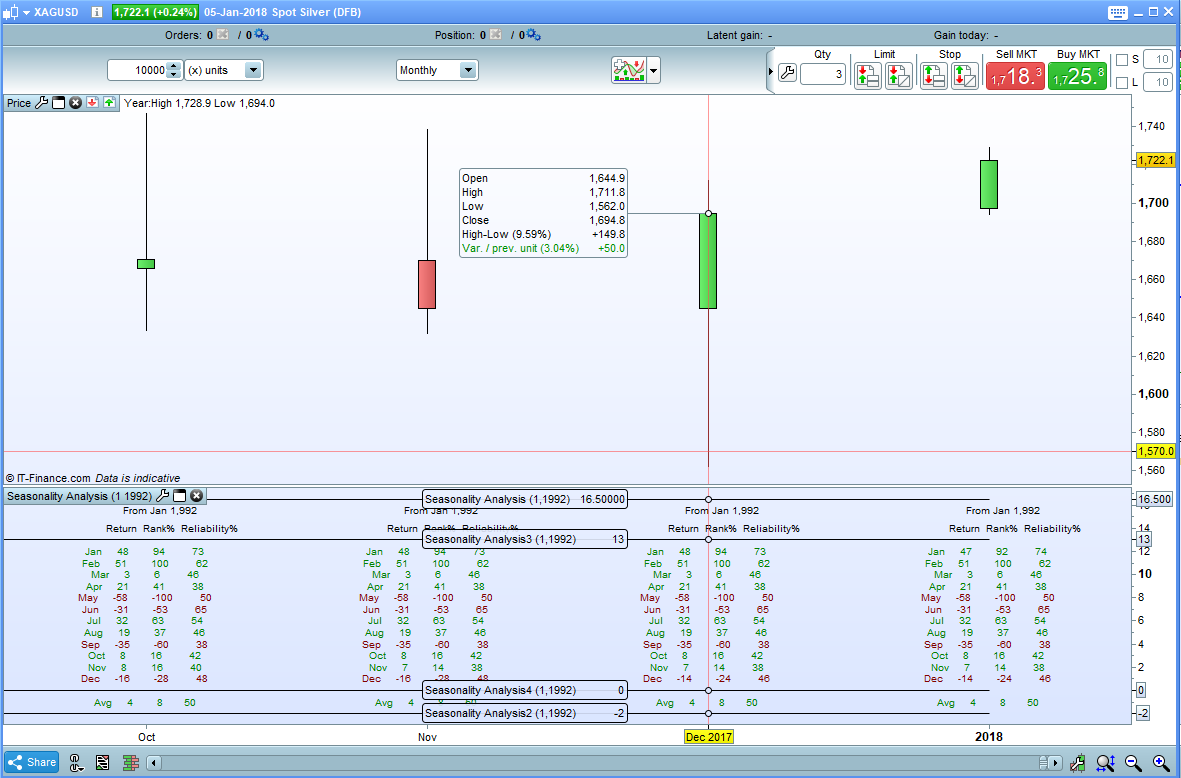
It is always a good idea to compare shorter look back periods with a longer look back period to help gauge the reliability of seasonality results. You can enter the start year and start month required so you can quickly compare market seasonality over different look back periods.
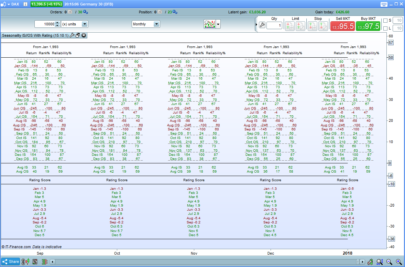
The results you are interested in are the last ones under the current months candle. They are as follows:
Return: The average pips return in that month over the period tested. If you had opened a long bet at the beginning of that month and closed it at the end of that month every year then this is how much you would have gained or lost on average each month.
Rank%: The best performing monthly average return and the worst performing monthly average return are ranked at 100% and -100%. All months in between are given a ranking% relative to these. This is useful if you want to alter position sizing in a strategy month by month based on seasonality. You might want to place position size of 100% of your maximum bet size in months rated at 100% and only 33% in months rated 33% for example.
Reliability%: The number of up months and number of down months are totalled up and a reliability percentage calculated. For example if you test over 10 years and have ten tests of January and January’s results favour long positions then if 7 of those months see a gain and 3 a loss then the reliability is 70%. You may wish to only go long in months with a Reliability% of over 70% for example. This reliability% helps you decide the probability of future results matching historical results.
I suggest downloading the .ITF file and importing it to get full functionality rather than cutting and pasting the code.
|
1 2 3 4 5 6 7 8 9 10 11 12 13 14 15 16 17 18 19 20 21 22 23 24 25 26 27 28 29 30 31 32 33 34 35 36 37 38 39 40 41 42 43 44 45 46 47 48 49 50 51 52 53 54 55 56 57 58 59 60 61 62 63 64 65 66 67 68 69 70 71 72 73 74 75 76 77 78 79 80 81 82 83 84 85 86 87 88 89 90 91 92 93 94 95 96 97 98 99 100 101 102 103 104 105 106 107 108 109 110 111 112 113 114 115 116 117 118 119 120 121 122 123 124 125 126 127 128 129 130 131 132 133 134 135 136 137 138 139 140 141 142 143 144 145 146 147 148 149 150 151 152 153 154 155 156 157 158 159 160 161 162 163 164 165 166 167 168 169 170 171 172 173 174 175 176 177 178 179 180 181 182 183 184 185 186 187 188 189 190 191 192 193 194 195 196 197 198 199 200 201 202 203 204 205 206 207 208 209 210 211 212 213 214 215 216 217 218 219 220 221 222 223 224 225 226 227 228 229 230 231 232 233 234 235 236 237 238 239 240 241 242 243 244 245 246 247 248 249 250 251 252 253 254 255 256 257 258 259 260 261 262 263 264 265 266 267 268 269 270 271 272 273 274 275 276 277 278 279 280 281 282 283 284 285 286 287 288 289 290 291 292 293 294 295 296 297 298 299 300 301 302 303 304 305 306 307 308 309 310 311 312 313 314 315 316 317 318 319 320 321 322 323 324 325 326 327 328 329 330 331 332 333 334 335 336 337 338 339 340 341 342 343 344 345 346 347 348 349 350 351 352 353 354 355 356 357 358 359 360 361 362 363 364 365 366 367 368 369 370 371 372 373 374 375 376 377 378 379 380 381 382 383 384 385 386 387 388 389 390 391 392 393 394 395 396 397 398 399 400 401 402 403 404 405 406 |
//Seasonality Analysis //Created by Vonasi //StartMonth = 1 //StartYear = 1997 IF OpenYear = StartYear and OpenMonth = StartMonth THEN Flag = 1 ENDIF IF Flag = 1 THEN IF OpenMonth = 1 THEN JanTotal = JanTotal + (close - open) JanCount = JanCount + 1 IF close > open THEN JanUp = JanUp + 1 ENDIF ENDIF IF OpenMonth = 2 THEN FebTotal = FebTotal + (close - open) FebCount = FebCount + 1 IF close > open THEN FebUp = FebUp + 1 ENDIF ENDIF IF OpenMonth = 3 THEN MarTotal = MarTotal + (close - open) MarCount = MarCount + 1 IF close > open THEN MarUp = MarUp + 1 ENDIF ENDIF IF OpenMonth = 4 THEN AprTotal = AprTotal + (close - open) AprCount = AprCount + 1 IF close > open THEN AprUp = AprUp + 1 ENDIF ENDIF IF OpenMonth = 5 THEN MayTotal = MayTotal + (close - open) MayCount = MayCount + 1 IF close > open THEN MayUp = MayUp + 1 ENDIF ENDIF IF OpenMonth = 6 THEN JunTotal = JunTotal + (close - open) JunCount = JunCount + 1 IF close > open THEN JunUp = JunUp + 1 ENDIF ENDIF IF OpenMonth = 7 THEN JulTotal = JulTotal + (close - open) JulCount = JulCount + 1 IF close > open THEN JulUp = JulUp + 1 ENDIF ENDIF IF OpenMonth = 8 THEN AugTotal = AugTotal + (close - open) AugCount = AugCount + 1 IF close > open THEN AugUp = AugUp + 1 ENDIF ENDIF IF OpenMonth = 9 THEN SepTotal = SepTotal + (close - open) SepCount = SepCount + 1 IF close > open THEN SepUp = SepUp + 1 ENDIF ENDIF IF OpenMonth = 10 THEN OctTotal = OctTotal + (close - open) OctCount = OctCount + 1 IF close > open THEN OctUp = OctUp + 1 ENDIF ENDIF IF OpenMonth = 11 THEN NovTotal = NovTotal + (close - open) NovCount = NovCount + 1 IF close > open THEN NovUp = NovUp + 1 ENDIF ENDIF IF OpenMonth = 12 THEN DecTotal = DecTotal + (close - open) DecCount = DecCount + 1 IF close > open THEN DecUp = DecUp + 1 ENDIF ENDIF ENDIF Jan = Round(JanTotal/JanCount) Feb = Round(FebTotal/FebCount) Mar = Round(MarTotal/MarCount) Apr = Round(AprTotal/AprCount) May = Round(MayTotal/MayCount) Jun = Round(JunTotal/JunCount) Jul = Round(JulTotal/JulCount) Aug = Round(AugTotal/AugCount) Sep = Round(SepTotal/SepCount) Oct = Round(OctTotal/OctCount) Nov = Round(NovTotal/NovCount) Dec = Round(DecTotal/DecCount) IF Jan > 0 THEN JanR = 0 JanG = 128 JanRel = Round((JanUp/JanCount)*100) ELSE JanR = 128 JanG = 0 JanRel = Round(((JanCount - JanUp)/JanCount)*100) ENDIF IF Feb > 0 THEN FebR = 0 FebG = 128 FebRel = Round((FebUp/FebCount)*100) ELSE FebR = 128 FebG = 0 FebRel = Round(((FebCount - FebUp)/FebCount)*100) ENDIF IF Mar > 0 THEN MarR = 0 MarG = 128 MarRel = Round((MarUp/MarCount)*100) ELSE MarR = 128 MarG = 0 MarRel = Round(((MarCount - MarUp)/MarCount)*100) ENDIF IF Apr > 0 THEN AprR = 0 AprG = 128 AprRel = Round((AprUp/AprCount)*100) ELSE AprR = 128 AprG = 0 AprRel = Round(((AprCount - AprUp)/AprCount)*100) ENDIF IF May > 0 THEN MayR = 0 MayG = 128 MayRel = Round((MayUp/MayCount)*100) ELSE MayR = 128 MayG = 0 MayRel = Round(((MayCount - MayUp)/MayCount)*100) ENDIF IF Jun > 0 THEN JunR = 0 JunG = 128 JunRel = Round((JunUp/JunCount)*100) ELSE JunR = 128 JunG = 0 JunRel = Round(((JunCount - JunUp)/JunCount)*100) ENDIF IF Jul > 0 THEN JulR = 0 JulG = 128 JulRel = Round((JulUp/JulCount)*100) ELSE JulR = 128 JulG = 0 JulRel = Round(((JulCount - JulUp)/JulCount)*100) ENDIF IF Aug > 0 THEN AugR = 0 AugG = 128 AugRel = Round((AugUp/AugCount)*100) ELSE AugR = 128 AugG = 0 AugRel = Round(((AugCount - AugUp)/AugCount)*100) ENDIF IF Sep > 0 THEN SepR = 0 SepG = 128 SepRel = Round((SepUp/SepCount)*100) ELSE SepR = 128 SepG = 0 SepRel = Round(((SepCount - SepUp)/SepCount)*100) ENDIF IF Oct > 0 THEN OctR = 0 OctG = 128 OctRel = Round((OctUp/OctCount)*100) ELSE OctR = 128 OctG = 0 OctRel = Round(((OctCount - OctUp)/OctCount)*100) ENDIF IF Nov > 0 THEN NovR = 0 NovG = 128 NovRel = Round((NovUp/NovCount)*100) ELSE NovR = 128 NovG = 0 NovRel = Round(((NovCount - NovUp)/NovCount)*100) ENDIF IF Dec > 0 THEN DecR = 0 DecG = 128 DecRel = Round((DecUp/DecCount)*100) ELSE DecR = 128 DecG = 0 DecRel = Round(((DecCount - DecUp)/DecCount)*100) ENDIF Avg = Round((Jan + Feb + Mar + Apr + May + Jun + Jul + Aug + Sep + Oct + Nov + Dec)/12) AvgCount = (JanCount + FebCount + MarCount + AprCount + MayCount + JunCount + JulCount + AugCount + SepCount + OctCount + NovCount + DecCount) AvgUp = (JanUp + FebUp + MarUp + AprUp + MayUp + JunUp + JulUp + AugUp + SepUp + OctUp + NovUp + DecUp) IF Avg > 0 THEN AvgR = 0 AvgG = 128 AvgRel = Round((AvgUp/AvgCount)*100) ELSE AvgR = 128 AvgG = 0 AvgRel = Round(((AvgCount - AvgUp)/AvgCount)*100) ENDIF IF StartMonth = 1 THEN DrawText(" From Jan #StartYear#",barindex,15.5,SansSerif,Standard,10)coloured(0,0,0) ENDIF IF StartMonth = 2 THEN DrawText(" From Feb #StartYear#" ,barindex,15.5,SansSerif,Standard,10)coloured(0,0,0) ENDIF IF StartMonth = 3 THEN DrawText(" From Mar #StartYear#",barindex,15.5,SansSerif,Standard,10)coloured(0,0,0) ENDIF IF StartMonth = 4 THEN DrawText(" From Apr #StartYear#",barindex,15.5,SansSerif,Standard,10)coloured(0,0,0) ENDIF IF StartMonth = 5 THEN DrawText(" From May #StartYear#",barindex,15.5,SansSerif,Standard,10)coloured(0,0,0) ENDIF IF StartMonth = 6 THEN DrawText(" From Jun #StartYear#",barindex,15.5,SansSerif,Standard,10)coloured(0,0,0) ENDIF IF StartMonth = 7 THEN DrawText(" From Jul #StartYear#",barindex,15.5,SansSerif,Standard,10)coloured(0,0,0) ENDIF IF StartMonth = 8 THEN DrawText(" From Aug #StartYear#",barindex,15.5,SansSerif,Standard,10)coloured(0,0,0) ENDIF IF StartMonth = 9 THEN DrawText(" From Sep #StartYear#",barindex,15.5,SansSerif,Standard,10)coloured(0,0,0) ENDIF IF StartMonth = 10 THEN DrawText(" From Oct #StartYear#",barindex,15.5,SansSerif,Standard,10)coloured(0,0,0) ENDIF IF StartMonth = 11 THEN DrawText(" From Nov #StartYear#",barindex,15.5,SansSerif,Standard,10)coloured(0,0,0) ENDIF IF StartMonth = 12 THEN DrawText(" From Dec #StartYear#",barindex,15.5,SansSerif,Standard,10)coloured(0,0,0) ENDIF Bottom = Min(Dec,Min(Nov,Min(Oct,Min(Sep,Min(Aug,Min(Jul,Min(Jun,Min(May,Min(Apr,Min(Mar,MIN(Feb,Jan))))))))))) Top = Max(Dec,Max(Nov,Max(Oct,Max(Sep,Max(Aug,Max(Jul,Max(Jun,Max(May,Max(Apr,Max(Mar,Max(Feb,Jan))))))))))) IF Jan > 0 THEN JanPerc = Round((Jan/Top)*100) ELSE JanPerc = 0 - Round((ABS(Jan)/ABS(Bottom))*100) ENDIF IF Feb > 0 THEN FebPerc = Round((Feb/Top)*100) ELSE FebPerc = 0 - Round((ABS(Feb)/ABS(Bottom))*100) ENDIF IF Mar > 0 THEN MarPerc = Round((Mar/Top)*100) ELSE MarPerc = 0 - Round((ABS(Mar)/ABS(Bottom))*100) ENDIF IF Apr > 0 THEN AprPerc = Round((Apr/Top)*100) ELSE AprPerc = 0 - Round((ABS(Apr)/ABS(Bottom))*100) ENDIF IF May > 0 THEN MayPerc = Round((May/Top)*100) ELSE MayPerc = 0 - Round((ABS(May)/ABS(Bottom))*100) ENDIF IF Jun > 0 THEN JunPerc = Round((Jun/Top)*100) ELSE JunPerc = 0 - Round((ABS(Jun)/ABS(Bottom))*100) ENDIF IF Jul > 0 THEN JulPerc = Round((Jul/Top)*100) ELSE JulPerc = 0 - Round((ABS(Jul)/ABS(Bottom))*100) ENDIF IF Aug > 0 THEN AugPerc = Round((Aug/Top)*100) ELSE AugPerc = 0 - Round((ABS(Aug)/ABS(Bottom))*100) ENDIF IF Sep > 0 THEN SepPerc = Round((Sep/Top)*100) ELSE SepPerc = 0 - Round((ABS(Sep)/ABS(Bottom))*100) ENDIF IF Oct > 0 THEN OctPerc = Round((Oct/Top)*100) ELSE OctPerc = 0 - Round((ABS(Oct)/ABS(Bottom))*100) ENDIF IF Nov > 0 THEN NovPerc = Round((Nov/Top)*100) ELSE NovPerc = 0 - Round((ABS(Nov)/ABS(Bottom))*100) ENDIF IF Dec > 0 THEN DecPerc = Round((Dec/Top)*100) ELSE DecPerc = 0 - Round((ABS(Dec)/ABS(Bottom))*100) ENDIF IF Avg > 0 THEN AvgPerc = Round((Avg/Top)*100) ELSE AvgPerc = 0 - Round((ABS(Avg)/ABS(Bottom))*100) ENDIF DrawText("Jan #Jan# #JanPerc# #JanRel#",barindex,12,SansSerif,Standard,10)coloured(JanR,JanG,0) DrawText("Feb #Feb# #FebPerc# #FebRel#",barindex,11,SansSerif,Standard,10)coloured(FebR,FebG,0) DrawText("Mar #Mar# #MarPerc# #MarRel#",barindex,10,SansSerif,Standard,10)coloured(MarR,MarG,0) DrawText("Apr #Apr# #AprPerc# #AprRel#",barindex,9,SansSerif,Standard,10)coloured(AprR,AprG,0) DrawText("May #May# #MayPerc# #MayRel#",barindex,8,SansSerif,Standard,10)coloured(MayR,MayG,0) DrawText("Jun #Jun# #JunPerc# #JunRel#",barindex,7,SansSerif,Standard,10)coloured(JunR,JunG,0) DrawText("Jul #Jul# #JulPerc# #JulRel#",barindex,6,SansSerif,Standard,10)coloured(JulR,JulG,0) DrawText("Aug #Aug# #AugPerc# #AugRel#",barindex,5,SansSerif,Standard,10)coloured(AugR,AugG,0) DrawText("Sep #Sep# #SepPerc# #SepRel#",barindex,4,SansSerif,Standard,10)coloured(SepR,SepG,0) DrawText("Oct #Oct# #OctPerc# #OctRel#",barindex,3,SansSerif,Standard,10)coloured(OctR,OctG,0) DrawText("Nov #Nov# #NovPerc# #NovRel#",barindex,2,SansSerif,Standard,10)coloured(NovR,NovG,0) DrawText("Dec #Dec# #DecPerc# #DecRel#",barindex,1,SansSerif,Standard,10)coloured(DecR,DecG,0) DrawText("Avg #Avg# #AvgPerc# #AvgRel#",barindex,-1,SansSerif,Standard,10)coloured(AvgR,AvgG,0) DrawText(" Return Rank% Reliability%",barindex,14,SansSerif,Standard,10)coloured(0,0,0) Hi = 16.5 Mid = 13 Mid2 = 0 Lo = -2 Return Hi, Lo, Mid, Mid2 |
Share this
No information on this site is investment advice or a solicitation to buy or sell any financial instrument. Past performance is not indicative of future results. Trading may expose you to risk of loss greater than your deposits and is only suitable for experienced investors who have sufficient financial means to bear such risk.
ProRealTime ITF files and other attachments :
Find other exclusive trading pro-tools on ![]()
PRC is also on YouTube, subscribe to our channel for exclusive content and tutorials
There is a very minor graphics error in the code for this indicator posted here. Please go to https://www.prorealcode.com/topic/seasonality-analysis-indicator-small-bug-fix/ for the correction and to download the correct ITF file.
I changed the code in the post and so the attached file too. Thank you.
Thank you Nicolas.
There is another very minor bug fix. The indicator description when you hover over the speech bubble is incorrect. I have uploaded a new .itf file here with this minor fix.
https://www.prorealcode.com/topic/seasonality-analysis-indicator-small-bug-fix/#post-57814
great work:-)
Thanks Reiner. that is compliments indeed from the seasonality expert.
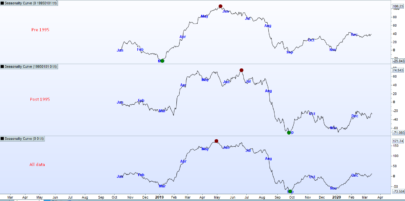
I have a second version that I hope to post in the library soon that has in sample and out of sample periods for more accurate analysis along with a rating system. The next step is split it down into 24 half months but at the moment I have had enough of staring at Jan, Feb, Mar etc for one week!
Hi Vonasi, Can it be presented as a 1 year graph displaying a 5 year average or 10 year average. Currently I do not find so useful the current presentation. Thanks if you can help