







RSI Turbo
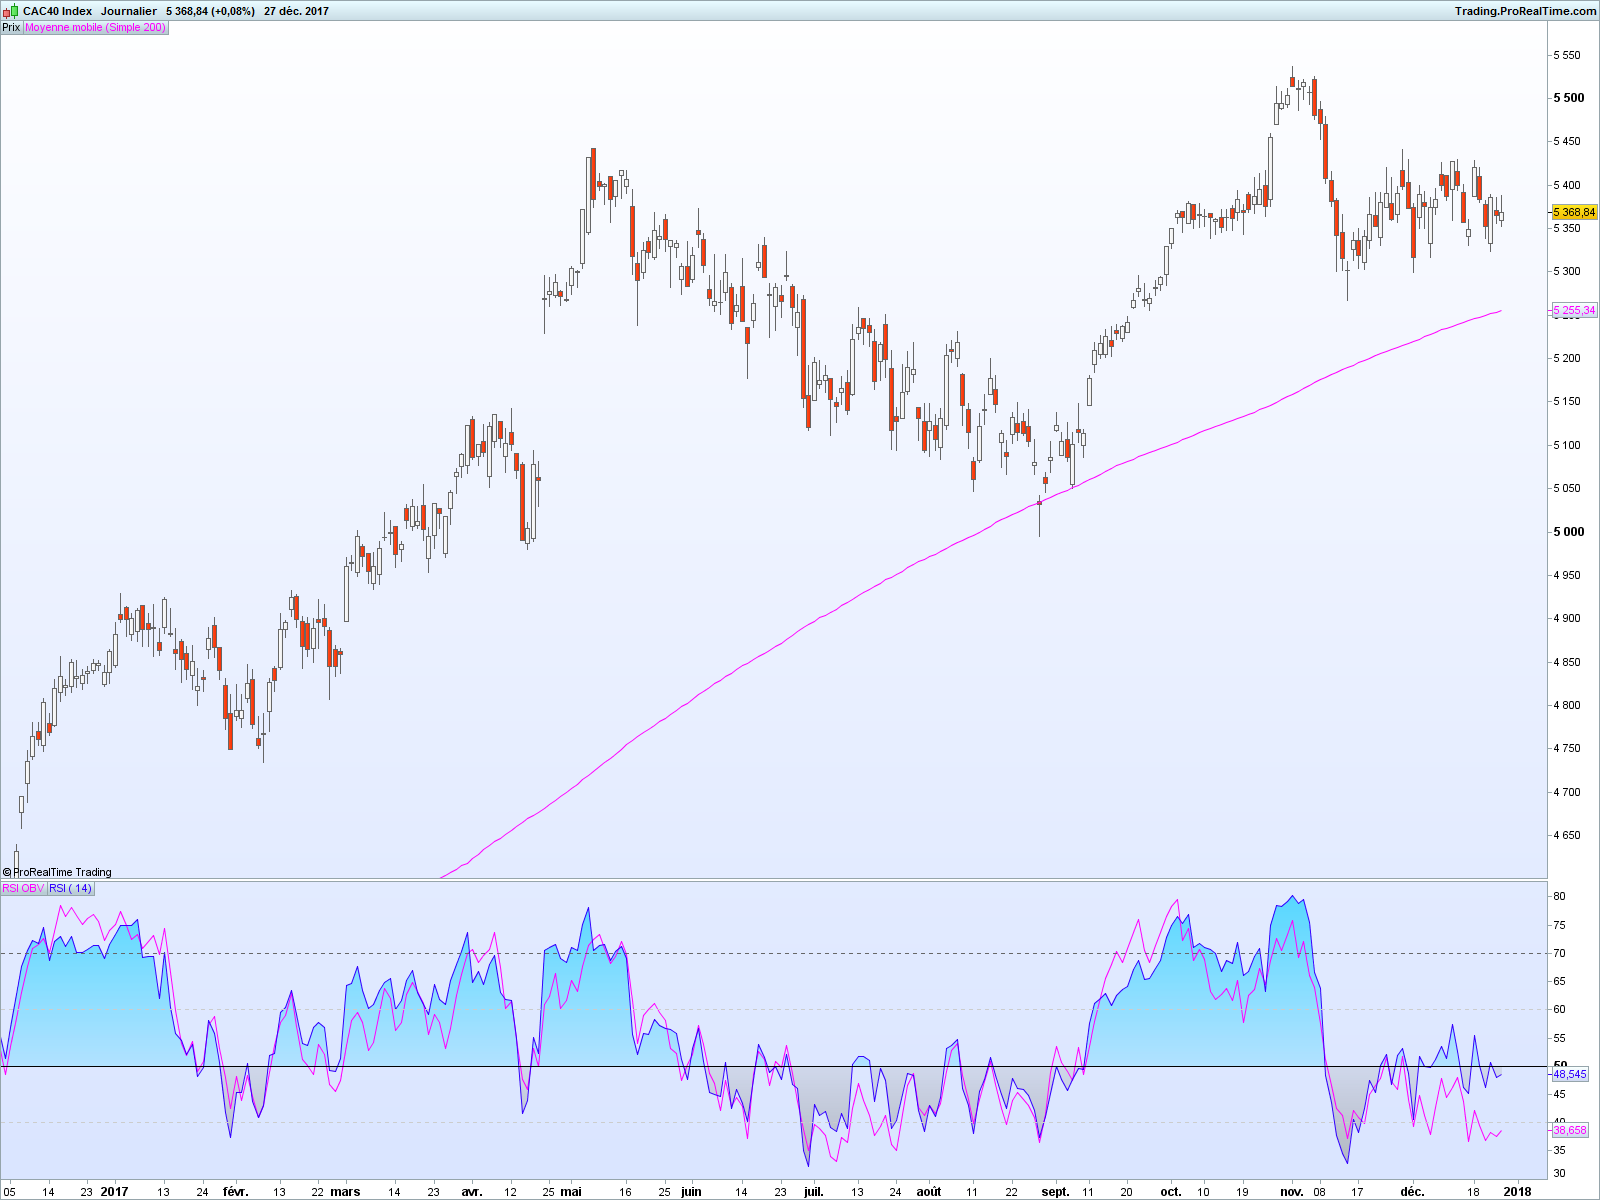
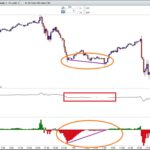
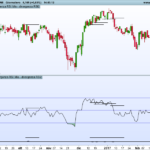
The RSI is a well-known indicator but the idea was to plot a classic price momentum together with an improved OBV momentum (RSI Price & RSI OBV).
The good thing is that we can now see divergence between price momentum & OBV momentum, on top of all the usual stuffs (OB, OS, divergence RSI Vs Price, neutral zone…). I use it on stock charts, on all timeframes bigger than 15/30 minutes.
OBV code by Vitali Apirine.
n=12
//MULTI-VOTE OBV
// Appeared in June 93 issue of Stocks & Commodities magazine.
//if (OpenTime >090000) and (OpenTime < 173001) then
if high > high[1] then
 c1=1
elsif high = high[1] then
 c1= 0
else
 c1=-1
endif

if close > close[1]  then
 c2 = 1
elsif close = close[1] then
 c3= 0
else
 c2=-1
endif

if low > low[1] then
 c3 = 1
elsif low = low[1] then
 c3= 0
else
 c3=-1
endif

b1 = cumsum(((c1+c2+c3)/3)*volume)
b3 = RSI[n](b1)
b4 = RSI[n](close)
Histo= b3-b4

return b3 as "RSI OBV",b4 as "RSI",Histo as "Histo Vol-Prix"
Comments
You must be logged in to post a comment.

Hi, first of all Happy New Year. Well, I've inserted your indicator in DAX 1h but I cannot understand how it works and which are the signals. I'm a rookie. It's not clear to me when buy or sell or whateverelse information. could you please kindly explain how to interpeter it. thanks in advance
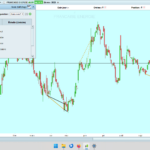
Hi Mao Happy New Year ! This is just an improved RSI where you plot a standard price momentum (RSI14 of price: nothing special) PLUS an additional OBV momentum (RSI of modifed OBV). The idea is to spot the divergence between price momentum and OBV momentum (volume change based on price change). WIth teh RSI you only spot the difference between price and the RSI. For exemple, if you check the screen capture of the last days of December (CAC40 daily) you can see that the standard RSI (based on price, in light blue) confirmed the increase in the price BUT the OBV RSI told you the opposite. You cannot spot such divergence on a simple RSI (it means that the price increase/momentum is not confirmed by a similar increase in volume). Hope that it helps.