Market Mode

v10.3
Market Mode

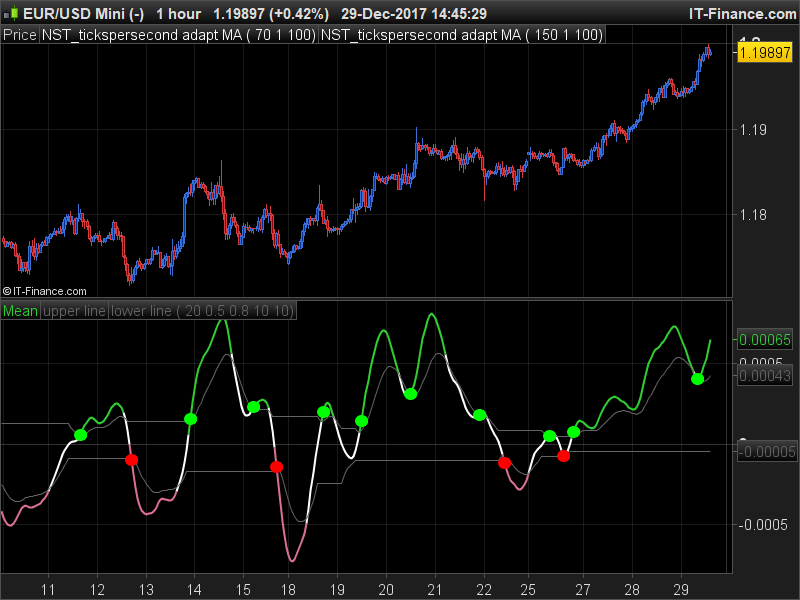
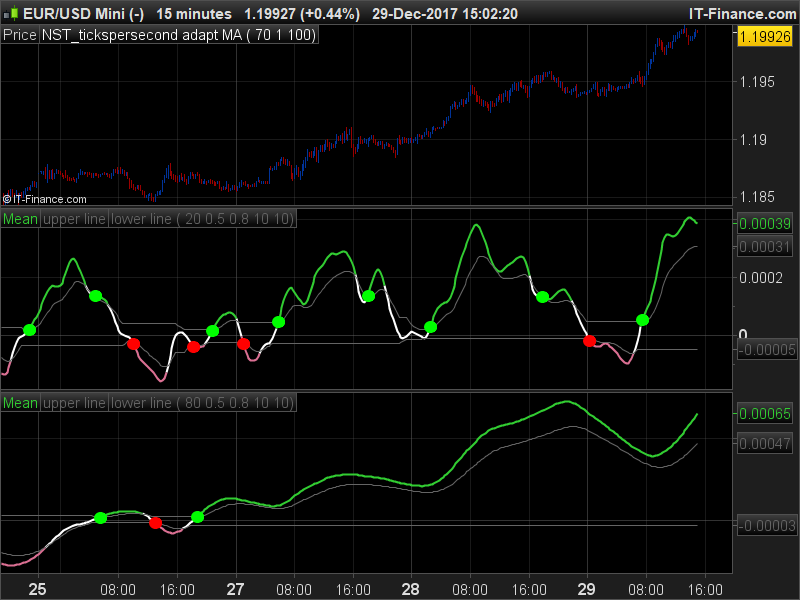
The Market Mode indicator seeks to identify trends and rebounds by identifying “phases” according to the principles of John Ehlers.

  • When the oscillator passes above the top line, the market is in an uptrend.
  • When the oscillator goes below the bottom line, the market is in a downtrend.
  • Between these two levels, the market is calmer and could rebound in the direction of the initial trend and / or phase of trend change.


Share this

Risk disclosure:

No information on this site is investment advice or a solicitation to buy or sell any financial instrument. Past performance is not indicative of future results. Trading may expose you to risk of loss greater than your deposits and is only suitable for experienced investors who have sufficient financial means to bear such risk.

ProRealTime ITF files and other attachments : How to import ITF files into ProRealTime platform?

PRC is also on YouTube, subscribe to our channel for exclusive content and tutorials

  1. Genotik • 12/29/2017 #

    Très intéressant, merci beaucoup !

  2. ALE • 12/29/2017 #

    Thanks Nicolas!

  3. primo1 • 12/29/2017 #

    merci beaucoup!!!!

  4. Yannick • 12/29/2017 #

    merci, interessant, une idée comment élaborer une stratégie d’après cet indicateur?

  5. Marcel • 12/29/2017 #

    Would be nice if the idicator can be adjusted for the 4 phases of Stan Weinstein.

    • Nicolas • 12/29/2017 #

      Sure, but it has absolutely nothing to deal with…

  6. macbartin • 12/29/2017 #

    merci, possible de l’utiliser seul pour le faire fonctionner en tant que stratégie ? de même est-ce possible de l’utiliser sur du 1Min en période 10 je doit changer le fractioner ?

    • Nicolas • 12/29/2017 #

      Oui.
      Pour changer la période, il faudra ajuster la variable MMperiod

    • macbartin • 12/29/2017 #

      plus la période est grande (en occurrence 20) plus l’indicateur est précis dans les changement de tendance? perso j’aime bien utiliser un sto 128 période avec une zone à 50 horizontal)

  7. Hasardeur • 12/29/2017 #

    Hallo Nicolas,
    in John Ehlers book “cycle analytics for Traders” from 2013, Mr. Ehlers describes the gamma for BanPass as follows:
    gamma= 1/COS(360*Delta/MMPeriod) (your line 18).
    I have added a while slope to the code in order to return a swami chart.
    The result of the while slope swami chart is different to the manual chosen periods.
    Do you have any idea what’s the reason could be?
    I assume, that the look back period of [1]-[2] has an infuence.
    Best regards
    Hasardeur

avatar
Register or

Likes

avatar avatar avatar avatar avatar avatar avatar avatar avatar avatar avatar avatar avatar avatar avatar avatar

+9 more likes

Related users ' posts
Bruno Carnazzi Il me semble que la fonction "floor" n'est disponible qu'avec PRT11, à vérifier
DELBERT Bonjour , merci pour votre réponse , je m'excuse je suis avec PRT v10.3 donc c'est indicateu...
Nicolas c'est juste, c'est une instruction très récente.
RubberToe Is there something we are missing here, I just get the same curved line as well...
Khaled @Nicolas, Hi Nicolas, I've downloaded the itf and it doesn't display as an Oscillator, it"s ...
sal157011 I think the problem here is that you must feed the trigonometric functions cos and sin with ...
ggolfet Hi Actarus, what's the name of the histogram indicator below Apple's chart?
Actaru5 Flag ShowState in setting and show histogram
NicolaSilvagni hi, thank you for creating this indicator. i can't figure out how to get the three graphs b...
Nicolas Check your custom trading hours and use the default market ones.
fj_pastor Hello Nicolas, Thanks again for all your support. Finally I debugged the problem. The sim...
kallistos Hi Nicolas, Thank you very much indeed for this indicator (and all the others you are provi...
Morrissey38 Muchísimas gracias Nicolás , muy amable.
Bruno Carnazzi extrèmement pertinent
Bruno Carnazzi Is that beatable ?
Sapo Thank you for your indicators. As always it's perfect, I thank you for your help it's preci...
supertiti Hello Jan You must use this code in correspondence with other indicators, a code alone do...
Franro Hi, this looks very good is this something you worked towards a strategy?
hua hin Bonjour comment mettre ce programme sur un graphique le lien est en JPG et sur crewation i...
eivaremir have u got the trading view version?
carlvan That's a great indicator and I especially the use of colors, more or less pronounced to indi...
diegofe_2000 CORDIAL SALUDO. CUANDO REALIZO UN PROGRAMA CON ESTE INDICADOR ME SALE EL SIGUIENTE LETRE...
ALE Hello do you want to explain to me in more detail what you have to do? Please replay here:...
skysoldier hello, thank you for this code, I was wondering if it is compatible with thinkorswim at all?
Nicolas No, but you can ask for private coding job at our programming services.
Nicolas Thanks again for all your valuable posts... and well formatted code! :)
Abdelkrim Maksour hi sir is this indicator for mt4 and how i can get one .
Nicolas Thanks a lot for this new valuable addition to our library. I changed line 76 with "barindex...
Horance Thanks. I've noticed this leftover after submission, but it was too late for editing. BTW, I...
Etienne Thanks Horance for porting this code to PRT. I would like to bring some speedup to your cod...
Horance This is a good question. John Ehlers explains it in Rocket Science for Traders. You have to ...
cbeukes Much appreciated, I will give that a try. Also, is there any criteria that one could use to ...
avatar
Anonymous Thanks for the code! I'm trying to understand how it works, and have a few questions... line...

Top