

Seasonality Analysis with In Sample and Out of Sample and Monthly Rating
This is a further development of my Seasonality Analysis Indicator that analyses historical data month by month to test for the seasonality of any market.
Apply only on Monthly charts.
In this version you can select a period to be tested as in sample and a period to be tested as out of sample. Comparison of the two allows more accurate analysis of the results.
You can set any number of years for each sample period but be aware that short data samples will not include much data. For example there are only five of each month in a five year sample.
You must set the current month before each test. 1 = Jan and 12 = Dec.
If you set fifteen years for the in sample and ten years for the out of sample then the analysis will start twenty five years back from today. The in sample will be tested on the first fifteen years and and the out of sample on the last ten.
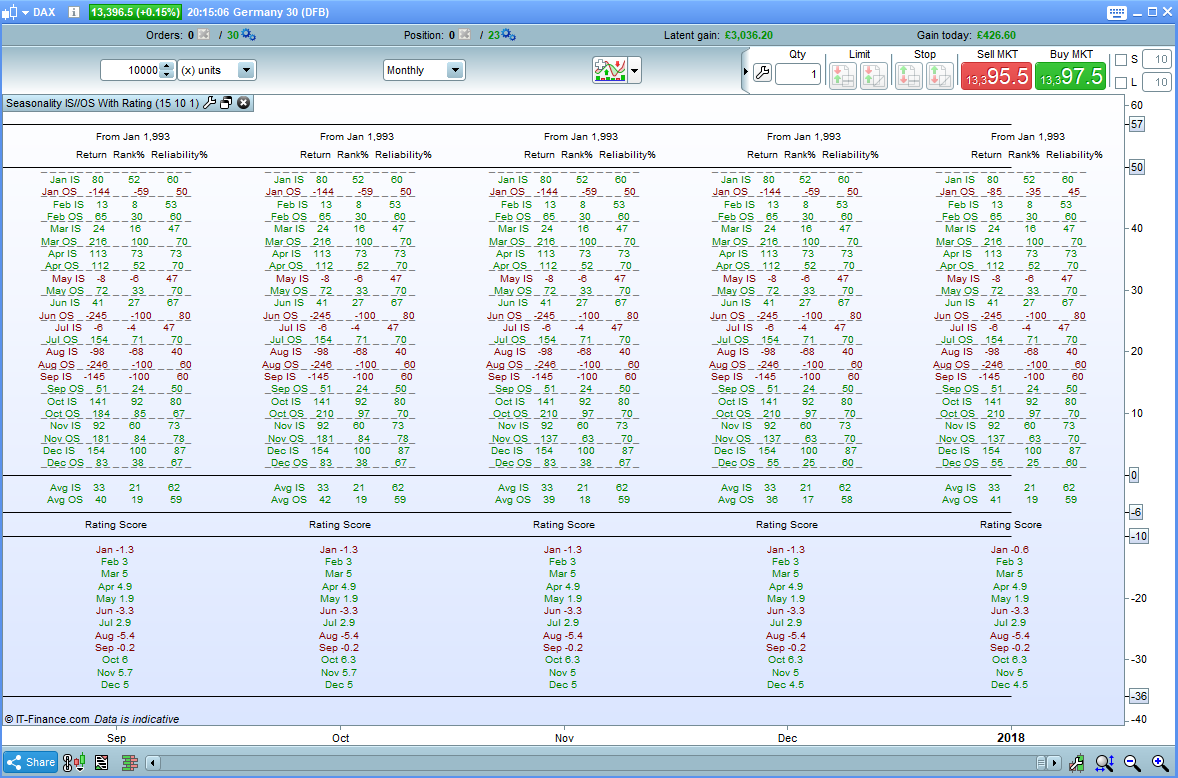
The results you are interested in are the last ones under the current months candle and I suggest making the indicator window full size to make it easier to read.
The result categories are as follows:
Return: The average pips return in that month over the period tested. If you had opened a long bet at the beginning of that month and closed it at the end of that month every year then this is how much you would have gained or lost on average each month.
Rank%: The best performing monthly average return and the worst performing monthly average return are ranked at 100% and -100%. All months in between are given a ranking% relative to these. This is useful if you want to alter position sizing in a strategy month by month based on seasonality. You might want to place position size of 100% of your maximum bet size in months rated at 100% and only 33% in months rated 33% for example.
Reliability%: The number of up months and number of down months are totalled up and a reliability percentage calculated. For example if you test over 10 years and have ten tests of January and January’s results favour long positions then if 7 of those months see a gain and 3 a loss then the reliability is 70%. You may wish to only go long in months with a Reliability% of over 70% for example. This reliability% helps you decide the probability of future results matching historical results.
Rating Score: The in sample and out of sample Rank% and Reliability% are combined and converted into this score. Twice as much weight is given to the more recent out of sample data. A very low score indicates a very good month to enter short trades and a very high score a very good month to enter long trades. The rating can also be used to decide on position size and preferred trade direction for trades month by month. This rating system is unproven and will obviously vary depending on the length of sample periods chosen – so use at your discretion.
If this indicator is used alongside my other two indicators Seasonality Analysis and Seasonality Analysis Graph then any trader should be easily be able to make good decisions on when is a good time to trade long or short and whether to increase or decrease position size month by month for any market where sufficient data is available.
I advise downloading and importing the .itf file to ensure that you get full functionality.
//Seasonality Analysis In Sample and Out of Sample with Rating
//Created by Vonasi

//In Sample calculations
StartMonthIn = ThisMonth
StartYearIn = CurrentYear - (InSampleYears + OutofSampleYears)
YearInEnd = CurrentYear - OutOfSampleYears

IF OpenYear >= StartYearIn and OpenYear < YearInEnd THEN
YearFlag = 1
ELSE
YearFlag = 0
ENDIF

IF OpenMonth = StartMonthIn and OPenYear = StartYearIn THEN
MonthFlag = 1
ENDIF

IF YearFlag = 1 and MonthFlag = 1 THEN
IF OpenMonth = 1 THEN
JanTotal = JanTotal + (close - open)
JanCount = JanCount + 1
IF close > open THEN
JanUp = JanUp + 1
ENDIF
ENDIF

IF OpenMonth = 2 THEN
FebTotal = FebTotal + (close - open)
FebCount = FebCount + 1
IF close > open THEN
FebUp = FebUp + 1
ENDIF
ENDIF

IF OpenMonth = 3 THEN
MarTotal = MarTotal + (close - open)
MarCount = MarCount + 1
IF close > open THEN
MarUp = MarUp + 1
ENDIF
ENDIF

IF OpenMonth = 4 THEN
AprTotal = AprTotal + (close - open)
AprCount = AprCount + 1
IF close > open THEN
AprUp = AprUp + 1
ENDIF
ENDIF

IF OpenMonth = 5 THEN
MayTotal = MayTotal + (close - open)
MayCount = MayCount + 1
IF close > open THEN
MayUp = MayUp + 1
ENDIF
ENDIF

IF OpenMonth = 6 THEN
JunTotal = JunTotal + (close - open)
JunCount = JunCount + 1
IF close > open THEN
JunUp = JunUp + 1
ENDIF
ENDIF

IF OpenMonth = 7 THEN
JulTotal = JulTotal + (close - open)
JulCount = JulCount + 1
IF close > open THEN
JulUp = JulUp + 1
ENDIF
ENDIF

IF OpenMonth = 8 THEN
AugTotal = AugTotal + (close - open)
AugCount = AugCount + 1
IF close > open THEN
AugUp = AugUp + 1
ENDIF
ENDIF

IF OpenMonth = 9 THEN
SepTotal = SepTotal + (close - open)
SepCount = SepCount + 1
IF close > open THEN
SepUp = SepUp + 1
ENDIF
ENDIF

IF OpenMonth = 10 THEN
OctTotal = OctTotal + (close - open)
OctCount = OctCount + 1
IF close > open THEN
OctUp = OctUp + 1
ENDIF
ENDIF

IF OpenMonth = 11 THEN
NovTotal = NovTotal + (close - open)
NovCount = NovCount + 1
IF close > open THEN
NovUp = NovUp + 1
ENDIF
ENDIF

IF OpenMonth = 12 THEN
DecTotal = DecTotal + (close - open)
DecCount = DecCount + 1
IF close > open THEN
DecUp = DecUp + 1
ENDIF
ENDIF
ENDIF

Jan = Round(JanTotal/JanCount)
Feb = Round(FebTotal/FebCount)
Mar = Round(MarTotal/MarCount)
Apr = Round(AprTotal/AprCount)
May = Round(MayTotal/MayCount)
Jun = Round(JunTotal/JunCount)
Jul = Round(JulTotal/JulCount)
Aug = Round(AugTotal/AugCount)
Sep = Round(SepTotal/SepCount)
Oct = Round(OctTotal/OctCount)
Nov = Round(NovTotal/NovCount)
Dec = Round(DecTotal/DecCount)

IF Jan > 0 THEN
JanR = 0
JanG = 128
JanRel = Round((JanUp/JanCount)*100)
JanRelScore = JanRel
ELSE
JanR = 128
JanG = 0
JanRel = Round(((JanCount - JanUp)/JanCount)*100)
JanRelScore = (0 - JanRel)
ENDIF

IF Feb > 0 THEN
FebR = 0
FebG = 128
FebRel = Round((FebUp/FebCount)*100)
FebRelScore = FebRel
ELSE
FebR = 128
FebG = 0
FebRel = Round(((FebCount - FebUp)/FebCount)*100)
FebRelScore = (0 - FebRel)
ENDIF

IF Mar > 0 THEN
MarR = 0
MarG = 128
MarRel = Round((MarUp/MarCount)*100)
MarRelScore = MarRel
ELSE
MarR = 128
MarG = 0
MarRel = Round(((MarCount - MarUp)/MarCount)*100)
MarRelScore = (0 - MarRel)
ENDIF

IF Apr > 0 THEN
AprR = 0
AprG = 128
AprRel = Round((AprUp/AprCount)*100)
AprRelScore = AprRel
ELSE
AprR = 128
AprG = 0
AprRel = Round(((AprCount - AprUp)/AprCount)*100)
AprRelScore = (0 - AprRel)
ENDIF

IF May > 0 THEN
MayR = 0
MayG = 128
MayRel = Round((MayUp/MayCount)*100)
MayRelScore = MayRel
ELSE
MayR = 128
MayG = 0
MayRel = Round(((MayCount - MayUp)/MayCount)*100)
MayRelScore = (0 - MayRel)
ENDIF

IF Jun > 0 THEN
JunR = 0
JunG = 128
JunRel = Round((JunUp/JunCount)*100)
JunRelScore = JunRel
ELSE
JunR = 128
JunG = 0
JunRel = Round(((JunCount - JunUp)/JunCount)*100)
JunRelScore = (0 - JunRel)
ENDIF

IF Jul > 0 THEN
JulR = 0
JulG = 128
JulRel = Round((JulUp/JulCount)*100)
JulRelScore = JulRel
ELSE
JulR = 128
JulG = 0
JulRel = Round(((JulCount - JulUp)/JulCount)*100)
JulRelScore = (0 - JulRel)
ENDIF

IF Aug > 0 THEN
AugR = 0
AugG = 128
AugRel = Round((AugUp/AugCount)*100)
AugRelScore = AugRel
ELSE
AugR = 128
AugG = 0
AugRel = Round(((AugCount - AugUp)/AugCount)*100)
AugRelScore = (0 - AugRel)
ENDIF

IF Sep > 0 THEN
SepR = 0
SepG = 128
SepRel = Round((SepUp/SepCount)*100)
SepRelScore = SepRel
ELSE
SepR = 128
SepG = 0
SepRel = Round(((SepCount - SepUp)/SepCount)*100)
SepRelScore = (0 - SepRel)
ENDIF

IF Oct > 0 THEN
OctR = 0
OctG = 128
OctRel = Round((OctUp/OctCount)*100)
OctRelScore = OctRel
ELSE
OctR = 128
OctG = 0
OctRel = Round(((OctCount - OctUp)/OctCount)*100)
OctRelScore = (0 - OctRel)
ENDIF

IF Nov > 0 THEN
NovR = 0
NovG = 128
NovRel = Round((NovUp/NovCount)*100)
NovRelScore = NovRel
ELSE
NovR = 128
NovG = 0
NovRel = Round(((NovCount - NovUp)/NovCount)*100)
NovRelScore = (0 - NovRel)
ENDIF

IF Dec > 0 THEN
DecR = 0
DecG = 128
DecRel = Round((DecUp/DecCount)*100)
DecRelScore = DecRel
ELSE
DecR = 128
DecG = 0
DecRel = Round(((DecCount - DecUp)/DecCount)*100)
DecRelScore = (0 - DecRel)
ENDIF

Avg = Round((Jan + Feb + Mar + Apr + May + Jun + Jul + Aug + Sep + Oct + Nov + Dec)/12)
AvgCount = (JanCount + FebCount + MarCount + AprCount + MayCount + JunCount + JulCount + AugCount + SepCount + OctCount + NovCount + DecCount)
AvgUp = (JanUp + FebUp + MarUp + AprUp + MayUp + JunUp + JulUp + AugUp + SepUp + OctUp + NovUp + DecUp)

IF Avg > 0 THEN
AvgR = 0
AvgG = 128
AvgRel = Round((AvgUp/AvgCount)*100)
ELSE
AvgR = 128
AvgG = 0
AvgRel = Round(((AvgCount - AvgUp)/AvgCount)*100)
ENDIF

Bottom = Min(Dec,Min(Nov,Min(Oct,Min(Sep,Min(Aug,Min(Jul,Min(Jun,Min(May,Min(Apr,Min(Mar,MIN(Feb,Jan)))))))))))
Top = Max(Dec,Max(Nov,Max(Oct,Max(Sep,Max(Aug,Max(Jul,Max(Jun,Max(May,Max(Apr,Max(Mar,Max(Feb,Jan)))))))))))

IF Jan > 0 THEN
JanPerc = Round((Jan/Top)*100)
ELSE
JanPerc = 0 - Round((ABS(Jan)/ABS(Bottom))*100)
ENDIF

IF Feb > 0 THEN
FebPerc = Round((Feb/Top)*100)
ELSE
FebPerc = 0 - Round((ABS(Feb)/ABS(Bottom))*100)
ENDIF

IF Mar > 0 THEN
MarPerc = Round((Mar/Top)*100)
ELSE
MarPerc = 0 - Round((ABS(Mar)/ABS(Bottom))*100)
ENDIF

IF Apr > 0 THEN
AprPerc = Round((Apr/Top)*100)
ELSE
AprPerc = 0 - Round((ABS(Apr)/ABS(Bottom))*100)
ENDIF

IF May > 0 THEN
MayPerc = Round((May/Top)*100)
ELSE
MayPerc = 0 - Round((ABS(May)/ABS(Bottom))*100)
ENDIF

IF Jun > 0 THEN
JunPerc = Round((Jun/Top)*100)
ELSE
JunPerc = 0 - Round((ABS(Jun)/ABS(Bottom))*100)
ENDIF

IF Jul > 0 THEN
JulPerc = Round((Jul/Top)*100)
ELSE
JulPerc = 0 - Round((ABS(Jul)/ABS(Bottom))*100)
ENDIF

IF Aug > 0 THEN
AugPerc = Round((Aug/Top)*100)
ELSE
AugPerc = 0 - Round((ABS(Aug)/ABS(Bottom))*100)
ENDIF

IF Sep > 0 THEN
SepPerc = Round((Sep/Top)*100)
ELSE
SepPerc = 0 - Round((ABS(Sep)/ABS(Bottom))*100)
ENDIF

IF Oct > 0 THEN
OctPerc = Round((Oct/Top)*100)
ELSE
OctPerc = 0 - Round((ABS(Oct)/ABS(Bottom))*100)
ENDIF

IF Nov > 0 THEN
NovPerc = Round((Nov/Top)*100)
ELSE
NovPerc = 0 - Round((ABS(Nov)/ABS(Bottom))*100)
ENDIF

IF Dec > 0 THEN
DecPerc = Round((Dec/Top)*100)
ELSE
DecPerc = 0 - Round((ABS(Dec)/ABS(Bottom))*100)
ENDIF

IF Avg > 0 THEN
AvgPerc = Round((Avg/Top)*100)
ELSE
AvgPerc = 0 - Round((ABS(Avg)/ABS(Bottom))*100)
ENDIF

//Out of Sample Calculations
StartMonthOut = ThisMonth
StartYearOut = CurrentYear - OutOfSampleYears

IF OpenYear = StartYearOut and OpenMonth = StartMonthOut THEN
OutFlag = 1
ENDIF

IF OutFlag = 1 THEN
IF OpenMonth = 1 THEN
JanOutTotal = JanOutTotal + (close - open)
JanOutCount = JanOutCount + 1
IF close > open THEN
JanOutUp = JanOutUp + 1
ENDIF
ENDIF

IF OpenMonth = 2 THEN
FebOutTotal = FebOutTotal + (close - open)
FebOutCount = FebOutCount + 1
IF close > open THEN
FebOutUp = FebOutUp + 1
ENDIF
ENDIF

IF OpenMonth = 3 THEN
MarOutTotal = MarOutTotal + (close - open)
MarOutCount = MarOutCount + 1
IF close > open THEN
MarOutUp = MarOutUp + 1
ENDIF
ENDIF

IF OpenMonth = 4 THEN
AprOutTotal = AprOutTotal + (close - open)
AprOutCount = AprOutCount + 1
IF close > open THEN
AprOutUp = AprOutUp + 1
ENDIF
ENDIF

IF OpenMonth = 5 THEN
MayOutTotal = MayOutTotal + (close - open)
MayOutCount = MayOutCount + 1
IF close > open THEN
MayOutUp = MayOutUp + 1
ENDIF
ENDIF

IF OpenMonth = 6 THEN
JunOutTotal = JunOutTotal + (close - open)
JunOutCount = JunOutCount + 1
IF close > open THEN
JunOutUp = JunOutUp + 1
ENDIF
ENDIF

IF OpenMonth = 7 THEN
JulOutTotal = JulOutTotal + (close - open)
JulOutCount = JulOutCount + 1
IF close > open THEN
JulOutUp = JulOutUp + 1
ENDIF
ENDIF

IF OpenMonth = 8 THEN
AugOutTotal = AugOutTotal + (close - open)
AugOutCount = AugOutCount + 1
IF close > open THEN
AugOutUp = AugOutUp + 1
ENDIF
ENDIF

IF OpenMonth = 9 THEN
SepOutTotal = SepOutTotal + (close - open)
SepOutCount = SepOutCount + 1
IF close > open THEN
SepOutUp = SepOutUp + 1
ENDIF
ENDIF

IF OpenMonth = 10 THEN
OctOutTotal = OctOutTotal + (close - open)
OctOutCount = OctOutCount + 1
IF close > open THEN
OctOutUp = OctOutUp + 1
ENDIF
ENDIF

IF OpenMonth = 11 THEN
NovOutTotal = NovOutTotal + (close - open)
NovOutCount = NovOutCount + 1
IF close > open THEN
NovOutUp = NovOutUp + 1
ENDIF
ENDIF

IF OpenMonth = 12 THEN
DecOutTotal = DecOutTotal + (close - open)
DecOutCount = DecOutCount + 1
IF close > open THEN
DecOutUp = DecOutUp + 1
ENDIF
ENDIF
ENDIF

JanOut = Round(JanOutTotal/JanOutCount)
FebOut = Round(FebOutTotal/FebOutCount)
MarOut = Round(MarOutTotal/MarOutCount)
AprOut = Round(AprOutTotal/AprOutCount)
MayOut = Round(MayOutTotal/MayOutCount)
JunOut = Round(JunOutTotal/JunOutCount)
JulOut = Round(JulOutTotal/JulOutCount)
AugOut = Round(AugOutTotal/AugOutCount)
SepOut = Round(SepOutTotal/SepOutCount)
OctOut = Round(OctOutTotal/OctOutCount)
NovOut = Round(NovOutTotal/NovOutCount)
DecOut = Round(DecOutTotal/DecOutCount)

IF JanOut > 0 THEN
JanOutR = 0
JanOutG = 128
JanOutRel = Round((JanOutUp/JanOutCount)*100)
JanOutRelScore = JanOutRel
ELSE
JanOutR = 128
JanOutG = 0
JanOutRel = Round(((JanOutCount - JanOutUp)/JanOutCount)*100)
JanOutRelScore = (0 - JanOutRel)
ENDIF

IF FebOut > 0 THEN
FebOutR = 0
FebOutG = 128
FebOutRel = Round((FebOutUp/FebOutCount)*100)
FebOutRelScore = FebOutRel
ELSE
FebOutR = 128
FebOutG = 0
FebOutRel = Round(((FebOutCount - FebOutUp)/FebOutCount)*100)
FebOutRelScore = (0 - FebOutRel)
ENDIF

IF MarOut > 0 THEN
MarOutR = 0
MarOutG = 128
MarOutRel = Round((MarOutUp/MarOutCount)*100)
MarOutRelScore = MarOutRel
ELSE
MarOutR = 128
MarOutG = 0
MarOutRel = Round(((MarOutCount - MarOutUp)/MarOutCount)*100)
MarOutRelScore = (0 - MarOutRel)
ENDIF

IF AprOut > 0 THEN
AprOutR = 0
AprOutG = 128
AprOutRel = Round((AprOutUp/AprOutCount)*100)
AprOutRelScore = AprOutRel
ELSE
AprOutR = 128
AprOutG = 0
AprOutRel = Round(((AprOutCount - AprOutUp)/AprOutCount)*100)
AprOutRelScore = (0 - AprOutRel)
ENDIF

IF MayOut > 0 THEN
MayOutR = 0
MayOutG = 128
MayOutRel = Round((MayOutUp/MayOutCount)*100)
MayOutRelScore = MayOutRel
ELSE
MayOutR = 128
MayOutG = 0
MayOutRel = Round(((MayOutCount - MayOutUp)/MayOutCount)*100)
MayOutRelScore = (0 - MayOutRel)
ENDIF

IF JunOut > 0 THEN
JunOutR = 0
JunOutG = 128
JunOutRel = Round((JunOutUp/JunOutCount)*100)
JunOutRelScore = JunOutRel
ELSE
JunOutR = 128
JunOutG = 0
JunOutRel = Round(((JunOutCount - JunOutUp)/JunOutCount)*100)
JunOutRelScore = (0 - JunOutRel)
ENDIF

IF JulOut > 0 THEN
JulOutR = 0
JulOutG = 128
JulOutRel = Round((JulOutUp/JulOutCount)*100)
JulOutRelScore = JulOutRel
ELSE
JulOutR = 128
JulOutG = 0
JulOutRel = Round(((JulOutCount - JulOutUp)/JulOutCount)*100)
JulOutRelScore = (0 - JulOutRel)
ENDIF

IF AugOut > 0 THEN
AugOutR = 0
AugOutG = 128
AugOutRel = Round((AugOutUp/AugOutCount)*100)
AugOutRelScore = AugOutRel
ELSE
AugOutR = 128
AugOutG = 0
AugOutRel = Round(((AugOutCount - AugOutUp)/AugOutCount)*100)
AugOutRelScore = (0 - AugOutRel)
ENDIF

IF SepOut > 0 THEN
SepOutR = 0
SepOutG = 128
SepOutRel = Round((SepOutUp/SepOutCount)*100)
SepOutRelScore = SepOutRel
ELSE
SepOutR = 128
SepOutG = 0
SepOutRel = Round(((SepOutCount - SepOutUp)/SepOutCount)*100)
SepOutRelScore = (0 - SepOutRel)
ENDIF

IF OctOut > 0 THEN
OctOutR = 0
OctOutG = 128
OctOutRel = Round((OctOutUp/OctOutCount)*100)
OctOutRelScore = OctOutRel
ELSE
OctOutR = 128
OctOutG = 0
OctOutRel = Round(((OctOutCount - OctOutUp)/OctOutCount)*100)
OctOutRelScore = (0 - OctOutRel)
ENDIF

IF NovOut > 0 THEN
NovOutR = 0
NovOutG = 128
NovOutRel = Round((NovOutUp/NovOutCount)*100)
NovOutRelScore = NovOutRel
ELSE
NovOutR = 128
NovOutG = 0
NovOutRel = Round(((NovOutCount - NovOutUp)/NovOutCount)*100)
NovOutRelScore = (0 - NovOutRel)
ENDIF

IF DecOut > 0 THEN
DecOutR = 0
DecOutG = 128
DecOutRel = Round((DecOutUp/DecOutCount)*100)
DecOutRelScore = DecOutRel
ELSE
DecOutR = 128
DecOutG = 0
DecOutRel = Round(((DecOutCount - DecOutUp)/DecOutCount)*100)
DecOutRelScore = (0 - DecOutRel)
ENDIF

AvgOut = Round((JanOut + FebOut + MarOut + AprOut + MayOut + JunOut + JulOut + AugOut + SepOut + OctOut + NovOut + DecOut)/12)
AvgOutCount = (JanOutCount + FebOutCount + MarOutCount + AprOutCount + MayOutCount + JunOutCount + JulOutCount + AugOutCount + SepOutCount + OctOutCount + NovOutCount + DecOutCount)
AvgOutUp = (JanOutUp + FebOutUp + MarOutUp + AprOutUp + MayOutUp + JunOutUp + JulOutUp + AugOutUp + SepOutUp + OctOutUp + NovOutUp + DecOutUp)

IF AvgOut > 0 THEN
AvgOutR = 0
AvgOutG = 128
AvgOutRel = Round((AvgOutUp/AvgOutCount)*100)
ELSE
AvgOutR = 128
AvgOutG = 0
AvgOutRel = Round(((AvgOutCount - AvgOutUp)/AvgOutCount)*100)
ENDIF


BottomOut = Min(DecOut,Min(NovOut,Min(OctOut,Min(SepOut,Min(AugOut,Min(JulOut,Min(JunOut,Min(MayOut,Min(AprOut,Min(MarOut,MIN(FebOut,JanOut)))))))))))
TopOut = Max(DecOut,Max(NovOut,Max(OctOut,Max(SepOut,Max(AugOut,Max(JulOut,Max(JunOut,Max(MayOut,Max(AprOut,Max(MarOut,Max(FebOut,JanOut)))))))))))

IF JanOut > 0 THEN
JanOutPerc = Round((JanOut/TopOut)*100)
ELSE
JanOutPerc = 0 - Round((ABS(JanOut)/ABS(BottomOut))*100)
ENDIF

IF FebOut > 0 THEN
FebOutPerc = Round((FebOut/TopOut)*100)
ELSE
FebOutPerc = 0 - Round((ABS(FebOut)/ABS(BottomOut))*100)
ENDIF

IF MarOut > 0 THEN
MarOutPerc = Round((MarOut/TopOut)*100)
ELSE
MarOutPerc = 0 - Round((ABS(MarOut)/ABS(BottomOut))*100)
ENDIF

IF AprOut > 0 THEN
AprOutPerc = Round((AprOut/TopOut)*100)
ELSE
AprOutPerc = 0 - Round((ABS(AprOut)/ABS(BottomOut))*100)
ENDIF

IF MayOut > 0 THEN
MayOutPerc = Round((MayOut/TopOut)*100)
ELSE
MayOutPerc = 0 - Round((ABS(MayOut)/ABS(BottomOut))*100)
ENDIF

IF JunOut > 0 THEN
JunOutPerc = Round((JunOut/TopOut)*100)
ELSE
JunOutPerc = 0 - Round((ABS(JunOut)/ABS(BottomOut))*100)
ENDIF

IF JulOut > 0 THEN
JulOutPerc = Round((JulOut/TopOut)*100)
ELSE
JulOutPerc = 0 - Round((ABS(JulOut)/ABS(BottomOut))*100)
ENDIF

IF AugOut > 0 THEN
AugOutPerc = Round((AugOut/TopOut)*100)
ELSE
AugOutPerc = 0 - Round((ABS(AugOut)/ABS(BottomOut))*100)
ENDIF

IF SepOut > 0 THEN
SepOutPerc = Round((SepOut/TopOut)*100)
ELSE
SepOutPerc = 0 - Round((ABS(SepOut)/ABS(BottomOut))*100)
ENDIF

IF OctOut > 0 THEN
OctOutPerc = Round((OctOut/TopOut)*100)
ELSE
OctOutPerc = 0 - Round((ABS(OctOut)/ABS(BottomOut))*100)
ENDIF

IF NovOut > 0 THEN
NovOutPerc = Round((NovOut/TopOut)*100)
ELSE
NovOutPerc = 0 - Round((ABS(NovOut)/ABS(BottomOut))*100)
ENDIF

IF DecOut > 0 THEN
DecOutPerc = Round((DecOut/TopOut)*100)
ELSE
DecOutPerc = 0 - Round((ABS(DecOut)/ABS(BottomOut))*100)
ENDIF

IF AvgOut > 0 THEN
AvgOutPerc = Round((AvgOut/TopOut)*100)
ELSE
AvgOutPerc = 0 - Round((ABS(AvgOut)/ABS(BottomOut))*100)
ENDIF

//Rating Calculations
JanScore = Round((((((JanPerc/2) + JanOutPerc)/2) + (((JanRelScore/2) + JanOutRelScore)/2))/20)*10)/10
FebScore = Round((((((FebPerc/2) + FebOutPerc)/2) + (((FebRelScore/2) + FebOutRelScore)/2))/20)*10)/10
MarScore = Round((((((MarPerc/2) + MarOutPerc)/2) + (((MarRelScore/2) + MarOutRelScore)/2))/20)*10)/10
AprScore = Round((((((AprPerc/2) + AprOutPerc)/2) + (((AprRelScore/2) + AprOutRelScore)/2))/20)*10)/10
MayScore = Round((((((MayPerc/2) + MayOutPerc)/2) + (((MayRelScore/2) + MayOutRelScore)/2))/20)*10)/10
JunScore = Round((((((JunPerc/2) + JunOutPerc)/2) + (((JunRelScore/2) + JunOutRelScore)/2))/20)*10)/10
JulScore = Round((((((JulPerc/2) + JulOutPerc)/2) + (((JulRelScore/2) + JulOutRelScore)/2))/20)*10)/10
AugScore = Round((((((AugPerc/2) + AugOutPerc)/2) + (((AugRelScore/2) + AugOutRelScore)/2))/20)*10)/10
SepScore = Round((((((SepPerc/2) + SepOutPerc)/2) + (((SepRelScore/2) + SepOutRelScore)/2))/20)*10)/10
OctScore = Round((((((OctPerc/2) + OctOutPerc)/2) + (((OctRelScore/2) + OctOutRelScore)/2))/20)*10)/10
NovScore = Round((((((NovPerc/2) + NovOutPerc)/2) + (((NovRelScore/2) + NovOutRelScore)/2))/20)*10)/10
DecScore = Round((((((DecPerc/2) + DecOutPerc)/2) + (((DecRelScore/2) + DecOutRelScore)/2))/20)*10)/10

IF JanScore > 0 THEN
JanScoreR = 0
JanScoreG = 128
ELSE
JanScoreR = 128
JanScoreG = 0
ENDIF

IF FebScore > 0 THEN
FebScoreR = 0
FebScoreG = 128
ELSE
FebScoreR = 128
FebScoreG = 0
ENDIF

IF MarScore > 0 THEN
MarScoreR = 0
MarScoreG = 128
ELSE
MarScoreR = 128
MarScoreG = 0
ENDIF

IF AprScore > 0 THEN
AprScoreR = 0
AprScoreG = 128
ELSE
AprScoreR = 128
AprScoreG = 0
ENDIF

IF MayScore > 0 THEN
MayScoreR = 0
MayScoreG = 128
ELSE
MayScoreR = 128
MayScoreG = 0
ENDIF

IF JunScore > 0 THEN
JunScoreR = 0
JunScoreG = 128
ELSE
JunScoreR = 128
JunScoreG = 0
ENDIF

IF JulScore > 0 THEN
JulScoreR = 0
JulScoreG = 128
ELSE
JulScoreR = 128
JulScoreG = 0
ENDIF

IF AugScore > 0 THEN
AugScoreR = 0
AugScoreG = 128
ELSE
AugScoreR = 128
AugScoreG = 0
ENDIF

IF SepScore > 0 THEN
SepScoreR = 0
SepScoreG = 128
ELSE
SepScoreR = 128
SepScoreG = 0
ENDIF

IF OctScore > 0 THEN
OctScoreR = 0
OctScoreG = 128
ELSE
OctScoreR = 128
OctScoreG = 0
ENDIF

IF NovScore > 0 THEN
NovScoreR = 0
NovScoreG = 128
ELSE
NovScoreR = 128
NovScoreG = 0
ENDIF

IF DecScore > 0 THEN
DecScoreR = 0
DecScoreG = 128
ELSE
DecScoreR = 128
DecScoreG = 0
ENDIF

//Text
IF StartMonthIn = 1 THEN
DrawText("            From Jan #StartYearIn#",barindex,55,SansSerif,Standard,10)coloured(0,0,0)
ENDIF

IF StartMonthIn = 2 THEN
DrawText("            From Feb #StartYearIn#" ,barindex,15.5,SansSerif,Standard,10)coloured(0,0,0)
ENDIF

IF StartMonthIn = 3 THEN
DrawText("            From Mar #StartYearIn#",barindex,55,SansSerif,Standard,10)coloured(0,0,0)
ENDIF

IF StartMonthIn = 4 THEN
DrawText("            From Apr #StartYearIn#",barindex,55,SansSerif,Standard,10)coloured(0,0,0)
ENDIF

IF StartMonthIn = 5 THEN
DrawText("            From May #StartYearIn#",barindex,55,SansSerif,Standard,10)coloured(0,0,0)
ENDIF

IF StartMonthIn = 6 THEN
DrawText("            From Jun #StartYearIn#",barindex,55,SansSerif,Standard,10)coloured(0,0,0)
ENDIF

IF StartMonthIn = 7 THEN
DrawText("            From Jul #StartYearIn#",barindex,55,SansSerif,Standard,10)coloured(0,0,0)
ENDIF

IF StartMonthIn = 8 THEN
DrawText("           From Aug #StartYearIn#",barindex,55,SansSerif,Standard,10)coloured(0,0,0)
ENDIF

IF StartMonthIn = 9 THEN
DrawText("            From Sep #StartYearIn#",barindex,55,SansSerif,Standard,10)coloured(0,0,0)
ENDIF

IF StartMonthIn = 10 THEN
DrawText("            From Oct #StartYearIn#",barindex,55,SansSerif,Standard,10)coloured(0,0,0)
ENDIF

IF StartMonthIn = 11 THEN
DrawText("            From Nov #StartYearIn#",barindex,55,SansSerif,Standard,10)coloured(0,0,0)
ENDIF

IF StartMonthIn = 12 THEN
DrawText("            From Dec #StartYearIn#",barindex,55,SansSerif,Standard,10)coloured(0,0,0)
ENDIF

DrawText("                 Return  Rank%  Reliability%",barindex,52,SansSerif,Standard,10)coloured(0,0,0)

DrawText("Jan IS    #Jan#       #JanPerc#        #JanRel#",barindex,48,SansSerif,Standard,10)coloured(JanR,JanG,0)
DrawText("Feb IS    #Feb#       #FebPerc#        #FebRel#",barindex,44,SansSerif,Standard,10)coloured(FebR,FebG,0)
DrawText("Mar IS    #Mar#       #MarPerc#        #MarRel#",barindex,40,SansSerif,Standard,10)coloured(MarR,MarG,0)
DrawText("Apr IS    #Apr#       #AprPerc#        #AprRel#",barindex,36,SansSerif,Standard,10)coloured(AprR,AprG,0)
DrawText("May IS    #May#       #MayPerc#        #MayRel#",barindex,32,SansSerif,Standard,10)coloured(MayR,MayG,0)
DrawText("Jun IS    #Jun#       #JunPerc#        #JunRel#",barindex,28,SansSerif,Standard,10)coloured(JunR,JunG,0)
DrawText("Jul IS    #Jul#       #JulPerc#        #JulRel#",barindex,24,SansSerif,Standard,10)coloured(JulR,JulG,0)
DrawText("Aug IS    #Aug#       #AugPerc#        #AugRel#",barindex,20,SansSerif,Standard,10)coloured(AugR,AugG,0)
DrawText("Sep IS    #Sep#       #SepPerc#        #SepRel#",barindex,16,SansSerif,Standard,10)coloured(SepR,SepG,0)
DrawText("Oct IS    #Oct#       #OctPerc#        #OctRel#",barindex,12,SansSerif,Standard,10)coloured(OctR,OctG,0)
DrawText("Nov IS    #Nov#       #NovPerc#        #NovRel#",barindex,8,SansSerif,Standard,10)coloured(NovR,NovG,0)
DrawText("Dec IS    #Dec#       #DecPerc#        #DecRel#",barindex,4,SansSerif,Standard,10)coloured(DecR,DecG,0)
DrawText("Avg IS    #Avg#       #AvgPerc#        #AvgRel#",barindex,-2,SansSerif,Standard,10)coloured(AvgR,AvgG,0)

DrawText("_ _ _ _ _ _ _ _ _ _ _ _ _ _ _ _ _",barindex,50,SansSerif,Standard,10)coloured(128,128,128)
DrawText("Jan OS    #JanOut#       #JanOutPerc#        #JanOutRel#",barindex,46,SansSerif,Standard,10)coloured(JanOutR,JanOutG,0)
DrawText("_ _ _ _ _ _ _ _ _ _ _ _ _ _ _ _ _",barindex,46,SansSerif,Standard,10)coloured(128,128,128)
DrawText("Feb OS    #FebOut#       #FebOutPerc#        #FebOutRel#",barindex,42,SansSerif,Standard,10)coloured(FebOutR,FebOutG,0)
DrawText("_ _ _ _ _ _ _ _ _ _ _ _ _ _ _ _ _",barindex,42,SansSerif,Standard,10)coloured(128,128,128)
DrawText("Mar OS    #MarOut#       #MarOutPerc#        #MarOutRel#",barindex,38,SansSerif,Standard,10)coloured(MarOutR,MarOutG,0)
DrawText("_ _ _ _ _ _ _ _ _ _ _ _ _ _ _ _ _",barindex,38,SansSerif,Standard,10)coloured(128,128,128)
DrawText("Apr OS    #AprOut#       #AprOutPerc#        #AprOutRel#",barindex,34,SansSerif,Standard,10)coloured(AprOutR,AprOutG,0)
DrawText("_ _ _ _ _ _ _ _ _ _ _ _ _ _ _ _ _",barindex,34,SansSerif,Standard,10)coloured(128,128,128)
DrawText("May OS    #MayOut#       #MayOutPerc#        #MayOutRel#",barindex,30,SansSerif,Standard,10)coloured(MayOutR,MayOutG,0)
DrawText("_ _ _ _ _ _ _ _ _ _ _ _ _ _ _ _ _",barindex,30,SansSerif,Standard,10)coloured(128,128,128)
DrawText("Jun OS    #JunOut#       #JunOutPerc#        #JunOutRel#",barindex,26,SansSerif,Standard,10)coloured(JunOutR,JunOutG,0)
DrawText("_ _ _ _ _ _ _ _ _ _ _ _ _ _ _ _ _",barindex,26,SansSerif,Standard,10)coloured(128,128,128)
DrawText("Jul OS    #JulOut#       #JulOutPerc#        #JulOutRel#",barindex,22,SansSerif,Standard,10)coloured(JulOutR,JulOutG,0)
DrawText("_ _ _ _ _ _ _ _ _ _ _ _ _ _ _ _ _",barindex,22,SansSerif,Standard,10)coloured(128,128,128)
DrawText("Aug OS    #AugOut#       #AugOutPerc#        #AugOutRel#",barindex,18,SansSerif,Standard,10)coloured(AugOutR,AugOutG,0)
DrawText("_ _ _ _ _ _ _ _ _ _ _ _ _ _ _ _ _",barindex,18,SansSerif,Standard,10)coloured(128,128,128)
DrawText("Sep OS    #SepOut#       #SepOutPerc#        #SepOutRel#",barindex,14,SansSerif,Standard,10)coloured(SepOutR,SepOutG,0)
DrawText("_ _ _ _ _ _ _ _ _ _ _ _ _ _ _ _ _",barindex,14,SansSerif,Standard,10)coloured(128,128,128)
DrawText("Oct OS    #OctOut#       #OctOutPerc#        #OctOutRel#",barindex,10,SansSerif,Standard,10)coloured(OctOutR,OctOutG,0)
DrawText("_ _ _ _ _ _ _ _ _ _ _ _ _ _ _ _ _",barindex,10,SansSerif,Standard,10)coloured(128,128,128)
DrawText("Nov OS    #NovOut#       #NovOutPerc#        #NovOutRel#",barindex,6,SansSerif,Standard,10)coloured(NovOutR,NovOutG,0)
DrawText("_ _ _ _ _ _ _ _ _ _ _ _ _ _ _ _ _",barindex,6,SansSerif,Standard,10)coloured(128,128,128)
DrawText("Dec OS    #DecOut#       #DecOutPerc#        #DecOutRel#",barindex,2,SansSerif,Standard,10)coloured(DecOutR,DecOutG,0)
DrawText("_ _ _ _ _ _ _ _ _ _ _ _ _ _ _ _ _",barindex,2,SansSerif,Standard,10)coloured(128,128,128)
DrawText("Avg OS    #AvgOut#       #AvgOutPerc#        #AvgOutRel#",barindex,-4,SansSerif,Standard,10)coloured(AvgOutR,AvgOutG,0)

DrawText("Rating Score",barindex,-8,SansSerif,Standard,10)coloured(0,0,0)

DrawText("Jan #JanScore#",barindex,-12,SansSerif,Standard,10)coloured(JanScoreR,JanScoreG,0)
DrawText("Feb #FebScore#",barindex,-14,SansSerif,Standard,10)coloured(FebScoreR,FebScoreG,0)
DrawText("Mar #MarScore#",barindex,-16,SansSerif,Standard,10)coloured(MarScoreR,MarScoreG,0)
DrawText("Apr #AprScore#",barindex,-18,SansSerif,Standard,10)coloured(AprScoreR,AprScoreG,0)
DrawText("May #MayScore#",barindex,-20,SansSerif,Standard,10)coloured(MayScoreR,MayScoreG,0)
DrawText("Jun #JunScore#",barindex,-22,SansSerif,Standard,10)coloured(JunScoreR,JunScoreG,0)
DrawText("Jul #JulScore#",barindex,-24,SansSerif,Standard,10)coloured(JulScoreR,JulScoreG,0)
DrawText("Aug #AugScore#",barindex,-26,SansSerif,Standard,10)coloured(AugScoreR,AugScoreG,0)
DrawText("Sep #SepScore#",barindex,-28,SansSerif,Standard,10)coloured(SepScoreR,SepScoreG,0)
DrawText("Oct #OctScore#",barindex,-30,SansSerif,Standard,10)coloured(OctScoreR,OctScoreG,0)
DrawText("Nov #NovScore#",barindex,-32,SansSerif,Standard,10)coloured(NovScoreR,NovScoreG,0)
DrawText("Dec #DecScore#",barindex,-34,SansSerif,Standard,10)coloured(DecScoreR,DecScoreG,0)

Hi = 57
Mid = 50
Mid2 = 0
Lo = -6
Lo1 = -10
Lo2 = -36

Return Hi as "Line1", Mid as "Line2", Mid2 as "Line3", Lo as "Line4", Lo1 as "Line5", Lo2 as "Line6"