Here is a “trading strategy” that will find its place in the series of scenarios …
Its design is the result of daily observation over several years transposed in this indicator.
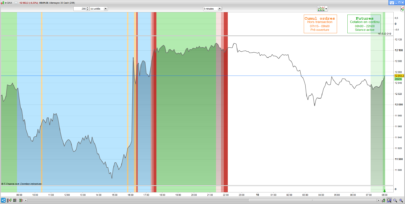
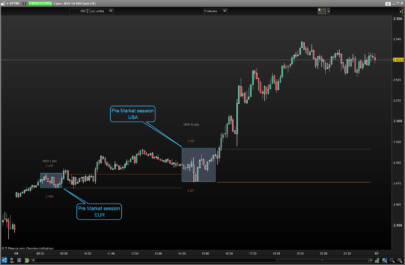
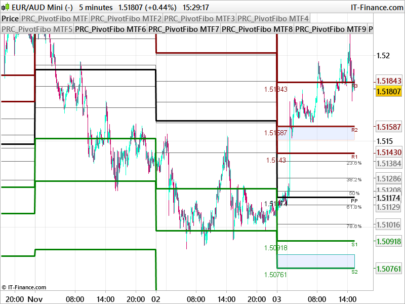
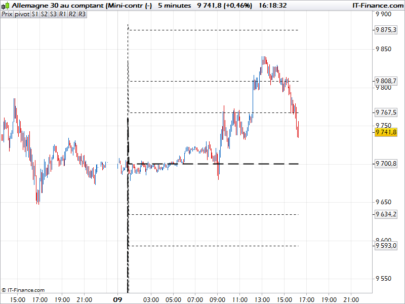
The program generates from the Pre Market data a predictive view of course development by tracing its evolution by the projection of Fibonacci levels!
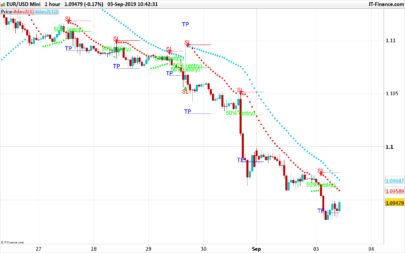
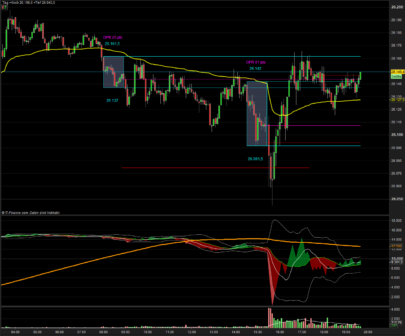
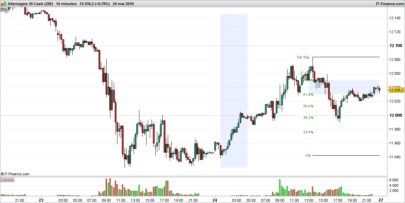
Initially developed on the index market, this indicator can also be used for currencies or equities by giving similar results.
It allows the development of trading plan by creating a resilient environment on the short-term observation of market movements.
His main interest lies in the way to apprehend a position statement by projecting a layer reflecting the possible evolution of the levels likely to be reached during the active session.
Because the prices have a memory, the market resilience remains an effective decision-making tool by making the short-term trading more serene in part thanks to a clarified vision of the
market, its use is perfect for “Day Trading or Scalping”
All you have to do is define a simple method based on “Pullback, Consolidation, Retracement, Open Range, Level Break, Trend Follow” …
Some will find a practical decision-making tool others a gadget worthy of the era of “shadocks”! It’s for you to see …
Hopefully these few lines of code will benefit you in your trading by being aware that the market is “almost” always right.
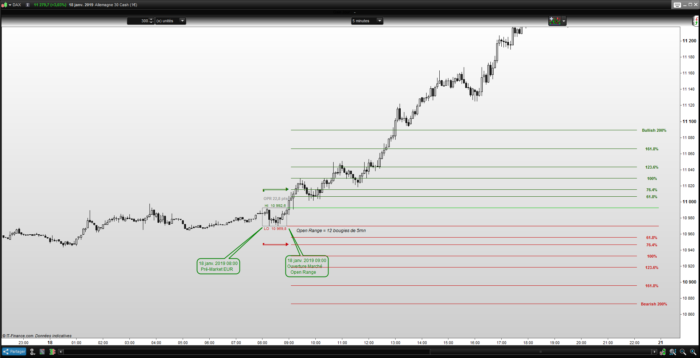
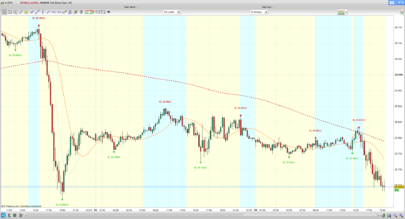
- Start of the program on the candle from 08:00 (pre market between 08:00 and 08:59)
- Detection of the level up and down until the closing of the candle of 08h55 “Open Range”
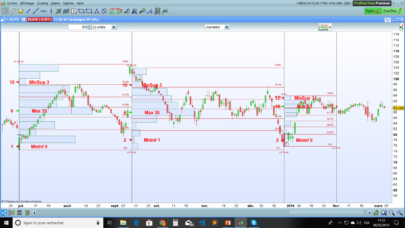
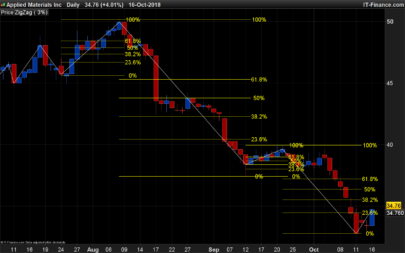
- Calculation of the Fibonacci levels taking as a benchmark the mini point for 0% and the maximum point for 38.2% in the uptrend and its inverse for the downtrend
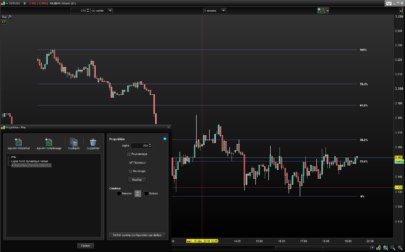
- Draw the levels thus calculated on the graph with first threshold (target) at 76.4% corresponding to twice the maximum / minimum value (2X OPR) represented by the arrows (green and red)
- Extension of Fibonacci levels up to 200% in both directions …
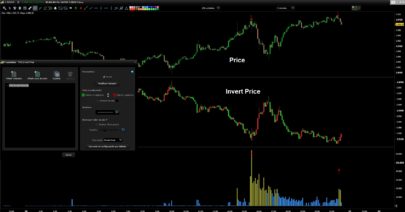
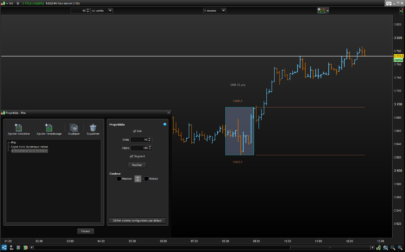
Available settings:
- “Alpha” Setting transparency of information
- “Offset” Position of the maximum and minimum values above and below the rectangle
- “Level” Visualize or hide the Fibonacci levels
- “Text” Shows or hides the up / down values, arrows (2x OPR) and HI and LO segments
As usual, everything is mixable
|
1 2 3 4 5 6 7 8 9 10 11 12 13 14 15 16 17 18 19 20 21 22 23 24 25 26 27 28 29 30 31 32 33 34 35 36 37 38 39 40 41 42 43 44 45 46 47 48 49 50 51 52 53 54 55 56 57 58 59 60 61 62 63 64 65 66 67 68 69 70 71 72 73 74 75 76 77 78 79 80 81 82 83 84 85 86 87 88 89 90 91 92 93 94 95 96 97 98 99 100 101 102 103 104 105 106 107 108 109 110 111 112 |
// Market Resilence EUR | Graph Indicator // 19.01.2019 (Release 1.0) // Swapping @ www.forexswap.fr // Sharing ProRealTime knowledge (alt+16) ( use with time frame 5mn ) // --- property settings //Alpha = 180 // Transparency text //Offset = 10 // Offset alphanumeric/rectangle OPR //Level = 1 // (0=hidden; 1=observable) //Text = 1 // (0=no text; 1=text) // --- end DefParam DrawOnLastBarOnly = true starttime = 080500 // 08h00 Pré Market EU (Cac, Dax, Footsie, ect...) endtime = 090000 // 09h00 Ouverture session européenne alpha = max(alpha,0) // Restricted input variable Max-Min alpha = min(alpha,255) dif = hh-ll fib38 = hh fib0 = ll if time = starttime then startbar = barindex endif if time = endtime then endbar = barindex endif if time >= starttime and time <= endtime then if high > hh then hh = high endif if low < ll or ll = 0 then ll = low endif endif if intradaybarindex = 0 then hh = 0 ll = 0 endif //hh = round(hh) // Option résultat valeur arrondi //ll = round(ll) // Option résultat valeur arrondi if time > endtime then //DrawRectangle(startbar,hh,endbar,ll) coloured(0,255,255,alpha) // Option Rectangle (Alpha = transparence) //DrawEllipse(startbar,hh,endbar,ll) coloured(0,255,255,alpha) // Option ellipse DrawSegment(startbar,Hh,endbar,Hh) coloured(123,123,123,alpha) // Segment Upper DrawSegment(startbar,Ll,endbar,Ll) coloured(123,123,123,alpha) // Segment Lower DrawSegment(startbar,hh,endbar-11,ll) coloured(123,123,123,alpha) // Segment Left DrawSegment(startbar+11,Hh,endbar,Ll) coloured(123,123,123,alpha) // Segment Right endif if Text = 1 then DrawText("OPR #dif#pts",startbar+6,hh+(offset*4),SansSerif,Bold,11) coloured(150,150,150,alpha) DrawText(" HI #hh# ",startbar+6,hh+(offset),SansSerif,Standard,10) coloured(22,111,0,alpha) //DrawText("Bull Market",startbar+5,hh+(offset),Dialog,Bold,12) coloured(22,111,0,alpha) // Option text only //DrawLine(barindex-1,hh,barindex,hh) coloured(111,11,111,alpha) // Option ligne continue DrawSegment(endbar,hh,barindex,hh) coloured(0,200,0,alpha) DrawText("╔═════► ",startbar+6,hh+(dif),Dialog,Bold,10) coloured(22,111,0,alpha) // Option OPR - 100% (Glyphe alt+201, alt+205) DrawText(" LO #ll# ",startbar+6,ll-(offset),SansSerif,Standard,10) coloured(200,20,20,alpha) //DrawText("Bear Market",startbar+5,ll-(offset),Dialog,Bold,12) coloured(200,20,20,alpha) // Option text only //DrawLine(barindex-1,ll,barindex,ll) coloured(111,11,111,alpha) // Option ligne continue DrawSegment(endbar,ll,barindex,ll) coloured(200,0,0,alpha) DrawText("╚═════► ",startbar+6,ll-(dif),Dialog,Bold,10) coloured(200,10,10,alpha) // Option OPR - 100% (Glyphe alt+200, alt+205) endif if Level = 1 then fibobull200 = (fib38-fib0)*5.236+fib0 DrawSegment(endbar+2,fibobull200,barindex-10,fibobull200) coloured(25,100,0,alpha) DrawText("Bullish 200%",barindex-2,fibobull200,SansSerif,Bold,11) coloured(25,100,0,alpha) fibobull162 = (fib38-fib0)*4.236+fib0 DrawSegment(endbar+2,fibobull162,barindex-10,fibobull162) coloured(25,100,0,alpha) DrawText("161.8%",barindex-3,fibobull162,SansSerif,Bold,11) coloured(25,100,0,alpha) fibobull124 = (fib38-fib0)*3.236+fib0 DrawSegment(endbar+2,fibobull124,barindex-10,fibobull124) coloured(25,100,0,alpha) DrawText("123.6%",barindex-3,fibobull124,SansSerif,Bold,11) coloured(25,100,0,alpha) fibobull100 = (fib38-fib0)*1.618+fib38 DrawSegment(endbar+2,fibobull100,barindex-10,fibobull100) coloured(25,100,0,alpha) DrawText("100%",barindex-3,fibobull100,SansSerif,Bold,11) coloured(25,100,0,alpha) fibobull76 = (fib38-fib0)+fib38 DrawSegment(endbar+2,fibobull76,barindex-10,fibobull76) coloured(25,100,0,alpha) DrawText("76.4%",barindex-3,fibobull76,SansSerif,Bold,11) coloured(25,100,0,alpha) fibobull62 = (fib38-fib0)*1.618+fib0 DrawSegment(endbar+2,fibobull62,barindex-10,fibobull62) coloured(25,100,0,alpha) DrawText("61.8%",barindex-3,fibobull62,SansSerif,Bold,11) coloured(25,100,0,alpha) fibobear62 = (fib0-fib38)*.618+fib0 DrawSegment(endbar+2,fibobear62,barindex-10,fibobear62) coloured(200,11,11,alpha) DrawText("61.8%",barindex-3,fibobear62,SansSerif,Bold,11) coloured(200,10,10,alpha) fibobear76 = (fib0-fib38)+fib0 DrawText("76.4%",barindex-3,fibobear76,SansSerif,Bold,11) coloured(200,10,10,alpha) DrawSegment(endbar+2,fibobear76,barindex-10,fibobear76) coloured(200,11,11,alpha) fibobear100 = (fib0-fib38)*1.618+fib0 DrawText("100%",barindex-3,fibobear100,SansSerif,Bold,11) coloured(200,10,10,alpha) DrawSegment(endbar+2,fibobear100,barindex-10,fibobear100) coloured(200,11,11,alpha) fibobear124 = (fib0-fib38)*2.236+fib0 DrawSegment(endbar+2,fibobear124,barindex-10,fibobear124) coloured(200,11,11,alpha) DrawText("123.6%",barindex-3,fibobear124,SansSerif,Bold,11) coloured(200,10,10,alpha) fibobear162 = (fib0-fib38)*3.236+fib0 DrawSegment(endbar+2,fibobear162,barindex-10,fibobear162) coloured(200,11,11,alpha) DrawText("161.8%",barindex-3,fibobear162,SansSerif,Bold,11) coloured(200,10,10,alpha) fibobear200 = (fib0-fib38)*4.236+fib0 DrawSegment(endbar+2,fibobear200,barindex-10,fibobear200) coloured(200,11,11,alpha) DrawText("Bearish 200%",barindex-2,fibobear200,SansSerif,Bold,11) coloured(200,10,10,alpha) endif return |
Share this
No information on this site is investment advice or a solicitation to buy or sell any financial instrument. Past performance is not indicative of future results. Trading may expose you to risk of loss greater than your deposits and is only suitable for experienced investors who have sufficient financial means to bear such risk.
ProRealTime ITF files and other attachments :
Find other exclusive trading pro-tools on ![]()
PRC is also on YouTube, subscribe to our channel for exclusive content and tutorials


sul FIB non funziona
per me funziona, spiegazione ?
inserisco l’indicatore e non mi da nessuna linea
ho provato anche a mettere dalle 9 alle 10 poichè il fib apre alle 9 e non alle 8 come il dax ma non funziona, ho inserito le variabili ma non funziona.
probabilmente sbaglio qualcosa
NO FUNCIONA.. no sale absolutamente nada
j’aimerai rendre cet indicateur détectable à travers le proscreener. Par exemple, cours touche le résistance 76,4%. Est-ce possible?
Bonjour winnie37, je pense que cela peut-être possible en ajoutant une condition par exemple quand le prix touche le niveau des 76.4 (qui est lisible bien avant que le cours n’y arrive) et donc ajouter une variable externe par laquelle on ajoute la valeur du niveau à détecter tout niveau pourra alors faire le job…
s’il faut, ouvre un thread sur le forum pour qu’on puisse développer ta demande
cordialement swapping
Hi,
This is great !! anyone ever developped a strategy about it ???
hello Kris75, not that I know but it is possible to make a scenario 😉
Hi swapping,
Thanks for sharing this useful tool. I was wondering how difficult it would be to make the 1st hour levels stay on the chart from one day to the next (like the standard pivot levels indicator) ?