Quick Fib

v10.3
Quick Fib

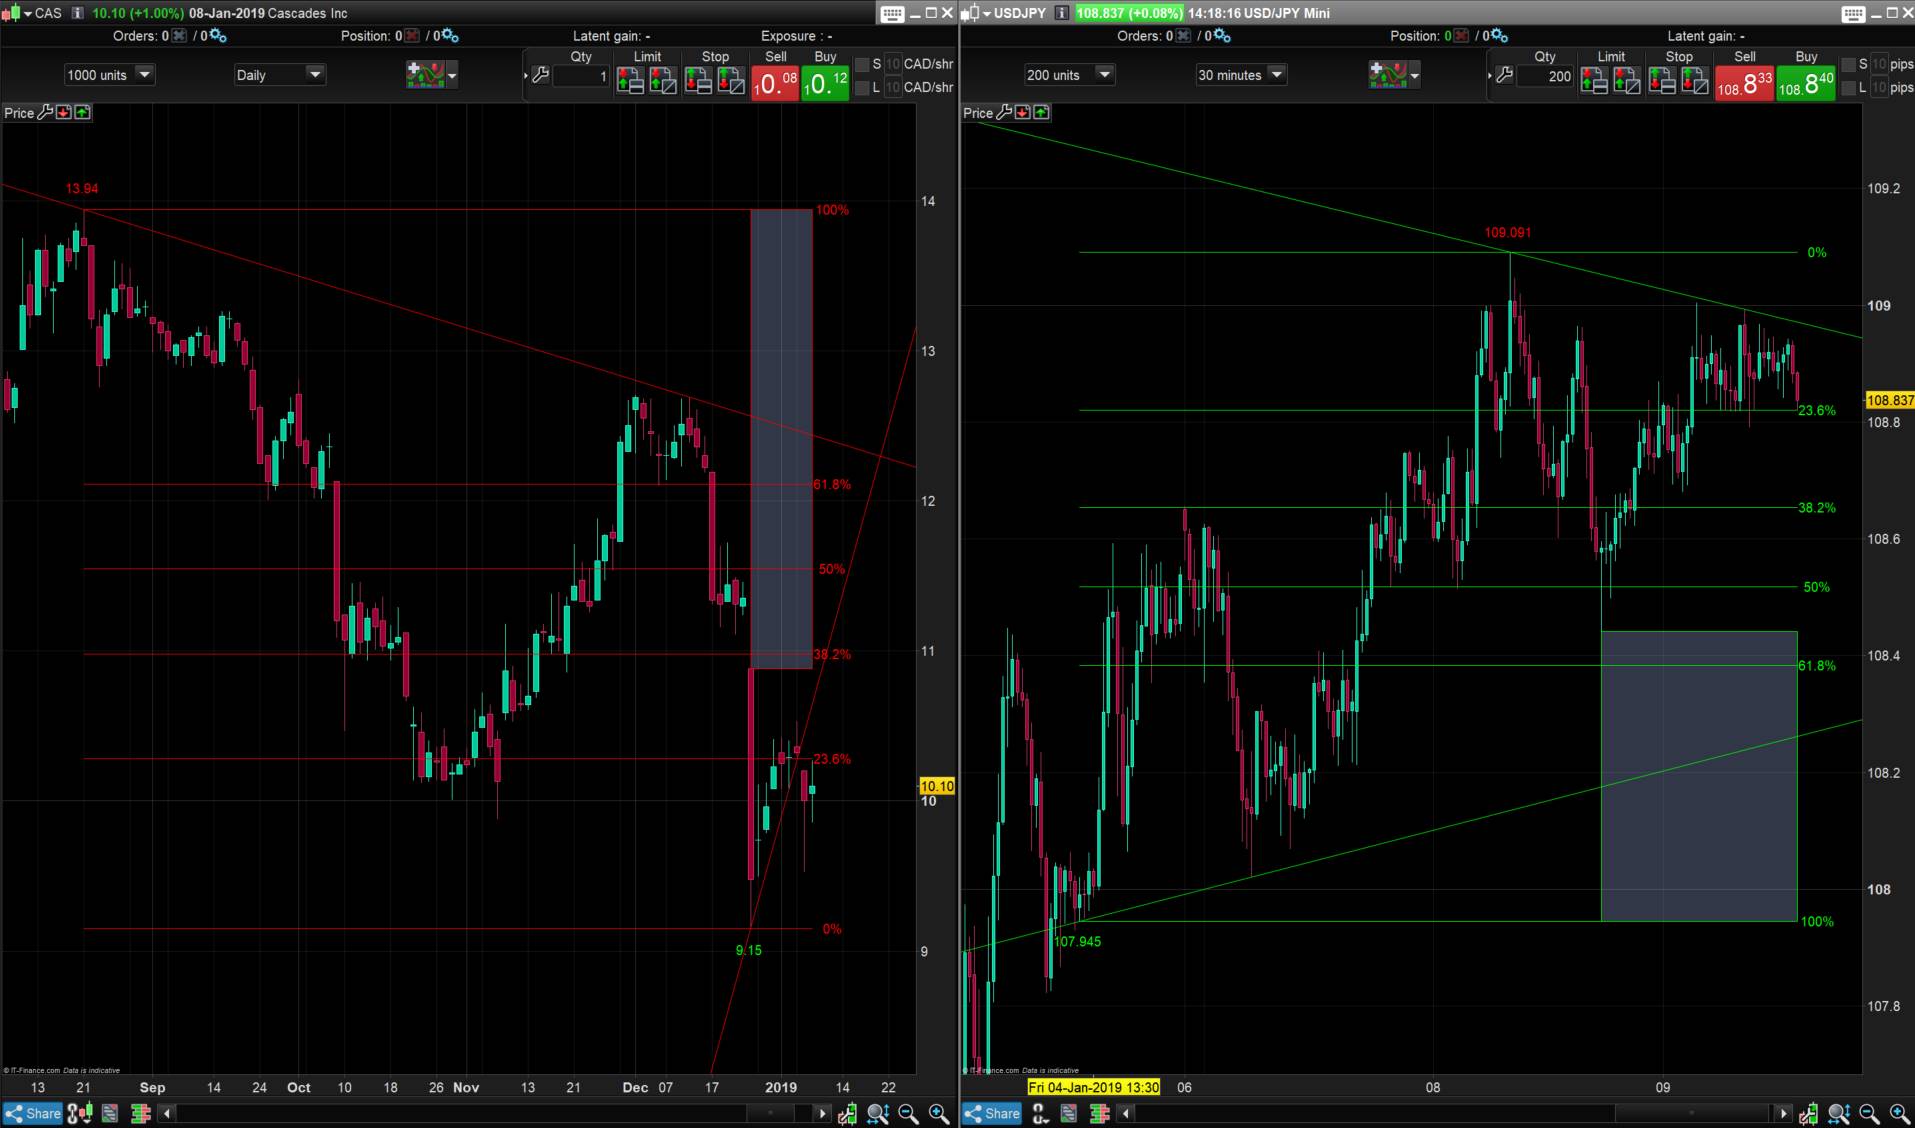
The Quick Fibonacci indicator plots automatically the Fibonacci retracement calculated with the last highest high and lowest low of the last X periods.

It adds on the price chart 2 trend lines:

  • ascending trendline starting from lowest low to second lowest price found
  • descending trendline starting from highest high to second highest price found

A “retracement block” can be also drawn by the indicator to indicate how much the price has retraced since the Fibonacci figure was formed.

The retracement lines change color depending of the trend:

  • green color if the price has retraced from a lowest low (price is ascending since longer)
  • red color if the price has retraced from a highest high (price is descending since longer)


Share this

Risk disclosure:

No information on this site is investment advice or a solicitation to buy or sell any financial instrument. Past performance is not indicative of future results. Trading may expose you to risk of loss greater than your deposits and is only suitable for experienced investors who have sufficient financial means to bear such risk.

ProRealTime ITF files and other attachments : How to import ITF files into ProRealTime platform?

PRC is also on YouTube, subscribe to our channel for exclusive content and tutorials

  1. supertiti • 01/09/2019 #

    Bonjour Nicolas,

    Tu commences fort l’année ! quelle soit bonne et fructueuse pour tous tes projets.

    Pourrais tu rajouter le fibo 76.4% sur le code ?

    Et quel est le bout de code qui reflète les lignes de tendances ?

    merci, bonne après midi

  2. swapping • 01/09/2019 #

    excellent travail qui va devenir rapidement indispensable à certain 🙂
    @supertiti, pour l’ajout du fibo 76.4% et comme le bouton [Add PRT code] fait toujours des siennes dans les réponses, les voici une à une !
    insert après ligne 36 (du code original)

    fibo764 = ll+(fullrange*0.764)

    insert après ligne 48 (du code original)

    fibo764 = hh-(fullrange*0.764)

    insert après ligne 68 (du code original)

    drawsegment(startbar,fibo764,barindex,fibo764) coloured(r,g,b)
    drawtext(” 76.4%”,barindex,fibo764,Dialog,Standard,20) coloured(r,g,b)

    et pour ce qui traite des lignes de code reflétant les lignes de tendances, je pense que c’est de la ligne 75 à 98

    Bonne année à toi (et à nicolas par la même occasion)

  3. DaxRider • 01/09/2019 #

    Excellent c’est Noël après l’heure
    merci Nicolas pour cet apport
    Bonne année à tous

    • crolakstrading • 01/09/2019 #

      Wow this is brilliant!
      Thank you both Nicolas and and swapping.. I have added 76.4% and also 127.2 and 161.8 as target levels!! please check if its correct!! thanks

  4. supertiti • 01/09/2019 #

    Merci Swapping pour ton aide , meilleurs voeux également

  5. crolakstrading • 01/09/2019 #

    //PRC_Quick Fib | indicator
    //09.01.2019
    //Nicolas @ http://www.prorealcode.com
    //Sharing ProRealTime knowledge

    defparam drawonlastbaronly = true

    // — settings
    //period = 100 //lookback period of the Fibonacci Retracement
    //DrawRetracementBlocks = 1 // 0=false ; 1=true
    // — end of settings

    hh=0
    ll=low
    shiftlowest=barindex
    for i = period downto 1 do
    if high[i]>hh then
    hh=high[i]
    shifthighest=barindex[i]
    endif
    if low[i]<ll then
    ll=low[i]
    shiftlowest=barindex[i]
    endif
    next

    isSwingDown = shiftHighest 0 then
    //plot fibonacci levels
    drawsegment(startbar,fibo100,barindex,fibo100) coloured(r,g,b)
    drawtext(” 100%”,barindex,fibo100,Dialog,Standard,20) coloured(r,g,b)
    drawsegment(startbar,fibo0,barindex,fibo0) coloured(r,g,b)
    drawtext(” 0%”,barindex,fibo0,Dialog,Standard,20) coloured(r,g,b)
    drawsegment(startbar,fibo236,barindex,fibo236) coloured(r,g,b)
    drawtext(” 23.6%”,barindex,fibo236,Dialog,Standard,20) coloured(r,g,b)
    drawsegment(startbar,fibo382,barindex,fibo382) coloured(r,g,b)
    drawtext(” 38.2%”,barindex,fibo382,Dialog,Standard,20) coloured(r,g,b)
    drawsegment(startbar,fibo50,barindex,fibo50) coloured(r,g,b)
    drawtext(” 50%”,barindex,fibo50,Dialog,Standard,20) coloured(r,g,b)
    drawsegment(startbar,fibo618,barindex,fibo618) coloured(r,g,b)
    drawtext(” 61.8%”,barindex,fibo618,Dialog,Standard,20) coloured(r,g,b)
    drawsegment(startbar,fibo764,barindex,fibo764)coloured(r,g,b)
    drawtext (” 76.4%”, barindex,fibo764,Dialog,Standard,20) coloured (r, g, b)
    drawsegment(startbar,fibo272,barindex,fibo272)coloured(r,g,b)
    drawtext (” -27.2%”, barindex,fibo272,Dialog,Standard,20) coloured (r, g, b)
    drawsegment(startbar,fibo1618,barindex,fibo1618)coloured(r,g,b)
    drawtext (” -61.8%”, barindex,fibo1618,Dialog,Standard,20) coloured (r, g, b)
    //plot price at 0% and 100% levels
    drawtext(“#ll#”,shiftlowest,ll-fullrange*0.03,dialog,standard,20) coloured(0,255,0)
    drawtext(“#hh#”,shifthighest,hh+fullrange*0.03,dialog,standard,20) coloured(255,0,0)
    endif

    //contour lines
    shiftContourDown = barindex-shiftHighest
    highestSlope = 0
    counth=max(1,(barindex-shifthighest))
    for i = 2 to counth do
    thisSlope = (High[i] – hh) / ((barindex-shiftHighest) – i)

    if (thisSlope >= highestSlope or highestSlope = 0) then
    shiftContourDown = i
    highestSlope = thisSlope
    endif
    next
    shiftContourUp = barindex-shiftLowest
    LowestSlope = 0
    countl=max(1,(barindex-shiftLowest))
    for i = 2 to countl do
    thisSlope = (low[i] – ll) / ((barindex-shiftLowest) – i)

    if (thisSlope <= LowestSlope or LowestSlope = 0) then
    shiftContourUp = i
    LowestSlope = thisSlope
    endif
    next
    drawline(shifthighest,hh,barindex[shiftcontourdown],high[shiftcontourdown]) coloured(r,g,b)
    drawline(shiftlowest,ll,barindex[shiftcontourup],low[shiftcontourup]) coloured(r,g,b)

    //retracement blocks
    if DrawRetracementBlocks then
    if not isSwingDown then
    blockprice=hh
    startbar=barindex-shifthighest
    for i = startbar downto 2 do
    if low[i]blockprice then
    blockprice=high[i]
    blockbar=barindex[i]
    endif
    next
    drawrectangle(blockbar,blockprice,barindex,hh) coloured(r,g,b)
    endif

    endif

    return

  6. supertiti • 01/09/2019 #

    Pour le niveau fibo 76.4 c’est bon ça fonctionne.

    Pour les lignes de tendances c’est pas bon , j’avais déjà pris ce bloc sans succès, peut être que le chef peut nous aider ?

    Bonne soirée

  7. supertiti • 01/09/2019 #

    Pour les droites de tendances ce code fonctionne bien

    nota le bouton add PRT code ne fonctionne pas ici

    defparam drawonlastbaronly = true

    // — settings
    //period = 100 //lookback period of the Fibonacci Retracement
    // — end of settings

    hh=0
    ll=low
    shiftlowest=barindex
    for i = period downto 1 do
    if high[i]>hh then
    hh=high[i]
    shifthighest=barindex[i]
    endif
    if low[i]<ll then
    ll=low[i]
    shiftlowest=barindex[i]
    endif
    next
    isSwingDown = shiftHighest 0 then
    drawtext(“#ll#”,shiftlowest,ll-fullrange*0.03,dialog,standard,20) coloured(0,255,0)
    drawtext(“#hh#”,shifthighest,hh+fullrange*0.03,dialog,standard,20) coloured(255,0,0)
    endif

    //contour lines
    shiftContourDown = barindex-shiftHighest
    highestSlope = 0
    counth=max(1,(barindex-shifthighest))
    for i = 2 to counth do
    thisSlope = (High[i] – hh) / ((barindex-shiftHighest) – i)

    if (thisSlope >= highestSlope or highestSlope = 0) then
    shiftContourDown = i
    highestSlope = thisSlope
    endif
    next
    shiftContourUp = barindex-shiftLowest
    LowestSlope = 0
    countl=max(1,(barindex-shiftLowest))
    for i = 2 to countl do
    thisSlope = (low[i] – ll) / ((barindex-shiftLowest) – i)

    if (thisSlope <= LowestSlope or LowestSlope = 0) then
    shiftContourUp = i
    LowestSlope = thisSlope
    endif
    next
    drawline(shifthighest,hh,barindex[shiftcontourdown],high[shiftcontourdown]) coloured(r,g,b)
    drawline(shiftlowest,ll,barindex[shiftcontourup],low[shiftcontourup]) coloured(r,g,b)

    return

  8. Florian Legeard • 01/09/2019 #

    Bonjour,
    Quel est le bon code avec l’ajout de Fibo 76,4 % et les tendances qui fonctionnent ? Merci à vous 😉

  9. swapping • 01/09/2019 #

    Bonjour Florian, c’est les ajouts des lignes que j’ai mentionné dans ma seconde réponse (sous celui de supertiti)

  10. swapping • 01/09/2019 #

    test pour visualiser ce que donne quelque ligne de programme avec la balise “code”

    hh = 0
    ll = low
    shiftlowest = barindex
    for i = period downto 1 do
    if high[i]>hh then
    hh = high[i]
    shifthighest = barindex[i]
    endif
    if low[i]<ll then
    ll = low[i]
    shiftlowest = barindex[i]
    endif
    next

  11. swapping • 01/09/2019 #

    Voici la modification du code de Nicolas pour les personnes intéressées comprenant :
    1) le niveau de “76.4% de Fibonacci”
    2) une case à cocher supplémentaire “TrendLine” afin de ne visualiser que les Trend Line (si vous le souhaitez)
    3) une case à cocher supplémentaire “Fibonacci” afin de ne visualiser que les niveaux de Fibonacci (idem)
    et si vous décochez les 3 cases et bien vous n’avez plus rien 😉 il vaut mieux l’appeler PRC_QuickFibTL pour le différencier de l’original (qui donne de très bon résultats d’ailleurs)

    //PRC_Quick Fib Trend Line | indicator
    //09.01.2019 (release 1.1)
    //Nicolas @ http://www.prorealcode.com
    //Sharing ProRealTime knowledge

    DefParam DrawOnLastBarOnly = true

    // — settings
    //period = 100 // lookback period of the Fibonacci Retracement
    //DrawRetracementBlocks = 1 // 0=false ; 1=true
    //TrendLine = 1 // 0=false ; 1=true
    // — end of settings

    hh = 0
    ll = low
    shiftlowest = barindex
    for i = period downto 1 do
    if high[i]>hh then
    hh = high[i]
    shifthighest = barindex[i]
    endif
    if low[i]= highestSlope or highestSlope = 0) then
    shiftContourDown = i
    highestSlope = thisSlope
    endif
    next
    shiftContourUp = barindex-shiftLowest
    LowestSlope = 0
    countl = max(1,(barindex-shiftLowest))
    for i = 2 to countl do
    thisSlope = (low[i] – ll) / ((barindex-shiftLowest) – i)

    if (thisSlope <= LowestSlope or LowestSlope = 0) then
    shiftContourUp = i
    LowestSlope = thisSlope
    endif
    next
    DrawLine(shifthighest,hh,barindex[shiftcontourdown],high[shiftcontourdown]) coloured(r,g,b)
    DrawLine(shiftlowest,ll,barindex[shiftcontourup],low[shiftcontourup]) coloured(r,g,b)
    endif

    isSwingDown = shiftHighest 0 then
    // plot fibonacci levels
    DrawSegment(startbar,fibo100,barindex,fibo100) coloured(r,g,b)
    DrawText(” 100%”,barindex,fibo100,Dialog,Standard,11) coloured(r,g,b)
    DrawSegment(startbar,fibo0,barindex,fibo0) coloured(r,g,b)
    DrawText(” 0%”,barindex,fibo0,Dialog,Standard,11) coloured(r,g,b)
    DrawSegment(startbar,fibo236,barindex,fibo236) coloured(r,g,b)
    DrawText(” 23.6%”,barindex,fibo236,Dialog,Standard,11) coloured(r,g,b)
    DrawSegment(startbar,fibo382,barindex,fibo382) coloured(r,g,b)
    DrawText(” 38.2%”,barindex,fibo382,Dialog,Standard,11) coloured(r,g,b)
    DrawSegment(startbar,fibo50,barindex,fibo50) coloured(r,g,b)
    DrawText(” 50%”,barindex,fibo50,Dialog,Standard,11) coloured(r,g,b)
    DrawSegment(startbar,fibo618,barindex,fibo618) coloured(r,g,b)
    DrawText(” 61.8%”,barindex,fibo618,Dialog,Standard,11) coloured(r,g,b)
    DrawSegment(startbar,fibo764,barindex,fibo764) coloured(r,g,b)
    DrawText(” 76.4%”,barindex,fibo764,Dialog,Standard,11) coloured(r,g,b)
    // plot price at 0% and 100% levels
    DrawText(“HI #hh#”,shifthighest,hh+fullrange*0.03,dialog,standard,11) coloured(255,0,0)
    DrawText(“LO #ll#”,shiftlowest,ll-fullrange*0.03,dialog,standard,11) coloured(0,255,0)
    endif
    endif

    // retracement blocks
    if DrawRetracementBlocks then
    if not isSwingDown then
    blockprice = hh
    startbar = barindex-shifthighest
    for i = startbar downto 2 do
    if low[i]blockprice then
    blockprice = high[i]
    blockbar = barindex[i]
    endif
    next
    DrawRectangle(blockbar,blockprice,barindex,hh) coloured(r,g,b)
    endif

    endif

    return

  12. swapping • 01/09/2019 #

    N’oubliez pas d’ajouter dans les variables par la clef a mollette comme ci dessous

    TrendLine Type (booléen = vrai)
    Fibonacci Type (booléen = vrai)

  13. supertiti • 01/09/2019 #

    @ Swapping

    J’ai des erreurs sur ton code ?

    ligne 23 0) parenthèse en trop
    ligne 41 endif
    ligne 43 is swingdown ….
    ligne 71 if low ….

    une idée ? merci

  14. swapping • 01/09/2019 #

    oui supertiti, même en faisant un copier/coller de ma modif (qui fonctionne parfaitement sur ma plate forme), il y a de nouvelles erreurs qui se crée en utilisant la balise (code), dommage que Nicolas ou un programmeur chez Prorealcode ne regarde pas de près ce bug dès qu’on utilise la balise [Add PRT code], ce serais plus pratique et éviterais ce genre de situation ou on génère d’autres erreurs au lieu d’apporter sa pierre à l’édifice ! Donc le mieux serais d’ouvrir un thread spécifique dans le forum pour pouvoir utiliser cette balise qui fonctionne correctement dans ce cas de figure …

  15. swapping • 01/09/2019 #

    Voici le lien pour continuer cette discussion (avec le code correct) sur le forum français …
    https://www.prorealcode.com/topic/prc_quickfibtl/

  16. robdav • 01/09/2019 #

    Shouldn’t the missing level be 78.6 not 76.4!

  17. Hans63 • 01/09/2019 #

    78.6 yes it’s the square root of 0.618

  18. Hans63 • 01/09/2019 #

    However I have a problem with this tool
    I have a annoying vertical line that appears in the previous bar before the last bar and start from the ZERO LEVEL OF THE GRAPH TO THE INFINITO
    Furthermore the number of retracement are too big

  19. Hans63 • 01/09/2019 #

    here’s a pic

    https://i.ibb.co/QQcj7Vb/Quick-fibo.png

  20. robdav • 01/09/2019 #

    @Hans63, not sure if it will fix the problem but worth trying this option.

  21. robdav • 01/09/2019 #

    https://drive.google.com/file/d/1-HuXczXqf-92g8xcZxXF_FYj6OzfX5TW/view?usp=sharing

  22. swapping • 01/09/2019 #

    https://www.prorealcode.com/topic/prc_quickfibtl/

    Please Hans63 and robdav follow to upper link and download the good file PRC_QuikFibTL.itf 😉

  23. Hans63 • 01/09/2019 #

    Thank you swapping

  24. FREDNC • 01/09/2019 #

    @Nicolas merci pour se remarquable indicateur, reste à voir comment on va pourvoir l’intégrer dans nos stratégies 😉

avatar
Register or

Likes

avatar avatar avatar avatar avatar avatar avatar avatar avatar avatar avatar avatar avatar avatar avatar avatar

+13 more likes

Related users ' posts
smp I also have an End Of Day (EOD) cash pivot indicator for use on cash markets; this indicator...
Jigsaw20000 Bonjour, Je voudrais mettre le liens du code en format .itf mais je n'y arrive pas , quelqu'...
Corto78 Il faut aller dans la liste des ProBacktest & Trading Automatique (là ou tu as créer ton...
Malloc Bonjour, Votre système a l'air intéressant et prometteur mais en l'état il est inutilisable...
IV Mcm I don't speak English and the translation is not clear. Do you have a different turn of ...
IV Mcm stonk ?
avatar
Anonymous Thanks very much for sharing, look forward to testing this idea out.
mistersylv What parameter should we change to make another channel appear in the higher or lower time u...
Nicolas Oui c'est possible. Merci de ne pas poster des demandes qui sont hors sujets. Pour les deman...
Igor Merci pour cet itf. Question : comment faire pour instruire un screener ?
Nicolas tester le croisement du Close avec la première valeur de l'indicateur : "TrailingStop", faci...
Nicolas Pour créer des alertes, vous pouvez suivre ce petit tutoriel : https://www.prorealtime.com/f...
thibault76 Bonjour Nicolas, cette stratégie est intéressante. Par contre, en 2022, le code ne fonction...
Nicolas Aucun message d'erreur pour ma part en version 11.1. Tu es certain de créer un code d'indica...
Meta Signals Pro Pleasure ! Please let us know if you make good trades with it and if you see improvements we...
francis59 Bonjour, Bonjour, comment puis-je créer un screener basé sur cet indicateur, qui affiche le...
Trader Sab I am curious to try it how, however I get an error message for line 47 and 48 - drawsegment,...
rama what is the buy condition or sell condition for this can you suggest a code k1=1 buy and k1...
rama I would like to know at point 1 an alert or binary indicator so that I can place order
maxlys Bonjour Nicolas, merci pour ce code qui a l'air intéressant. Comment ajouter dans le code l'...
Dari when I put the indicator does not put it on the price, sn in a new box like many indicators....
Nicolas by adding it on price instead. Use the wrench on the left upper side of your price chart.
Nicolas Add indicator on price doesnt require any specific type of subcription. Click on the wrench ...
tahiti bonjour j'ai une petite question comment peux on enlevé la bar blanche sur la bougie en cour...
sixeight Hi Kris, is there a way to increase the number of rows? I get a loop error
Kris75 Hi, This is great !! anyone ever developped a strategy about it ???
swapping hello Kris75, not that I know but it is possible to make a scenario ;)
digitation Hi swapping, Thanks for sharing this useful tool. I was wondering how difficult it would be...
swapping fib1236 = (hiday-lowday)*1.236+lowday DrawSegment(startbar,fib1236,barindex,fib1236) colou...
swapping Oups ! Nicolas il y a un problème avec l'insertion de code en utilisant le bouton [Add PRT ...
swapping fib1236 = (hiday-lowday)*1.236+lowday DrawSegment(startbar,fib1236,barindex,fib1236) colour...
Nicolas Sure, I suggest you open a new topic in the forum to discuss about your ideas.
hdgm Bonjour Nicolas, est ce que l'on peut en faire une stratégie de trading automatisée ?
Nicolas Non, pas en utilisant l'indicateur zigzag traditionnel de la plateforme.
Van Salt Hi Bianca, the indicator shows you some interesting cluster-zones from long- and shortterm f...
Vinci1966 Questo indicatore è molto interessante. Mi sono permesso di apportare alcune modifiche nell'...
Vinci1966 // VAN SALT´s <> Version 20171105 // This Indicator draws the Shortterm and Longtern ...
Nicolas Please open a new forum topic, and respect the posting rules. Add a precise description of w...
FXTT ok will do, apologies, as I said I am new here. many thanks
Noobywan Version v2 including requested additions: https://www.prorealcode.com/prorealtime-indicators...
marinober Ciao. avrei necessità di usare questo indicatore in intraday . Dovrei poter dare un prezzo d...
Nicolas Use the wrench of the price chart! Upper left of the window
Dymjohn The wrench shows options for the components of the indicator not how to show in the main cha...
Nicolas http://www.prorealcode.com/topic/overlapping-indicators/  
Nicolas Dans l'onglet prix, choisir d'appliquer l'échelle qu'au prix uniquement.
Eloi MERCI
211 Really nice indicator Nicolas! Well done!
supertiti Bonjour Nicolas comme j'avais l'impression qu'il en manque un bout j'ai fais ça : Peux...
Nicolas Merci supertiti ! C'est juste, encore un ptit bug quelquepart ! :|
Nicolas Je pense que cela a été fait dans le forum il y a quelques temps, il faudrait le retrouver t...
besserwerden Hello, I want t use this screener, but only results for uptrend. Is there a possibillity to ...
besserwerden Hello Nicolas, I want t use this screener, but only results for uptrend. Is there a possibil...

Top