

Fibonacci Pivots Points 4 Hours, Daily, Weekly and Monthly
November 3, 2017, 2:42 PM
Indicators
26 Comments
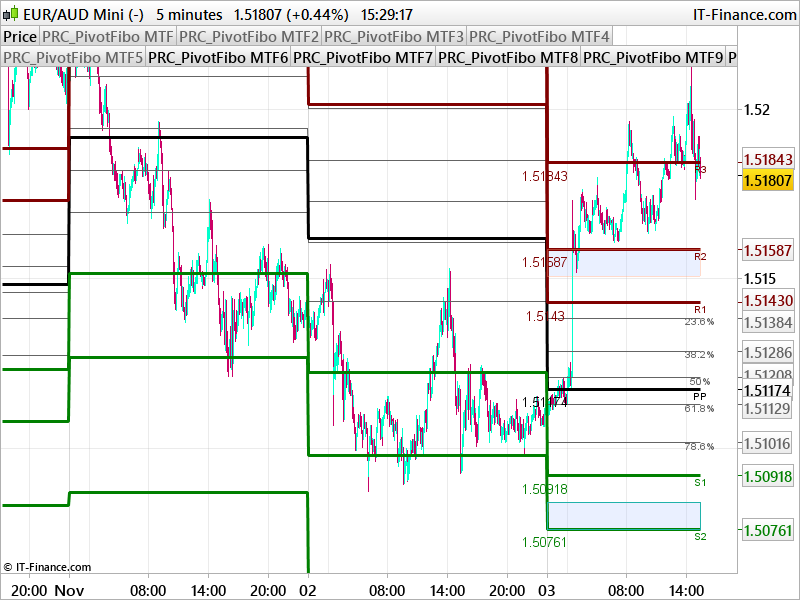
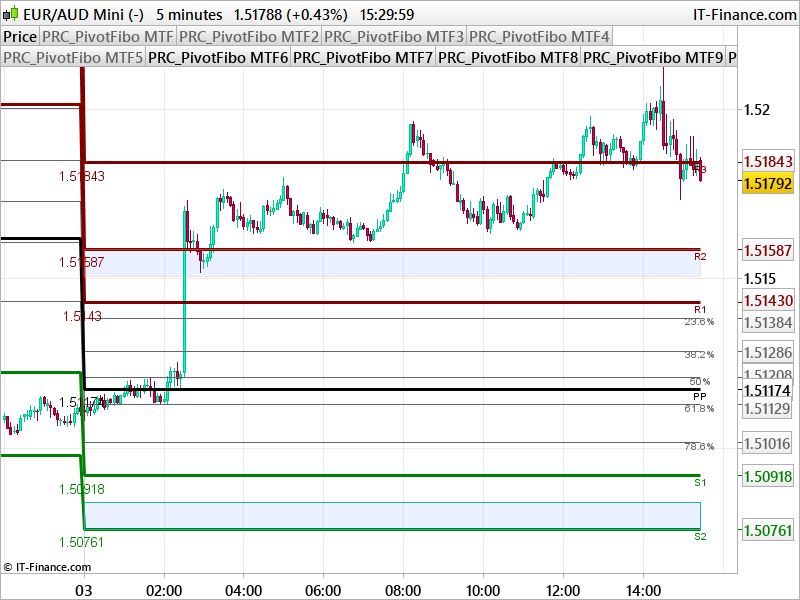
This is a whole new pivot points indicator with multiple timeframe capabilities:
4 different timeframes possible, make selection with “PivotTF” setting:
0 = Daily pivot points
1 = Weekly pivot points
2 = Monthly pivot points
3 = 4 hours pivots points
This pivots points indicator display also Fibonacci retracement numbers from previous period.
In settings, you also have the possibility to plot or not some informations:
_ middle pivot points (lines)
_ pivots and Fibonacci pivot points labels
_ pivots prices
_ “zones”(plotted with rectangles) between S1 and S2, and between R1 and R2
//PRC_PivotFibo MTF | indicator
//03.11.2017
//Nicolas @ www.prorealcode.com
//Sharing ProRealTime knowledge

defparam drawonlastbaronly=true

// --- settings
//PlotPivots=1
//PlotPivotsLabels=1
//PlotPivotsPrices=1
//PlotMiddle=0
//PlotFibots=1
//PlotFibotsLabel=1
//PlotZones=1
//PivotTF = 3 //0=daily , 1=weekly , 2=monthly, 3=4 hours
// --- end of settings

if intradaybarindex=0 then
 if PivotTF=0 then
  firstbar=barindex
  cclose=close[1]
  hhigh=hh
  llow=ll
 endif
 hh=0
 ll=close*10
endif

if PivotTF=0 then
 hh=max(hh,high)
 ll=min(ll,low)
elsif  PivotTF=1 then
 if DayOfWeek<DayOfWeek[1] then
  hhigh = Highest[BarIndex - lastWeekBarIndex](High)[1]
  llow = Lowest[BarIndex - lastWeekBarIndex](Low)[1]
  cclose=close[1]
  lastWeekBarIndex = BarIndex
  firstbar=barindex
 Endif
elsif PivotTF=2 then
 If Month<>Month[1] then
  hhigh = Highest[BarIndex - lastMonthBarIndex](High)[1]
  llow = Lowest[BarIndex - lastMonthBarIndex](Low)[1]
  cclose=close[1]
  lastMonthBarIndex = BarIndex
  firstbar=barindex
 endif
elsif PivotTF=3 then //H4 timeframe
 if minute=0 and (hour=0 or hour=4 or hour=8 or hour=12 or hour=16 or hour=20) then
  hhigh = Highest[BarIndex - last4HourBarIndex](High)[1]
  llow = Lowest[BarIndex - last4HourBarIndex](Low)[1]
  cclose=close[0]
  last4HourBarIndex = BarIndex[0]
  firstbar=barindex[0]
 endif
endif

if(PlotPivots) then
 PP = (hhigh+llow+cclose)/3.0

 R1 = PP+0.382*(hhigh-llow)
 rR2 = PP+0.618*(hhigh-llow)
 R3 = PP+1.000*(hhigh-llow)

 S1 = PP-0.382*(hhigh-llow)
 S2 = PP-0.618*(hhigh-llow)
 S3 = PP-1.000*(hhigh-llow)

 if(PlotMiddle) then
  M0=0.5*(S2+S3)
  M1=0.5*(S1+S2)
  M2=0.5*(PP+S1)
  M3=0.5*(PP+R1)
  M4=0.5*(R1+rR2)
  M5=0.5*(rR2+R3)
 endif

 if(PlotPivotsLabels) then
  drawtext("PP",barindex,PP-2*pointsize,Dialog,Standard,10)coloured(255,255,255)
  drawtext("R1",barindex,R1-2*pointsize,Dialog,Standard,10)coloured(128,0,0)
  drawtext("R2",barindex,RR2-2*pointsize,Dialog,Standard,10)coloured(128,0,0)
  drawtext("R3",barindex,R3-2*pointsize,Dialog,Standard,10)coloured(128,0,0)
  drawtext("S1",barindex,S1-2*pointsize,Dialog,Standard,10)coloured(0,128,0)
  drawtext("S2",barindex,S2-2*pointsize,Dialog,Standard,10)coloured(0,128,0)
  drawtext("S3",barindex,S3-2*pointsize,Dialog,Standard,10)coloured(0,128,0)
 endif
 if(PlotPivotsPrices) then
  drawtext("#PP#",firstbar,PP-4*pointsize,Dialog,Standard,13)coloured(255,255,255)
  drawtext("#R1#",firstbar,R1-4*pointsize,Dialog,Standard,13)coloured(128,0,0)
  drawtext("#rR2#",firstbar,RR2-4*pointsize,Dialog,Standard,13)coloured(128,0,0)
  drawtext("#R3#",firstbar,R3-4*pointsize,Dialog,Standard,13)coloured(128,0,0)
  drawtext("#S1#",firstbar,S1-4*pointsize,Dialog,Standard,13)coloured(0,128,0)
  drawtext("#S2#",firstbar,S2-4*pointsize,Dialog,Standard,13)coloured(0,128,0)
  drawtext("#S3#",firstbar,S3-4*pointsize,Dialog,Standard,13)coloured(0,128,0)
 endif
 if(PlotZones) then
  drawrectangle(firstbar,rr2,barindex,(rr2+r1)/2) coloured(255,160,122,100)
  drawrectangle(firstbar,s2,barindex,(s1+s2)/2) coloured(32,178,170)
 endif
endif

if(PlotFibots) then
 f236 = (llow+(((hhigh-llow)/100)*(100-23.6)))
 f382 = (llow+(((hhigh-llow)/100)*(100-38.2)))
 f50  = (llow+(((hhigh-llow)/100)*(100-50)))
 f618 = (llow+(((hhigh-llow)/100)*(38.2)))
 f786 = (llow+(((hhigh-llow)/100)*(21.4)))
 if(PlotFibotsLabel) then
  drawtext("23.6%",barindex,f236-1*pointsize,Dialog,Standard,10)coloured(100,100,100)
  drawtext("38.2%",barindex,f382-1*pointsize,Dialog,Standard,10)coloured(100,100,100)
  drawtext("50%",barindex,f50-1*pointsize,Dialog,Standard,10)coloured(100,100,100)
  drawtext("61.8%",barindex,f618-1*pointsize,Dialog,Standard,10)coloured(100,100,100)
  drawtext("78.6%",barindex,f786-1*pointsize,Dialog,Standard,10)coloured(100,100,100)
 endif
endif

return f236 coloured(100,100,100), f382 coloured(100,100,100), f50 coloured(100,100,100), f618 coloured(100,100,100), f786 coloured(100,100,100), M0,M1,M2,M3,M4,M5, PP coloured(255,255,255) style(line,3) as "PP", R1 coloured(128,0,0) style(line,3) as "R1", rR2 coloured(128,0,0) style(line,3) as "R2", R3 coloured(128,0,0) style(line,3) as "R3", S1 coloured(0,128,0) style(line,3) as "S1",S2 coloured(0,128,0) style(line,3) as "S2", S3 coloured(0,128,0) style(line,3) as "S3"
Download
Filename:
PRC_PivotFibo-MTF.itf
Downloads:
702
Download
Filename:
MTF-Fibo-pivot-points.png
Downloads:
273
Legend
I created ProRealCode because I believe in the power of shared knowledge. I spend my time coding new tools and helping members solve complex problems.
If you are stuck on a code or need a fresh perspective on a strategy, I am always willing to help. Welcome to the community!
Author’s Profile
Loading...