







FIBO EASY RETURN
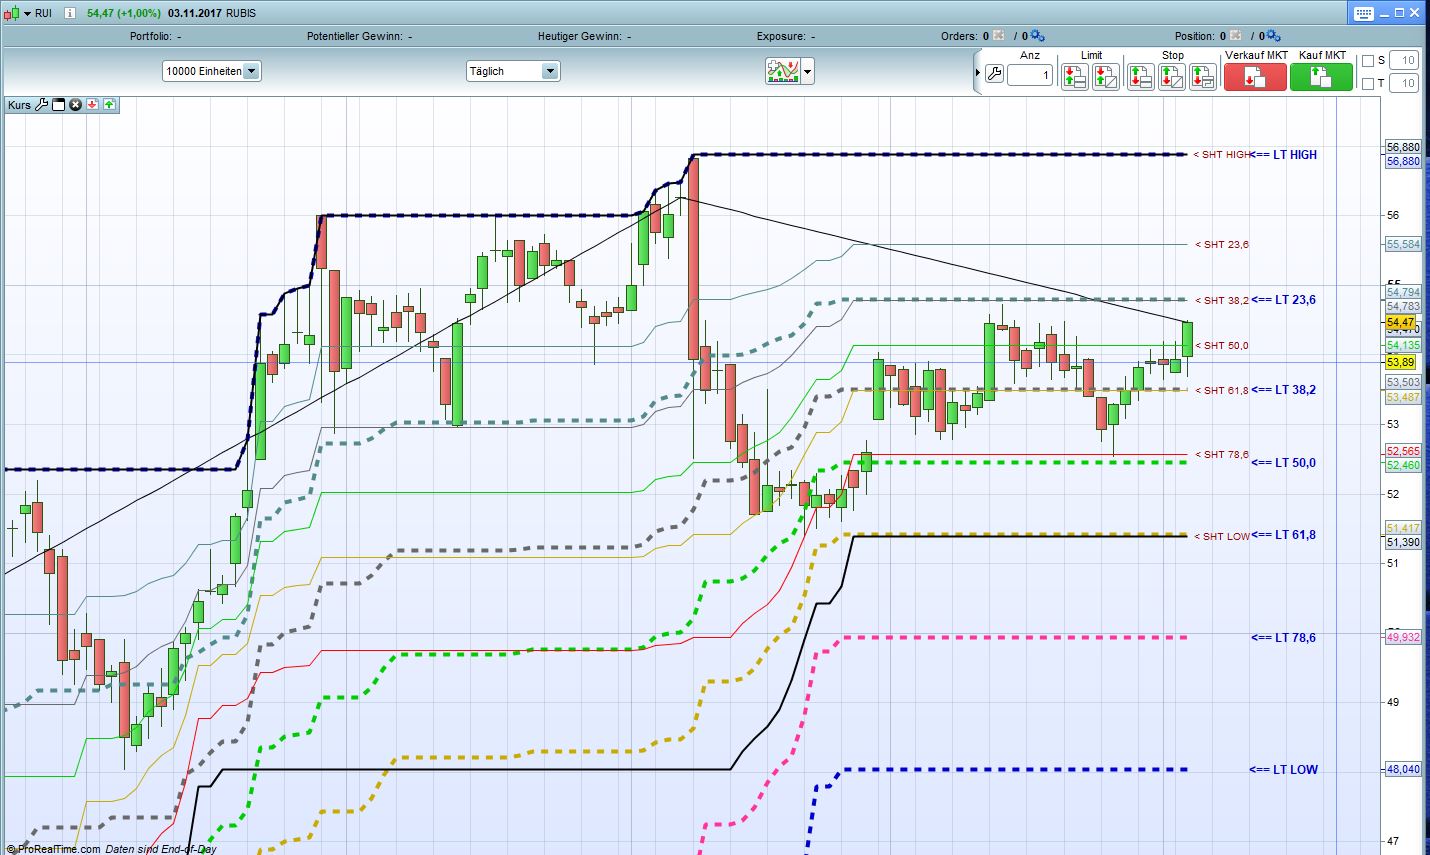
FIBO Easy Return
This indicator draws the longterm and the shortterm Fibonaccci levels based on highest highs and lowest lows.
Parameters for longterm and shortterm can be changed.
Default longterm: 200/100
Default shortterm: 50/50
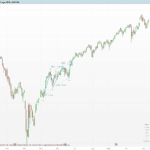
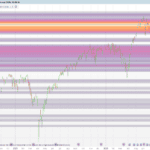
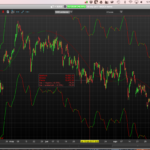
It’s no surprise to see the candles bounce off the levels
Add the Indicator to your price.
Sorry for my basic english 🙂
// VAN SALT´s << FIBO EASY RETURN >> Version 20171105
// This Indicator draws the Shortterm and Longtern Fibonacci Levels based on two Highest High and Lowest Low
// Default Parameter Shortterm HH 50 / LL 50
// Default Parameter Longterm HH 200 / LL 100
// The Parameters can be changed!

defparam drawonlastbaronly = true

hhLT = highest[LongtermHH](high)
llLT = lowest[LongtermLL](low)
hh = highest[ShorttermHH](high)
ll = lowest[ShorttermLL](low)

LTfib236 = (hhLT-llLT)*0.236
LTfib382 = (hhLT-llLT)*0.382
LTfib500 = (hhLT-llLT)*0.5
LTfib618 = (hhLT-llLT)*0.618
LTfib786 = (hhLT-llLT)*0.786

fib236 = (hh-ll)*0.236
fib382 = (hh-ll)*0.382
fib500 = (hh-ll)*0.5
fib618 = (hh-ll)*0.618
fib786 = (hh-ll)*0.786

LTlevel236 = hhLT-LTfib236
LTlevel382 = hhLT-LTfib382
LTlevel500 = hhLT-LTfib500
LTlevel618 = hhLT-LTfib618
LTlevel786 = hhLT-LTfib786

level236 = hh-fib236
level382 = hh-fib382
level500 = hh-fib500
level618 = hh-fib618
level786 = hh-fib786


drawtext("                                                                <== LT HIGH",barindex,hhLT,SansSerif,Bold,12) coloured(0,0,204)
drawtext("                                                                <== LT 23,6",barindex,LTlevel236,SansSerif,Bold,12) coloured(0,0,204)
drawtext("                                                                <== LT 38,2",barindex,LTlevel382,SansSerif,Bold,12) coloured(0,0,204)
drawtext("                                                                <== LT 50,0",barindex,LTlevel500,SansSerif,Bold,12) coloured(0,0,204)
drawtext("                                                                <== LT 61,8",barindex,LTlevel618,SansSerif,Bold,12) coloured(0,0,204)
drawtext("                                                                <== LT 78,6",barindex,LTlevel786,SansSerif,Bold,12) coloured(0,0,204)
drawtext("                                                                <== LT LOW",barindex,llLT,SansSerif,Bold,12) coloured(0,0,204)


drawtext("                               < SHT HIGH",barindex-1,hh) coloured(153,0,0)
drawtext("                               < SHT 23,6",barindex-1,level236) coloured(153,0,0)
drawtext("                               < SHT 38,2",barindex-1,level382) coloured(153,0,0)
drawtext("                               < SHT 50,0",barindex-1,level500) coloured(153,0,0)
drawtext("                               < SHT 61,8",barindex-1,level618) coloured(153,0,0)
drawtext("                               < SHT 78,6",barindex-1,level786) coloured(153,0,0)
drawtext("                               < SHT LOW",barindex-1,ll) coloured(153,0,0)

RETURN hhLT coloured(0,0,204) STYLE(dottedline,4) as "LT HIGH", LTlevel236 coloured(82,139,139) STYLE(dottedline,4) as "LT 23,6", LTlevel382 coloured(105,105,105) STYLE(dottedline,4) as "LT 38,2", LTlevel500 coloured(0,205,0)STYLE(dottedline,4)as "LT 50,0", LTlevel618 coloured(200,170,0)STYLE(dottedline,4) as "LT 61,8", LTlevel786 coloured(255,51,153)STYLE(dottedline,4) as "LT 78,6", llLT coloured(0,0,204) STYLE(dottedline,4) as "LT LOW", hh STYLE(line,2) as "SHT HIGH", level236 coloured(82,139,139) as "SHT 23,6", level382 coloured(105,105,105) as "SHT 38,2", level500 coloured(0,205,0)as "SHT 50,0", level618 coloured(200,170,0) as "SHT 61,8", level786 coloured(255,0,0) as "SHT 78,6", ll STYLE(line,2) as "SHT LOW"
Comments
You must be logged in to post a comment.

Hi Bianca, the indicator shows you some interesting cluster-zones from long- and shortterm fibo-levels. The is no special recommandation to a special share. The values are different. But exactly that shows the indicator. It still follows a Fibo Backtest and a Fibo Screener. So you can test different shares and the best fibo level to buy or sell. I will see, if i add the expansions to the indicator. Nice idea!



// VAN SALT´s <> Version 20171105 // This Indicator draws the Shortterm and Longtern Fibonacci Levels based on two Highest High and Lowest Low // Default Parameter Shortterm HH 50 / LL 50 // Default Parameter Longterm HH 200 / LL 100 // The Parameters can be changed! // Modificato, Integrato e Testato Da Vincenzo Giordano // 26 ottobre 2020 defparam drawonlastbaronly = true hhLT = highest[LongtermHH](high) llLT = lowest[LongtermLL](low) hh = highest[ShorttermHH](high) ll = lowest[ShorttermLL](low) LTfib236 = (hhLT-llLT)*0.236 LTfib382 = (hhLT-llLT)*0.382 LTfib500 = (hhLT-llLT)*0.5 LTfib618 = (hhLT-llLT)*0.618 LTfib786 = (hhLT-llLT)*0.786 LTfib764 = (hhLT-llLT)*0.764 LTfib214 = (hhLT-llLT)*0.214 fib214 = (hh-ll)*0.214 fib236 = (hh-ll)*0.236 fib382 = (hh-ll)*0.382 fib500 = (hh-ll)*0.5 fib618 = (hh-ll)*0.618 fib764 = (hh-ll)*0.764 fib786 = (hh-ll)*0.786 LTlevel236 = hhLT-LTfib236 LTlevel382 = hhLT-LTfib382 LTlevel500 = hhLT-LTfib500 LTlevel618 = hhLT-LTfib618 LTlevel786 = hhLT-LTfib786 LTlevel764 = hhLT-LTfib764 LTlevel214 = hhLT-LTfib214 level214 = hh-fib214 level236 = hh-fib236 level382 = hh-fib382 level500 = hh-fib500 level618 = hh-fib618 level786 = hh-fib786 level764 = hh-fib764 drawtext(" < 00,00",barindex,hhLT,SansSerif,Bold,11) coloured(0,0,204) drawtext(" < 23,60",barindex,LTlevel236,SansSerif,Bold,11) coloured(0,0,204) drawtext(" < 38,20",barindex,LTlevel382,SansSerif,Bold,11) coloured(0,0,204) drawtext(" < 50,00",barindex,LTlevel500,SansSerif,Bold,11) coloured(0,0,204) drawtext(" < 61,80",barindex,LTlevel618,SansSerif,Bold,11) coloured(0,0,204) drawtext(" < 78,60",barindex,LTlevel786,SansSerif,Bold,11) coloured(0,0,204) drawtext(" <100,00",barindex,llLT,SansSerif,Bold,11) coloured(0,0,204) drawtext(" <100,00",barindex,hhLT,SansSerif,Bold,11) coloured(255,0,0) drawtext(" < 78,60",barindex,LTlevel214,SansSerif,Bold,11) coloured(255,0,0) drawtext(" < 61,80",barindex,LTlevel382,SansSerif,Bold,11) coloured(255,0,0) drawtext(" < 50,00",barindex,LTlevel500,SansSerif,Bold,11) coloured(255,0,0) drawtext(" < 38,20",barindex,LTlevel618,SansSerif,Bold,11) coloured(255,0,0) drawtext(" < 23,60",barindex,LTlevel764,SansSerif,Bold,11) coloured(255,0,0) drawtext(" < 00,00",barindex,llLT,SansSerif,Bold,11) coloured(255,0,0) drawtext(" < 00,00",barindex-1,hh) coloured(0,0,255) drawtext(" < 23,60",barindex-1,level236) coloured(0,0,255) drawtext(" < 38,20",barindex-1,level382) coloured(0,0,255) drawtext(" < 50,00",barindex-1,level500) coloured(0,0,255) drawtext(" < 61,80",barindex-1,level618) coloured(0,0,255) drawtext(" < 78,60",barindex-1,level786) coloured(0,0,255) drawtext(" <100,00",barindex-1,ll) coloured(0,0,255) drawtext(" < 100,00",barindex-1,hh) coloured(255,0,0) drawtext(" < 78,60",barindex-1,level214) coloured(255,0,0) drawtext(" < 61,80",barindex-1,level382) coloured(255,0,0) drawtext(" < 50,20",barindex-1,level500) coloured(255,0,0) drawtext(" < 38,20",barindex-1,level618) coloured(255,0,0) drawtext(" < 23,60",barindex-1,level764) coloured(255,0,0) drawtext(" < 00,00",barindex-1,ll) coloured(255,0,0) RETURN hhLT coloured(255,0,0) STYLE(dottedline,1) as "LT HIGH", llLT coloured(0,250,0) STYLE(dottedline,1) as "LT LOW", hh STYLE(line,1), ll STYLE(line,1) as "SHT LOW"