

Same Candle Run Analysis Graph
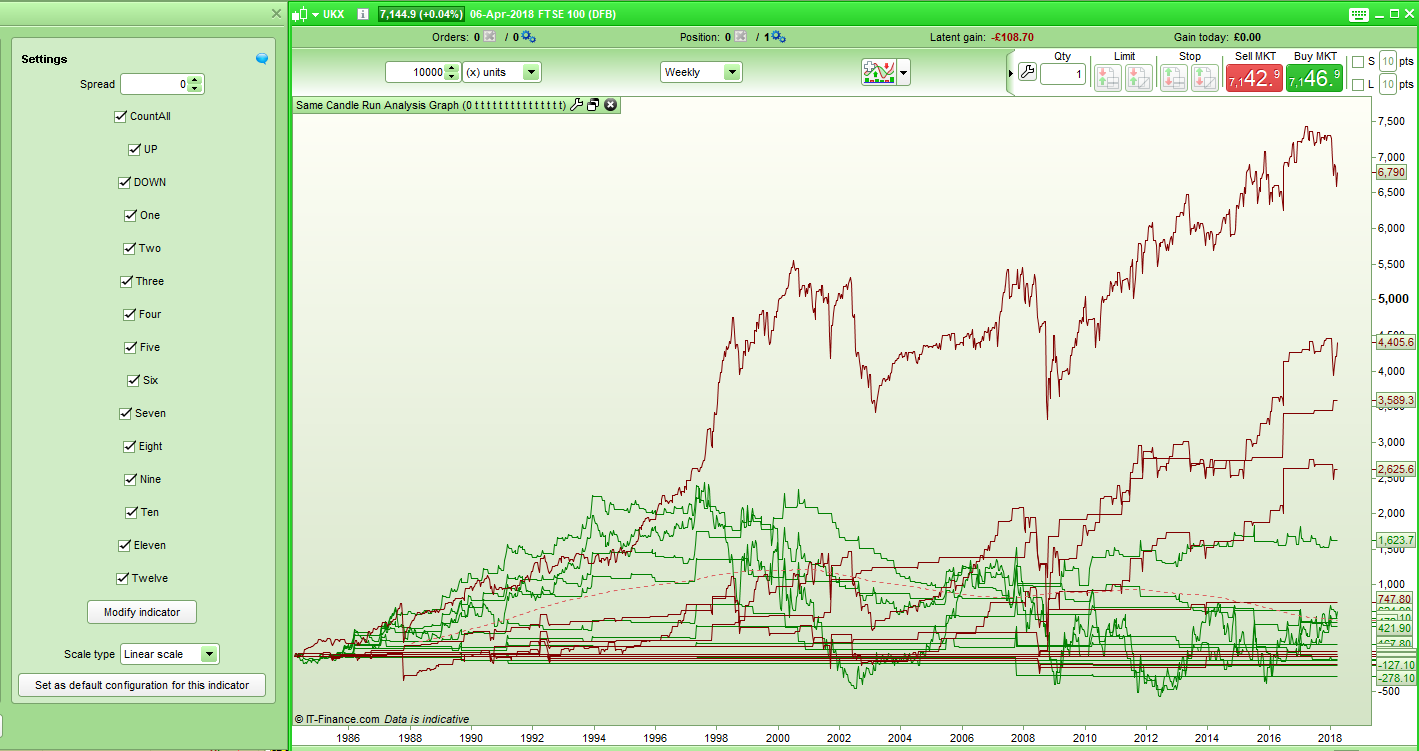
Same Candle Run Analysis Graph returns in graphical format the won/lost total amount results of my Same Candle Run Analysis Tool. The graphical format allows you to more easily see how consistent over time the results have been. It can be used to analyse runs of the same colour candle in any market and on any time frame. Runs of up to 12 candles of the same colour are analysed.
It calculates a simulated result as if you placed a long trade at the close of a run of the same coloured candles and then closed it one candle later. This can give us an idea what has the highest probability of happening next based on historical data. Although it can be used on any time frame on shorter time frames the results can be fairly meaningless due to the amount of market noise. I would advise using it on anything from yearly to 4 hour time frames.
You can select which lines to display by selecting or deselecting Up, Down, or any combination of numbers from One to Twelve. Hover over the graph to identify each line.
The setting ‘CountAll’ can be turned on and off. If ON then the results are calculated using every occurrence of a run. For example a run of three up candles is in fact three runs of one up candle, two runs of two up candles and one run of three up candles and all will be calculated in the results. If set to OFF then just the first occurrence is used – so a run of three up candles for example must be a down candle followed by three up candles.
A spread amount can also be input and is deducted from the results of each trade. Set to zero if you do not want to analyse with spread.
If you want to know what would have happened if you had gone short then obviously short trades would have resulted in the direct opposite results. So a return of +1255 for long trades would be a loss of 1255 if you had done short trades.
I recommend using this tool alongside my Same Candle Run Analysis Tool as that gives additional information such as percentage of winning trades and average return to help with better analysis.
I advise you to download the .ITF file and import it rather than cut and paste the code to ensure that you get full functionality.
IF CountAll = 1 THEN
IF Down = 1 THEN
IF Twelve = 1 THEN
IF close > Open + Spread and close[1] < open[1] and close[2] < open[2] and close[3] < open[3] and close[4] < open[4] and close[5] < open[5] and close[6] < open[6] and close[7] < open[7] and close[8] < open[8] and close[9] < open[9] and close[10] < open[10] and close[11] < open[11] and close[12] < open[12] THEN
Down12Total = Down12Total + (close - open) - Spread
ENDIF
IF close < open and close[1] < open[1] and close[2] < open[2] and close[3] < open[3] and close[4] < open[4] and close[5] < open[5] and close[6] < open[6] and close[7] < open[7] and close[8] < open[8] and close[9] < open[9] and close[10] < open[10] and close[11] < open[11] and close[12] < open[12] THEN
Down12Total = Down12Total + (close - open) - Spread
ENDIF
ENDIF

IF Eleven = 1 THEN
IF close > Open + Spread and close[1] < open[1] and close[2] < open[2] and close[3] < open[3] and close[4] < open[4] and close[5] < open[5] and close[6] < open[6] and close[7] < open[7] and close[8] < open[8] and close[9] < open[9] and close[10] < open[10] and close[11] < open[11] THEN
Down11Total = Down11Total + (close - open) - Spread
ENDIF
IF close < open and close[1] < open[1] and close[2] < open[2] and close[3] < open[3] and close[4] < open[4] and close[5] < open[5] and close[6] < open[6] and close[7] < open[7] and close[8] < open[8] and close[9] < open[9] and close[10] < open[10] and close[11] < open[11] THEN
Down11Total = Down11Total + (close - open) - Spread
ENDIF
ENDIF

IF Ten = 1 THEN
IF close > Open + Spread and close[1] < open[1] and close[2] < open[2] and close[3] < open[3] and close[4] < open[4] and close[5] < open[5] and close[6] < open[6] and close[7] < open[7] and close[8] < open[8] and close[9] < open[9] and close[10] < open[10] THEN
Down10Total = Down10Total + (close - open) - Spread
ENDIF
IF close < open and close[1] < open[1] and close[2] < open[2] and close[3] < open[3] and close[4] < open[4] and close[5] < open[5] and close[6] < open[6] and close[7] < open[7] and close[8] < open[8] and close[9] < open[9] and close[10] < open[10] THEN
Down10Total = Down10Total + (close - open) - Spread
ENDIF
ENDIF

IF Nine = 1 THEN
IF close > Open + Spread and close[1] < open[1] and close[2] < open[2] and close[3] < open[3] and close[4] < open[4] and close[5] < open[5] and close[6] < open[6] and close[7] < open[7] and close[8] < open[8] and close[9] < open[9] THEN
Down9Total = Down9Total + (close - open) - Spread
ENDIF
IF close < open and close[1] < open[1] and close[2] < open[2] and close[3] < open[3] and close[4] < open[4] and close[5] < open[5] and close[6] < open[6] and close[7] < open[7] and close[8] < open[8] and close[9] < open[9]THEN
Down9Total = Down9Total + (close - open) - Spread
ENDIF
ENDIF

IF Eight = 1 THEN
IF close > Open + Spread and close[1] < open[1] and close[2] < open[2] and close[3] < open[3] and close[4] < open[4] and close[5] < open[5] and close[6] < open[6] and close[7] < open[7] and close[8] < open[8] THEN
Down8Total = Down8Total + (close - open) - Spread
ENDIF
IF close < open and close[1] < open[1] and close[2] < open[2] and close[3] < open[3] and close[4] < open[4] and close[5] < open[5] and close[6] < open[6] and close[7] < open[7] and close[8] < open[8] THEN
Down8Total = Down8Total + (close - open) - Spread
ENDIF
ENDIF

IF Seven = 1 THEN
IF close > Open + Spread and close[1] < open[1] and close[2] < open[2] and close[3] < open[3] and close[4] < open[4] and close[5] < open[5] and close[6] < open[6] and close[7] < open[7] THEN
Down7Total = Down7Total + (close - open) - Spread
ENDIF
IF close < open and close[1] < open[1] and close[2] < open[2] and close[3] < open[3] and close[4] < open[4] and close[5] < open[5] and close[6] < open[6] and close[7] < open[7] THEN
Down7Total = Down7Total + (close - open) - Spread
ENDIF
ENDIF

IF Six = 1 THEN
IF close > Open + Spread and close[1] < open[1] and close[2] < open[2] and close[3] < open[3] and close[4] < open[4] and close[5] < open[5] and close[6] < open[6] THEN
Down6Total = Down6Total + (close - open) - Spread
ENDIF
IF close < open and close[1] < open[1] and close[2] < open[2] and close[3] < open[3] and close[4] < open[4] and close[5] < open[5] and close[6] < open[6] THEN
Down6Total = Down6Total + (close - open) - Spread
ENDIF
ENDIF

IF Five = 1 THEN
IF close > Open + Spread and close[1] < open[1] and close[2] < open[2] and close[3] < open[3] and close[4] < open[4] and close[5] < open[5] THEN
Down5Total = Down5Total + (close - open) - Spread
ENDIF
IF close < open and close[1] < open[1] and close[2] < open[2] and close[3] < open[3] and close[4] < open[4] and close[5] < open[5] THEN
Down5Total = Down5Total + (close - open) - Spread
ENDIF
ENDIF

IF Four = 1 THEN
IF close > Open + Spread and close[1] < open[1] and close[2] < open[2] and close[3] < open[3] and close[4] < open[4] THEN
Down4Total = Down4Total + (close - open) - Spread
ENDIF
IF close < open and close[1] < open[1] and close[2] < open[2] and close[3] < open[3] and close[4] < open[4] THEN
Down4Total = Down4Total + (close - open) - Spread
ENDIF
ENDIF

IF Three = 1 THEN
IF close > Open + Spread and close[1] < open[1] and close[2] < open[2] and close[3] < open[3] THEN
Down3Total = Down3Total + (close - open) - Spread
ENDIF
IF close < open and close[1] < open[1] and close[2] < open[2] and close[3] < open[3] THEN
Down3Total = Down3Total + (close - open) - Spread
ENDIF
ENDIF

IF Two = 1 THEN
IF close > Open + Spread and close[1] < open[1] and close[2] < open[2] THEN
Down2Total = Down2Total + (close - open) - Spread
ENDIF
IF close < open and close[1] < open[1] and close[2] < open[2] THEN
Down2Total = Down2Total + (close - open) - Spread
ENDIF
ENDIF

IF One = 1 THEN
IF close > Open + Spread and close[1] < open[1] THEN
Down1Total = Down1Total + (close - open) - Spread
ENDIF
IF close < open and close[1] < open[1] THEN
Down1Total = Down1Total + (close - open) - Spread
ENDIF
ENDIF
ENDIF

IF Up = 1 THEN
IF Twelve = 1 THEN
IF close > Open + Spread and close[1] > open[1] and close[2] > open[2] and close[3] > open[3] and close[4] > open[4] and close[5] > open[5] and close[6] > open[6] and close[7] > open[7] and close[8] > open[8] and close[9] > open[9] and close[10] > open[10] and close[11] > open[11] and close[12] > open[12] THEN
Up12Total = Up12Total + (close - open) - Spread
ENDIF
IF close < open and close[1] > open[1] and close[2] > open[2] and close[3] > open[3] and close[4] > open[4] and close[5] > open[5] and close[6] > open[6] and close[7] > open[7] and close[8] > open[8] and close[9] > open[9] and close[10] > open[10] and close[11] > open[11] and close[12] > open[12] THEN
Up12Total = Up12Total + (close - open) - Spread
ENDIF
ENDIF

IF Eleven = 1 THEN
IF close > Open + Spread and close[1] > open[1] and close[2] > open[2] and close[3] > open[3] and close[4] > open[4] and close[5] > open[5] and close[6] > open[6] and close[7] > open[7] and close[8] > open[8] and close[9] > open[9] and close[10] > open[10] and close[11] > open[11] THEN
Up11Total = Up11Total + (close - open) - Spread
ENDIF
IF close < open and close[1] > open[1] and close[2] > open[2] and close[3] > open[3] and close[4] > open[4] and close[5] > open[5] and close[6] > open[6] and close[7] > open[7] and close[8] > open[8] and close[9] > open[9] and close[10] > open[10] and close[11] > open[11] THEN
Up11Total = Up11Total + (close - open) - Spread
ENDIF
ENDIF

IF Ten = 1 THEN
IF close > Open + Spread and close[1] > open[1] and close[2] > open[2] and close[3] > open[3] and close[4] > open[4] and close[5] > open[5] and close[6] > open[6] and close[7] > open[7] and close[8] > open[8] and close[9] > open[9] and close[10] > open[10] THEN
Up10Total = Up10Total + (close - open) - Spread
ENDIF
IF close < open and close[1] > open[1] and close[2] > open[2] and close[3] > open[3] and close[4] > open[4] and close[5] > open[5] and close[6] > open[6] and close[7] > open[7] and close[8] > open[8] and close[9] > open[9] and close[10] > open[10] THEN
Up10Total = Up10Total + (close - open) - Spread
ENDIF
ENDIF

IF Nine = 1 THEN
IF close > Open + Spread and close[1] > open[1] and close[2] > open[2] and close[3] > open[3] and close[4] > open[4] and close[5] > open[5] and close[6] > open[6] and close[7] > open[7] and close[8] > open[8] and close[9] > open[9] THEN
Up9Total = Up9Total + (close - open) - Spread
ENDIF
IF close < open and close[1] > open[1] and close[2] > open[2] and close[3] > open[3] and close[4] > open[4] and close[5] > open[5] and close[6] > open[6] and close[7] > open[7] and close[8] > open[8] and close[9] > open[9] THEN
Up9Total = Up9Total + (close - open) - Spread
ENDIF
ENDIF

IF Eight = 1 THEN
IF close > Open + Spread and close[1] > open[1] and close[2] > open[2] and close[3] > open[3] and close[4] > open[4] and close[5] > open[5] and close[6] > open[6] and close[7] > open[7] and close[8] > open[8] THEN
Up8Total = Up8Total + (close - open) - Spread
ENDIF
IF close < open and close[1] > open[1] and close[2] > open[2] and close[3] > open[3] and close[4] > open[4] and close[5] > open[5] and close[6] > open[6] and close[7] > open[7] and close[8] > open[8] THEN
Up8Total = Up8Total + (close - open) - Spread
ENDIF
ENDIF

IF Seven = 1 THEN
IF close > Open + Spread and close[1] > open[1] and close[2] > open[2] and close[3] > open[3] and close[4] > open[4] and close[5] > open[5] and close[6] > open[6] and close[7] > open[7] THEN
Up7Total = Up7Total + (close - open) - Spread
ENDIF
IF close < open and close[1] > open[1] and close[2] > open[2] and close[3] > open[3] and close[4] > open[4] and close[5] > open[5] and close[6] > open[6] and close[7] > open[7] THEN
Up7Total = Up7Total + (close - open) - Spread
ENDIF
ENDIF

IF Six = 1 THEN
IF close > Open + Spread and close[1] > open[1] and close[2] > open[2] and close[3] > open[3] and close[4] > open[4] and close[5] > open[5] and close[6] > open[6] THEN
Up6Total = Up6Total + (close - open) - Spread
ENDIF
IF close < open and close[1] > open[1] and close[2] > open[2] and close[3] > open[3] and close[4] > open[4] and close[5] > open[5] and close[6] > open[6] THEN
Up6Total = Up6Total + (close - open) - Spread
ENDIF
ENDIF

IF Five = 1 THEN
IF close > Open + Spread and close[1] > open[1] and close[2] > open[2] and close[3] > open[3] and close[4] > open[4] and close[5] > open[5] THEN
Up5Total = Up5Total + (close - open) - Spread
ENDIF
IF close < open and close[1] > open[1] and close[2] > open[2] and close[3] > open[3] and close[4] > open[4] and close[5] > open[5] THEN
Up5Total = Up5Total + (close - open) - Spread
ENDIF
ENDIF

IF Four = 1 THEN
IF close > Open + Spread and close[1] > open[1] and close[2] > open[2] and close[3] > open[3] and close[4] > open[4] THEN
Up4Total = Up4Total + (close - open) - Spread
ENDIF
IF close < open and close[1] > open[1] and close[2] > open[2] and close[3] > open[3] and close[4] > open[4] THEN
Up4Total = Up4Total + (close - open) - Spread
ENDIF
ENDIF

IF Three = 1 THEN
IF close > Open + Spread and close[1] > open[1] and close[2] > open[2] and close[3] > open[3] THEN
Up3Total = Up3Total + (close - open) - Spread
ENDIF
IF close < open and close[1] > open[1] and close[2] > open[2] and close[3] > open[3] THEN
Up3Total = Up3Total + (close - open) - Spread
ENDIF
ENDIF

IF Two = 1 THEN
IF close > Open + Spread and close[1] > open[1] and close[2] > open[2] THEN
Up2Total = Up2Total + (close - open) - Spread
ENDIF
IF close < open and close[1] > open[1] and close[2] > open[2] THEN
Up2Total = Up2Total + (close - open) - Spread
ENDIF
ENDIF

IF One = 1 THEN
IF close > Open + Spread and close[1] > open[1] THEN
Up1Total = Up1Total + (close - open) - Spread
ENDIF
IF close < open and close[1] > open[1] THEN
Up1Total = Up1Total + (close - open) - Spread
ENDIF
ENDIF
ENDIF
ENDIF


IF CountAll <> 1 THEN
IF Down = 1 THEN
IF Twelve =1 THEN
IF close > Open + Spread and close[1] < open[1] and close[2] < open[2] and close[3] < open[3] and close[4] < open[4] and close[5] < open[5] and close[6] < open[6] and close[7] < open[7] and close[8] < open[8] and close[9] < open[9] and close[10] < open[10] and close[11] < open[11] and close[12] < open[12] and close[13] > open[13] THEN
Down12Total = Down12Total + (close - open) - Spread
ENDIF
IF close < open and close[1] < open[1] and close[2] < open[2] and close[3] < open[3] and close[4] < open[4] and close[5] < open[5] and close[6] < open[6] and close[7] < open[7] and close[8] < open[8] and close[9] < open[9] and close[10] < open[10] and close[11] < open[11] and close[12] < open[12] and close[13] > open[13] THEN
Down12Total = Down12Total + (close - open) - Spread
ENDIF
ENDIF

IF Eleven = 1 THEN
IF close > Open + Spread and close[1] < open[1] and close[2] < open[2] and close[3] < open[3] and close[4] < open[4] and close[5] < open[5] and close[6] < open[6] and close[7] < open[7] and close[8] < open[8] and close[9] < open[9] and close[10] < open[10] and close[11] < open[11] and close[12] > open[12] THEN
Down11Total = Down11Total + (close - open) - Spread
ENDIF
IF close < open and close[1] < open[1] and close[2] < open[2] and close[3] < open[3] and close[4] < open[4] and close[5] < open[5] and close[6] < open[6] and close[7] < open[7] and close[8] < open[8] and close[9] < open[9] and close[10] < open[10] and close[11] < open[11] and close[12] > open[12] THEN
Down11Total = Down11Total + (close - open) - Spread
ENDIF
ENDIF

IF Ten = 1 THEN
IF close > Open + Spread and close[1] < open[1] and close[2] < open[2] and close[3] < open[3] and close[4] < open[4] and close[5] < open[5] and close[6] < open[6] and close[7] < open[7] and close[8] < open[8] and close[9] < open[9] and close[10] < open[10] and close[11] > open[11]  THEN
Down10Total = Down10Total + (close - open) - Spread
ENDIF
IF close < open and close[1] < open[1] and close[2] < open[2] and close[3] < open[3] and close[4] < open[4] and close[5] < open[5] and close[6] < open[6] and close[7] < open[7] and close[8] < open[8] and close[9] < open[9] and close[10] < open[10] and close[11] > open[11] THEN
Down10Total = Down10Total + (close - open) - Spread
ENDIF
ENDIF

IF Nine = 1 THEN
IF close > Open + Spread and close[1] < open[1] and close[2] < open[2] and close[3] < open[3] and close[4] < open[4] and close[5] < open[5] and close[6] < open[6] and close[7] < open[7] and close[8] < open[8] and close[9] < open[9] and close[10] > open[10] THEN
Down9Total = Down9Total + (close - open) - Spread
ENDIF
IF close < open and close[1] < open[1] and close[2] < open[2] and close[3] < open[3] and close[4] < open[4] and close[5] < open[5] and close[6] < open[6] and close[7] < open[7] and close[8] < open[8] and close[9] < open[9] and close[10] > open[10] THEN
Down9Total = Down9Total + (close - open) - Spread
ENDIF
ENDIF

IF Eight = 1 THEN
IF close > Open + Spread and close[1] < open[1] and close[2] < open[2] and close[3] < open[3] and close[4] < open[4] and close[5] < open[5] and close[6] < open[6] and close[7] < open[7] and close[8] < open[8] and close[9] > open[9] THEN
Down8Total = Down8Total + (close - open) - Spread
ENDIF
IF close < open and close[1] < open[1] and close[2] < open[2] and close[3] < open[3] and close[4] < open[4] and close[5] < open[5] and close[6] < open[6] and close[7] < open[7] and close[8] < open[8] and close[9] > open[9] THEN
Down8Total = Down8Total + (close - open) - Spread
ENDIF
ENDIF

IF Seven = 1 THEN
IF close > Open + Spread and close[1] < open[1] and close[2] < open[2] and close[3] < open[3] and close[4] < open[4] and close[5] < open[5] and close[6] < open[6] and close[7] < open[7] and close[8] > open[8] THEN
Down7Total = Down7Total + (close - open) - Spread
ENDIF
IF close < open and close[1] < open[1] and close[2] < open[2] and close[3] < open[3] and close[4] < open[4] and close[5] < open[5] and close[6] < open[6] and close[7] < open[7] and close[8] > open[8] THEN
Down7Total = Down7Total + (close - open) - Spread
ENDIF
ENDIF

IF Six = 1 THEN
IF close > Open + Spread and close[1] < open[1] and close[2] < open[2] and close[3] < open[3] and close[4] < open[4] and close[5] < open[5] and close[6] < open[6] and close[7] > open[7] THEN
Down6Total = Down6Total + (close - open) - Spread
ENDIF
IF close < open and close[1] < open[1] and close[2] < open[2] and close[3] < open[3] and close[4] < open[4] and close[5] < open[5] and close[6] < open[6] and close[7] > open[7] THEN
Down6Total = Down6Total + (close - open) - Spread
ENDIF
ENDIF

IF Five = 1 THEN
IF close > Open + Spread and close[1] < open[1] and close[2] < open[2] and close[3] < open[3] and close[4] < open[4] and close[5] < open[5] and close[6] > open[6] THEN
Down5Total = Down5Total + (close - open) - Spread
ENDIF
IF close < open and close[1] < open[1] and close[2] < open[2] and close[3] < open[3] and close[4] < open[4] and close[5] < open[5] and close[6] > open[6] THEN
Down5Total = Down5Total + (close - open) - Spread
ENDIF
ENDIF

IF Four = 1 THEN
IF close > Open + Spread and close[1] < open[1] and close[2] < open[2] and close[3] < open[3] and close[4] < open[4] and close[5] > open[5] THEN
Down4Total = Down4Total + (close - open) - Spread
ENDIF
IF close < open and close[1] < open[1] and close[2] < open[2] and close[3] < open[3] and close[4] < open[4] and close[5] > open[5] THEN
Down4Total = Down4Total + (close - open) - Spread
ENDIF
ENDIF

IF Three = 1 THEN
IF close > Open + Spread and close[1] < open[1] and close[2] < open[2] and close[3] < open[3] and close[4] > open[4] THEN
Down3Total = Down3Total + (close - open) - Spread
ENDIF
IF close < open and close[1] < open[1] and close[2] < open[2] and close[3] < open[3] and close[4] > open[4] THEN
Down3Total = Down3Total + (close - open) - Spread
ENDIF
ENDIF

IF Two = 1 THEN
IF close > Open + Spread and close[1] < open[1] and close[2] < open[2] and close[3] > open[3] THEN
Down2Total = Down2Total + (close - open) - Spread
ENDIF
IF close < open and close[1] < open[1] and close[2] < open[2] and close[3] > open[3] THEN
Down2Total = Down2Total + (close - open) - Spread
ENDIF
ENDIF

IF One = 1 THEN
IF close > Open + Spread and close[1] < open[1] and close[2] > open[2] THEN
Down1Total = Down1Total + (close - open) - Spread
ENDIF
IF close < open and close[1] < open[1] and close[2] > open[2] THEN
Down1Total = Down1Total + (close - open) - Spread
ENDIF
ENDIF
ENDIF

IF Up = 1 THEN
IF Twelve = 1 THEN
IF close > Open + Spread and close[1] > open[1] and close[2] > open[2] and close[3] > open[3] and close[4] > open[4] and close[5] > open[5] and close[6] > open[6] and close[7] > open[7] and close[8] > open[8] and close[9] > open[9] and close[10] > open[10] and close[11] > open[11] and close[12] > open[12] and close[13] < open[13] THEN
Up12Total = Up12Total + (close - open) - Spread
ENDIF
IF close < open and close[1] > open[1] and close[2] > open[2] and close[3] > open[3] and close[4] > open[4] and close[5] > open[5] and close[6] > open[6] and close[7] > open[7] and close[8] > open[8] and close[9] > open[9] and close[10] > open[10] and close[11] > open[11] and close[12] > open[12] and close[13] < open[13] THEN
Up12Total = Up12Total + (close - open) - Spread
ENDIF
ENDIF

IF Eleven = 1 THEN
IF close > Open + Spread and close[1] > open[1] and close[2] > open[2] and close[3] > open[3] and close[4] > open[4] and close[5] > open[5] and close[6] > open[6] and close[7] > open[7] and close[8] > open[8] and close[9] > open[9] and close[10] > open[10] and close[11] > open[11] and close[12] < open[12] THEN
Up11Total = Up11Total + (close - open) - Spread
ENDIF
IF close < open and close[1] > open[1] and close[2] > open[2] and close[3] > open[3] and close[4] > open[4] and close[5] > open[5] and close[6] > open[6] and close[7] > open[7] and close[8] > open[8] and close[9] > open[9] and close[10] > open[10] and close[11] > open[11] and close[12] < open[12] THEN
Up11Total = Up11Total + (close - open) - Spread
ENDIF
ENDIF

IF Ten = 1 THEN
IF close > Open + Spread and close[1] > open[1] and close[2] > open[2] and close[3] > open[3] and close[4] > open[4] and close[5] > open[5] and close[6] > open[6] and close[7] > open[7] and close[8] > open[8] and close[9] > open[9] and close[10] > open[10] and close[11] < open[11] THEN
Up10Total = Up10Total + (close - open) - Spread
ENDIF
IF close < open and close[1] > open[1] and close[2] > open[2] and close[3] > open[3] and close[4] > open[4] and close[5] > open[5] and close[6] > open[6] and close[7] > open[7] and close[8] > open[8] and close[9] > open[9] and close[10] > open[10] and close[11] < open[11] THEN
Up10Total = Up10Total + (close - open) - Spread
ENDIF
ENDIF

IF Nine = 1 THEN
IF close > Open + Spread and close[1] > open[1] and close[2] > open[2] and close[3] > open[3] and close[4] > open[4] and close[5] > open[5] and close[6] > open[6] and close[7] > open[7] and close[8] > open[8] and close[9] > open[9] and close[10] < open[10] THEN
Up9Total = Up9Total + (close - open) - Spread
ENDIF
IF close < open and close[1] > open[1] and close[2] > open[2] and close[3] > open[3] and close[4] > open[4] and close[5] > open[5] and close[6] > open[6] and close[7] > open[7] and close[8] > open[8] and close[9] > open[9] and close[10] < open[10] THEN
Up9Total = Up9Total + (close - open) - Spread
ENDIF
ENDIF

IF Eight = 1 THEN
IF close > Open + Spread and close[1] > open[1] and close[2] > open[2] and close[3] > open[3] and close[4] > open[4] and close[5] > open[5] and close[6] > open[6] and close[7] > open[7] and close[8] > open[8] and close[9] < open[9] THEN
Up8Total = Up8Total + (close - open) - Spread
ENDIF
IF close < open and close[1] > open[1] and close[2] > open[2] and close[3] > open[3] and close[4] > open[4] and close[5] > open[5] and close[6] > open[6] and close[7] > open[7] and close[8] > open[8] and close[9] < open[9] THEN
Up8Total = Up8Total + (close - open) - Spread
ENDIF
ENDIF

IF Seven = 1 THEN
IF close > Open + Spread and close[1] > open[1] and close[2] > open[2] and close[3] > open[3] and close[4] > open[4] and close[5] > open[5] and close[6] > open[6] and close[7] > open[7] and close[8] < open[8] THEN
Up7Total = Up7Total + (close - open) - Spread
ENDIF
IF close < open and close[1] > open[1] and close[2] > open[2] and close[3] > open[3] and close[4] > open[4] and close[5] > open[5] and close[6] > open[6] and close[7] > open[7] and close[8] < open[8] THEN
Up7Total = Up7Total + (close - open) - Spread
ENDIF
ENDIF

IF Six = 1 THEN
IF close > Open + Spread and close[1] > open[1] and close[2] > open[2] and close[3] > open[3] and close[4] > open[4] and close[5] > open[5] and close[6] > open[6] and close[7] < open[7] THEN
Up6Total = Up6Total + (close - open) - Spread
ENDIF
IF close < open and close[1] > open[1] and close[2] > open[2] and close[3] > open[3] and close[4] > open[4] and close[5] > open[5] and close[6] > open[6] and close[7] < open[7] THEN
Up6Total = Up6Total + (close - open) - Spread
ENDIF
ENDIF

IF Five = 1 THEN
IF close > Open + Spread and close[1] > open[1] and close[2] > open[2] and close[3] > open[3] and close[4] > open[4] and close[5] > open[5] and close[6] < open[6] THEN
Up5Total = Up5Total + (close - open) - Spread
ENDIF
IF close < open and close[1] > open[1] and close[2] > open[2] and close[3] > open[3] and close[4] > open[4] and close[5] > open[5] and close[6] < open[6] THEN
Up5Total = Up5Total + (close - open) - Spread
ENDIF
ENDIF

IF Four = 1 THEN
IF close > Open + Spread and close[1] > open[1] and close[2] > open[2] and close[3] > open[3] and close[4] > open[4] and close[5] < open[5] THEN
Up4Total = Up4Total + (close - open) - Spread
ENDIF
IF close < open and close[1] > open[1] and close[2] > open[2] and close[3] > open[3] and close[4] > open[4] and close[5] < open[5] THEN
Up4Total = Up4Total + (close - open) - Spread
ENDIF
ENDIF

IF Three = 1 THEN
IF close > Open + Spread and close[1] > open[1] and close[2] > open[2] and close[3] > open[3] and close[4] < open[4] THEN
Up3Total = Up3Total + (close - open) - Spread
ENDIF
IF close < open and close[1] > open[1] and close[2] > open[2] and close[3] > open[3] and close[4] < open[4] THEN
Up3Total = Up3Total + (close - open) - Spread
ENDIF
ENDIF

IF Two = 1 THEN
IF close > Open + Spread and close[1] > open[1] and close[2] > open[2] and close[3] < open[3] THEN
Up2Total = Up2Total + (close - open) - Spread
ENDIF
IF close < open and close[1] > open[1] and close[2] > open[2] and close[3] < open[3]THEN
Up2Total = Up2Total + (close - open) - Spread
ENDIF
ENDIF

IF One = 1 THEN
IF close > Open + Spread and close[1] > open[1] and close[2] < open[2] THEN
Up1Total = Up1Total + (close - open) - Spread
ENDIF
IF close < open and close[1] > open[1] and close[2] < open[2] THEN
Up1Total = Up1Total + (close - open) - Spread
ENDIF
ENDIF
ENDIF
ENDIF

Return Up12Total Coloured(0,128,0) as "12 Up Total" ,Up11Total Coloured(0,128,0) as "11 Up Total",Up10Total Coloured(0,128,0) as "10 Up Total", Up9Total Coloured(0,128,0) as "9 Up Total", Up8Total Coloured(0,128,0) as "8 Up Total", Up7Total Coloured(0,128,0) as "7 Up Total", Up6Total Coloured(0,128,0) as "6 Up Total", Up5Total Coloured(0,128,0) as "5 Up Total", Up4Total Coloured(0,128,0) as "4 Up Total", Up3Total Coloured(0,128,0) as "3 Up Total", Up2Total Coloured(0,128,0) as "2 Up Total", Up1Total Coloured(0,128,0) as "1 Up Total", Down12Total Coloured(128,0,0) as "12 Down Total", Down11Total Coloured(128,0,0) as "11 Down Total", Down10Total Coloured(128,0,0) as "10 Down Total", Down9Total Coloured(128,0,0) as "9 Down Total", Down8Total Coloured(128,0,0) as "8 Down Total", Down7Total Coloured(128,0,0) as "7 Down Total", Down6Total Coloured(128,0,0) as "6 Down Total", Down5Total Coloured(128,0,0) as "5 Down Total", Down4Total Coloured(128,0,0) as "4 Down Total", Down3Total Coloured(128,0,0) as "3 Down Total", Down2Total Coloured(128,0,0) as "2 Down Total", Down1Total Coloured(128,0,0) as "1 Down Total"