

OnChart Kase Peak 2 Coloured
September 10, 2018, 10:58 AM
Indicators
4 Comments
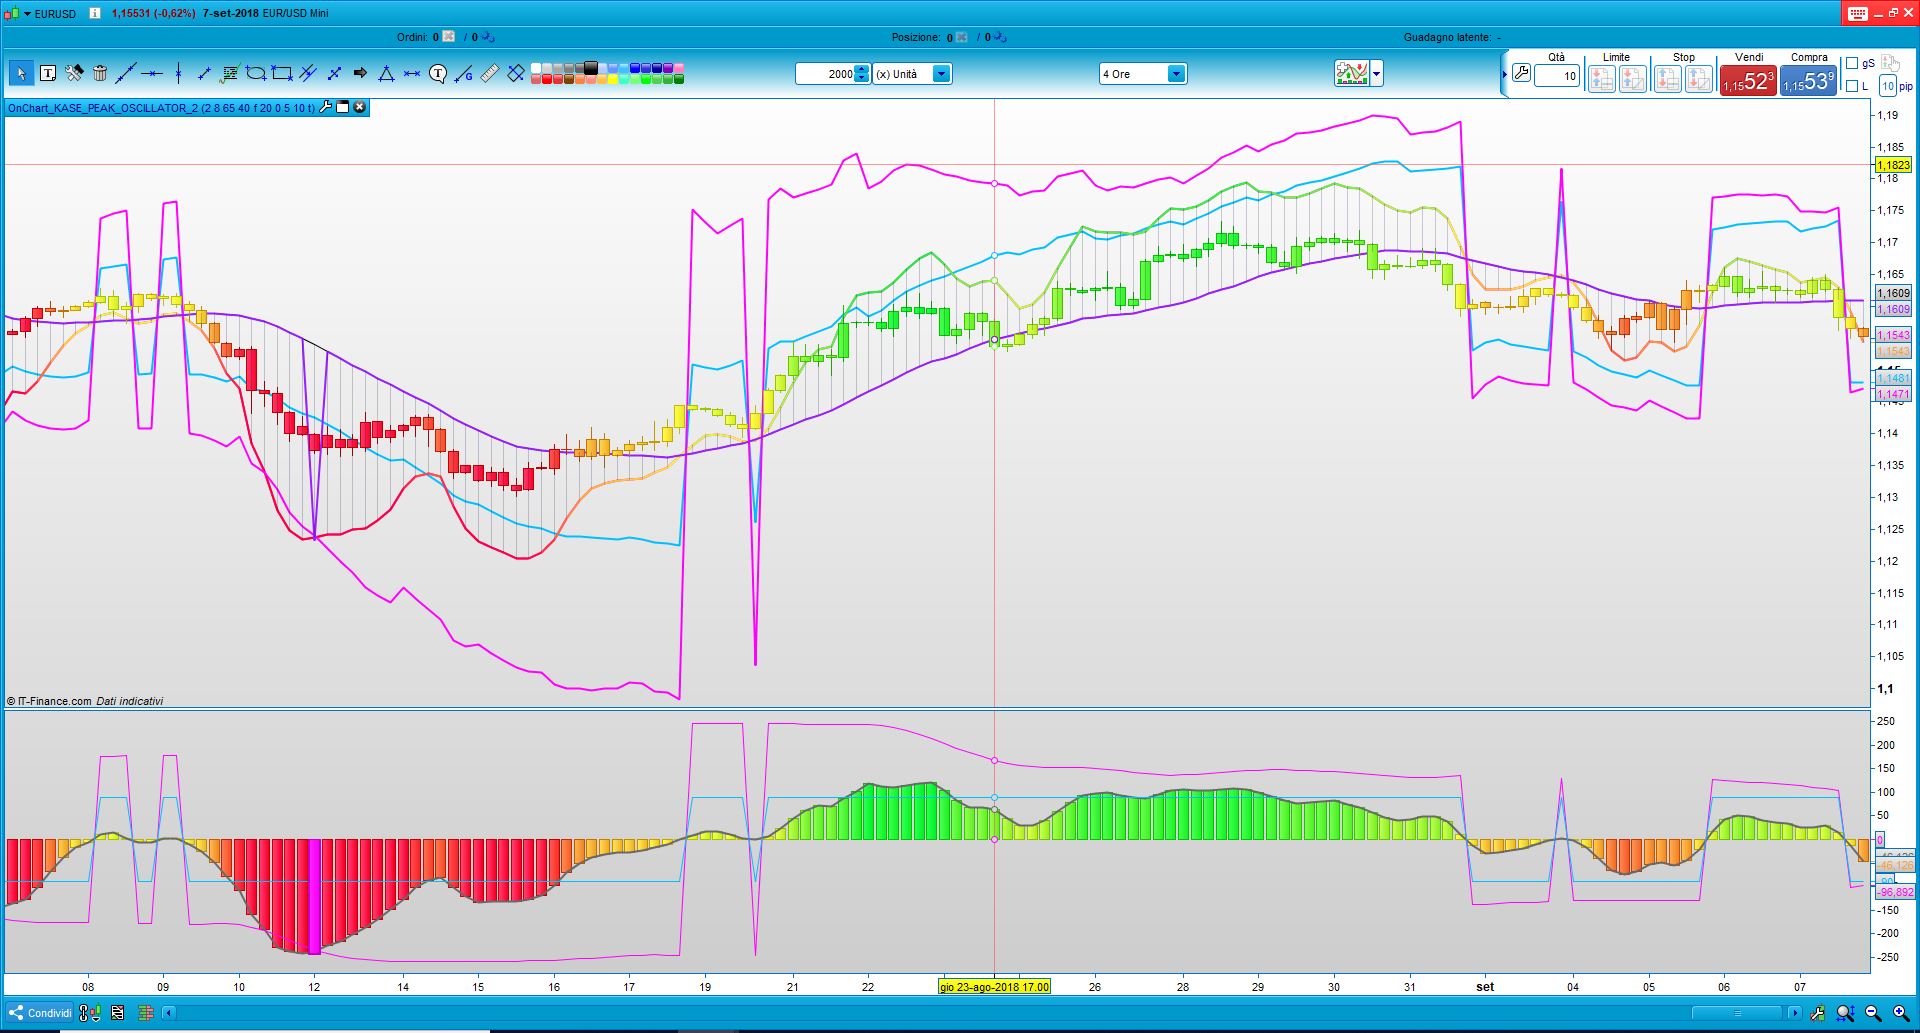
The “onChart Kase_Peak_2_Coloured” indicator plots Kase Peak 2 Oscillator directly overlaid on the price chart, and candlestiks colours allows to interpret the values of KPH that could be plot or not like histogram (grey segment) on chart.
The Moving average of 20 periods is the center of the oscillator like zero level.
To maintain a correct range dimensions of the oscillator, I’ve suggest the following setting:
Time Frame 1 D – Setting ATRperiod=20
Time Frame 4 H – Setting ATRperiod=10
Time Frame 1 H – Setting ATRperiod=4
Time Frame 30 m – Setting ATRperiod=2
Time Frame 15 m – Setting ATRperiod=2
Time Frame 5 m – Setting ATRperiod=2
Time Frame 1 m – Setting ATRperiod=1
//PRC_OnChart Kase Peak 2 Coloured | indicator
//08.09.2018
//Ale @ www.prorealcode.com
//Sharing ProRealTime knowledge
//WWW.AUTOMATICTRADING.IT

DEFPARAM CALCULATEONLASTBARS=1000
///////////////////////INDICATOR_KASE PEAK2
maPrice = customclose
// --- settings
kpoDeviations  = 2.0 // Kase peak oscillator deviations
kpoShortCycle  = 8   // Kase peak oscillator short cycle
kpoLongCycle   = 65  // Kase peak oscillator long cycle
kpoSensitivity = 40
allPeaksMode = 1 //1=true ; 0=false
AveragePeriod=20
AverageMethod=1
TightenChannel=5
ATRperiod=20
// --- end of settings

if barindex>kpoLongCycle*2 then
 ccLog = Log(Close[0]/Close[1])
 ccDev = std[9](ccLog)

 avg = average[30](ccDev)

 if (avg>0) then
  max1 = 0
  maxs = 0

  for k = kpoShortCycle to kpoLongCycle-1 do
   max1 = Max(Log(High[0]/Low[0+k])/Sqrt(k),max1)
   maxs = Max(Log(High[0+k]/Low[0])/Sqrt(k),maxs)
  next
  x1 = max1/avg
  xs = maxs/avg
 endif

 xp    = kpoSensitivity*(average[3](x1)-average[3](xs))
 xpAbs = Abs(xp)

 kpoBuffer   = xp
 kphBuffer   = xp

 tmpVal = average[50](xpAbs)+kpoDeviations*std[50](xpAbs)
 maxVal = Max(90.0,tmpVal)
 minVal = Min(90.0,tmpVal)

 if (kpoBuffer > 0) then
  kpdBuffer =  maxVal
  kpmBuffer =  minVal
 else
  kpdBuffer = -maxVal
  kpmBuffer = -minVal
 endif

 kppbuffer=0
 if (not allPeaksMode) then
  if (kpoBuffer[1]>0 and kpoBuffer[1]>kpoBuffer[0] and kpoBuffer[1]>=kpoBuffer[2] and kpoBuffer[1]>= maxVal) then
   kppBuffer = kpoBuffer[1]
  endif
  if (kpoBuffer[1]<0 and kpoBuffer[1]<kpoBuffer[0] and kpoBuffer[1]<=kpoBuffer[2] and kpoBuffer[1]<=-maxVal) then
   kppBuffer = kpoBuffer[1]
  endif
 else
  if (kpoBuffer[1]>0 and kpoBuffer[1]>kpoBuffer[0] and kpoBuffer[1]>=kpoBuffer[2]) then
   kppBuffer = kpoBuffer[1]
  endif
  if (kpoBuffer[1]<0 and kpoBuffer[1]<kpoBuffer[0] and kpoBuffer[1]<=kpoBuffer[2]) then
   kppBuffer = kpoBuffer[1]
  endif
 endif
endif

///////////////////////////////////////////////////

dTR = 0
for i = 0to ATRperiod-1
 dTR=dTR+max(abs(Dhigh(i)-Dlow(i)),max(abs(Dhigh(i)-Dclose(i+1)),abs(Dlow(i)-Dclose(i+1))))
next
dtr=dtr/MAX(1,TightenChannel)
avgRange = dTR

maValue = average[max(1,AveragePeriod),AverageMethod](maPrice)
KPMValue=kpMBuffer
KPOValue=kpoBuffer
KPHValue=kphBuffer
KPDValue=kpdBuffer
KPPValue=kppBuffer
Buffer1=maValue
Buffer4=maValue+(KPMValue)/100*avgRange
buffer5=maValue+(KPOValue)/100*avgRange
buffer6=maValue+(KPHValue)/100*avgRange
buffer7=maValue+(KPDValue)/100*avgRange
buffer8=maValue+(KPPValue)/100*avgRange

r = 50+(100-(KPHBUFFER))*2
g = 50+(100+(KPHBUFFER))*2
DRAWCANDLE(open, high, low, close)coloured(R,G,50)
IF not ViewHistogram then
 buffer6=mavalue
 buffer5=mavalue
endif

DRAWCANDLE(open, high, low, close)coloured(R,G,50)
DRAWSEGMENT(barindex, maValue, barindex,buffer6)coloured(0,0,50,50)

return Buffer1 coloured(0,0,0) style(line,1) as "0 level", Buffer4 coloured(0,191,255) style(LINE,2) as "KPM",Buffer5 coloured(255,0,255) style(LINE,2) as "KPO",Buffer6 coloured(R,G,50) style(LINE,2) as "KPH",Buffer7 coloured(255,0,255) style(LINE,2) as "KPD",Buffer8 coloured(155,30,255) style(LINE,2) as "KPP"
Download
Filename:
OnChart_KASE_PEAK_OSCILLATOR_2-1.itf
Downloads:
269
Master
My name is Alessandro, i'm a trader since 2006
You can find me on my website: <a href="http://www.automatictrading.it/" rel="dofollow">www.automatictrading.it</a>
<strong>(trading programming services Italy)</strong>
Italy
Author’s Profile
Loading...