

Price Rating and Distribution
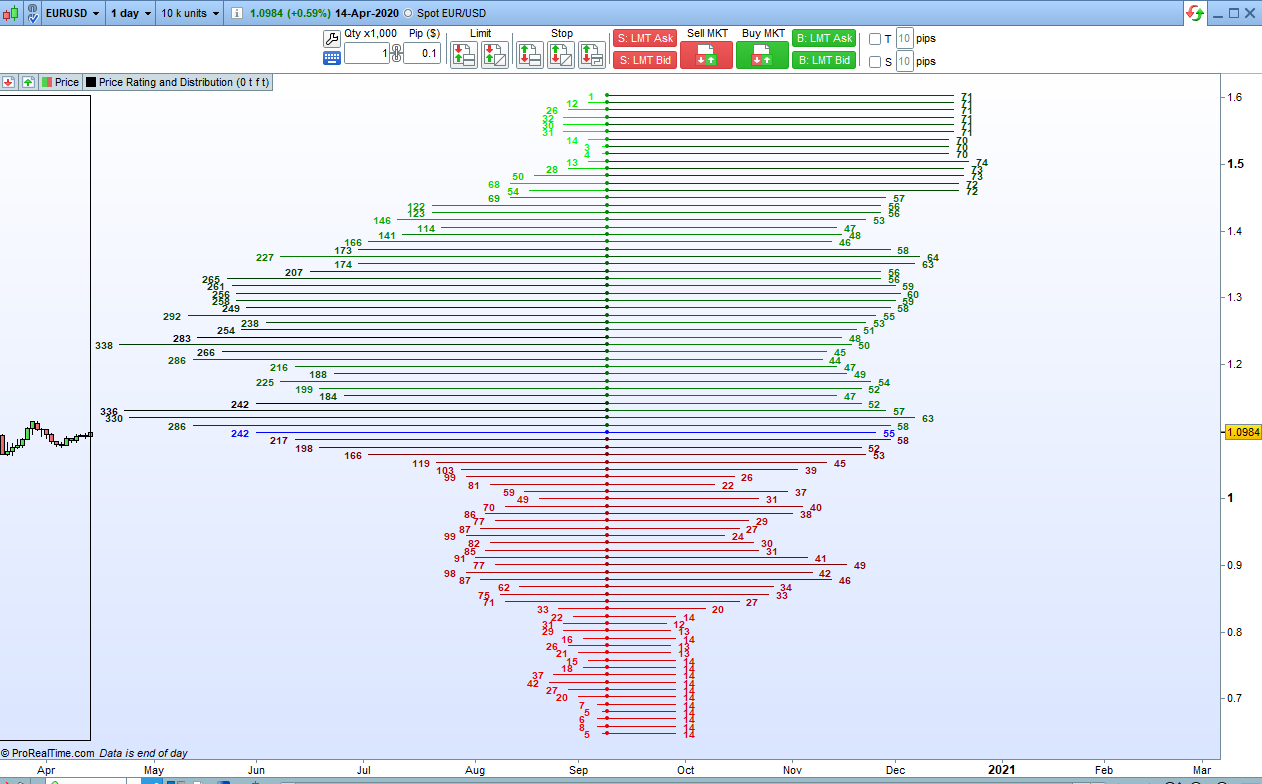
This indicator will analyse historical prices over any look back period and display the results as both a distribution chart and a price rating chart side by side.
This indicator only works on PRTv11 onwards
Apply the indicator to your price chart.
Set the number of bars back that you want to analyse with the ‘Length’ setting. If you set this to zero then the indicator analyses all available data. It can take a few moments to analyse all the data if there is lots of it so there is sometimes a short wait when the indicator is first loaded if you have set ‘Length’ very high or set it to analyse all the data.
The data being tested is checked at intervals of 1% above and 1% below and the number of candles that crossed each price level is totalled up and its location in history of that crossing taken into consideration.
To the left of the dots is the distribution chart. This shows how many bars crossed each price level. The quantity is shown at the far left of each bar.
To the right of the dots is the price levels rating chart. Each price level can score between 0 and 100. This rating is higher if price recently crossed this price and higher if it has crossed it a lot of times. So a price level cross a very long time ago is given less weight in the calculation than one yesterday. The score is shown to the right of the bars.
The blue line is the current price level. You can set ‘CustomClose’ to whatever price type you like – Close, Median Price, High, Low etc
The colour of the lines can be adjusted by switching on ‘HeatMap’ which causes higher scoring price levels and price levels that have been crossed a lot to be shown as darker colours. You can also switch on and off ‘Fade’ which fades out lower scoring lines and lines that have not been crossed very much.
The ‘DataBox’ option allows you to display a box around the data that has been used in the analysis.
As always I advise downloading and importing to get full functionality.
//Price Rating and Distribution
//PRTv11
//By Vonasi
//Date: 20200415

if islastbarupdate then
length = max(length,0)
length = min(barindex,length)
if length = 0 then
length = barindex
endif

price = customclose
hh = highest[length](high)
ll = lowest[length](low)
maxperc = ((hh-price)/price)*100
minperc = ((price-ll)/price)*100

maxcount = 0
for b = 0 to MaxPerc
count = 0
for a = 0 to length-1
if (high[a] > price*(1+(b/100)) and low[a] < price*(1+(b/100))) then
count = count + 1
endif
next
maxcount = max(maxcount,count)
next

for b = 1 to MinPerc
count = 0
for a = 0 to length-1
if (high[a] > price*(1-(b/100)) and low[a] < price*(1-(b/100))) then
count = count + 1
endif
next
maxcount = max(maxcount,count)
next

for b = 0 to MaxPerc
score = 0
count = 0
for a = 0 to length-1
if high[a] > price*(1+(b/100)) and low[a] < price*(1+(b/100)) then
score = score + (((length-a)/length)*100)
count = count + 1
endif
next
result = round(score/count)
gcount = 128
rcount = 0
gresult = 128
rresult = 0
bl = 0
if heatmap then
gcount = 255-(255 *(qtyperc/100))
rcount = 0
gresult = 255-(255 *(result/100))
rresult = 0
bl = 0
endif
if b = 0 then
rcount = 0
gcount = 0
rresult = 0
gresult = 0
bl = 255
endif
qtyperc = (count/maxcount)*100
con1 = 255
con2 = 255
if fade then
con1 = con1*(qtyperc/100)
con2 = con2*(result/100)
endif
drawsegment(barindex+3+103,price*(1+(b/100)),barindex+3-qtyperc+103,price*(1+(b/100)))coloured(rcount,gcount,bl,con1)
drawtext("#result#",barindex+6+result+103,price*(1+(b/100)),sansserif,bold,10)coloured(rresult,gresult,bl)//(rresult,gresult,bl)
drawtext("#count#",barindex+0-qtyperc+103,price*(1+(b/100)),sansserif,bold,10)coloured(rcount,gcount,bl)//(rcount,gcount,bl)
drawsegment(barindex+3+103,price*(1+(b/100)),barindex+3+result+103,price*(1+(b/100)))coloured(rresult,gresult,bl,con2)
drawpoint(barindex+3+103,price*(1+(b/100)),1)coloured((rresult+rcount)/2,(gresult+gcount)/2,bl,255)

next

for b = 1 to MinPerc
score = 0
count = 0
for a = 0 to length-1
if high[a] > price*(1-(b/100)) and low[a] < price*(1-(b/100)) then
score = score + (((length-a)/length)*100)
count = count + 1
endif
next
result = round(score/count)
qtyperc = (count/maxcount)*100
rcount = 128
gcount = 0
rresult = 128
gresult = 0
bl = 0
if heatmap then
rcount = 255-(255 *(qtyperc/100))
gcount = 0
rresult = 255-(255 *(result/100))
gresult = 0
endif
con1 = 255
con2 = 255
if fade then
con1 = con1*(qtyperc/100)
con2 = con2*(result/100)
endif
drawsegment(barindex+3+103,price*(1-(b/100)),barindex+3-qtyperc+103,price*(1-(b/100)))coloured(rcount,gcount,bl,con1)
drawtext("#result#",barindex+6+result+103,price*(1-(b/100)),sansserif,bold,10)coloured(rresult,gresult,bl)//(rresult,gresult,0)
drawtext("#count#",barindex+0-qtyperc+103,price*(1-(b/100)),sansserif,bold,10)coloured(rcount,gcount,bl)//(rcount,gcount,0)
drawsegment(barindex+3+103,price*(1-(b/100)),barindex+3+result+103,price*(1-(b/100)))coloured(rresult,gresult,bl,con2)
drawpoint(barindex+3+103,price*(1-(b/100)),1)coloured((rresult+rcount)/2,(gresult+gcount)/2,0)
next

if databox then
drawrectangle(barindex,hh,barindex-length+1,ll)
endif
endif

return