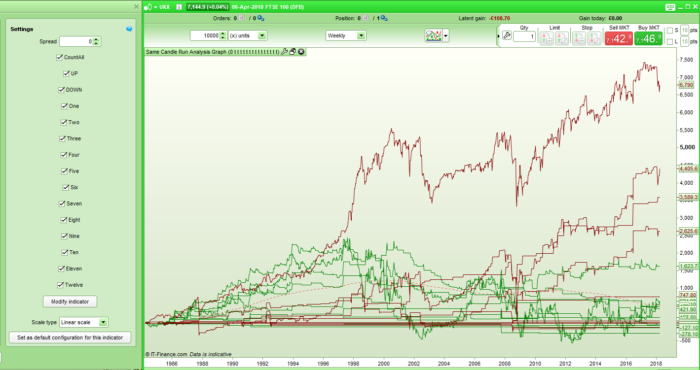
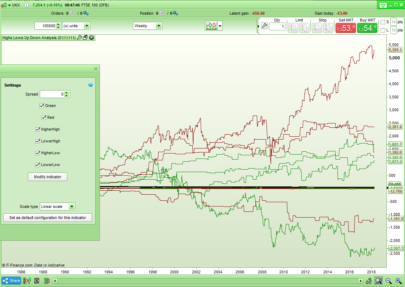
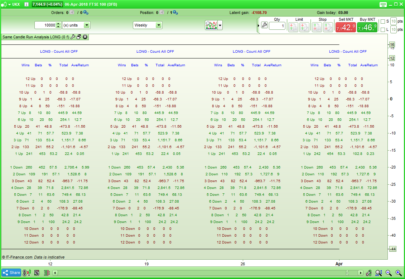
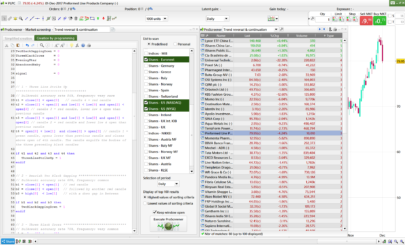
Same Candle Run Analysis Graph returns in graphical format the won/lost total amount results of my Same Candle Run Analysis Tool. The graphical format allows you to more easily see how consistent over time the results have been. It can be used to analyse runs of the same colour candle in any market and on any time frame. Runs of up to 12 candles of the same colour are analysed.
It calculates a simulated result as if you placed a long trade at the close of a run of the same coloured candles and then closed it one candle later. This can give us an idea what has the highest probability of happening next based on historical data. Although it can be used on any time frame on shorter time frames the results can be fairly meaningless due to the amount of market noise. I would advise using it on anything from yearly to 4 hour time frames.
You can select which lines to display by selecting or deselecting Up, Down, or any combination of numbers from One to Twelve. Hover over the graph to identify each line.
The setting ‘CountAll’ can be turned on and off. If ON then the results are calculated using every occurrence of a run. For example a run of three up candles is in fact three runs of one up candle, two runs of two up candles and one run of three up candles and all will be calculated in the results. If set to OFF then just the first occurrence is used – so a run of three up candles for example must be a down candle followed by three up candles.
A spread amount can also be input and is deducted from the results of each trade. Set to zero if you do not want to analyse with spread.
If you want to know what would have happened if you had gone short then obviously short trades would have resulted in the direct opposite results. So a return of +1255 for long trades would be a loss of 1255 if you had done short trades.
I recommend using this tool alongside my Same Candle Run Analysis Tool as that gives additional information such as percentage of winning trades and average return to help with better analysis.
I advise you to download the .ITF file and import it rather than cut and paste the code to ensure that you get full functionality.
|
1 2 3 4 5 6 7 8 9 10 11 12 13 14 15 16 17 18 19 20 21 22 23 24 25 26 27 28 29 30 31 32 33 34 35 36 37 38 39 40 41 42 43 44 45 46 47 48 49 50 51 52 53 54 55 56 57 58 59 60 61 62 63 64 65 66 67 68 69 70 71 72 73 74 75 76 77 78 79 80 81 82 83 84 85 86 87 88 89 90 91 92 93 94 95 96 97 98 99 100 101 102 103 104 105 106 107 108 109 110 111 112 113 114 115 116 117 118 119 120 121 122 123 124 125 126 127 128 129 130 131 132 133 134 135 136 137 138 139 140 141 142 143 144 145 146 147 148 149 150 151 152 153 154 155 156 157 158 159 160 161 162 163 164 165 166 167 168 169 170 171 172 173 174 175 176 177 178 179 180 181 182 183 184 185 186 187 188 189 190 191 192 193 194 195 196 197 198 199 200 201 202 203 204 205 206 207 208 209 210 211 212 213 214 215 216 217 218 219 220 221 222 223 224 225 226 227 228 229 230 231 232 233 234 235 236 237 238 239 240 241 242 243 244 245 246 247 248 249 250 251 252 253 254 255 256 257 258 259 260 261 262 263 264 265 266 267 268 269 270 271 272 273 274 275 276 277 278 279 280 281 282 283 284 285 286 287 288 289 290 291 292 293 294 295 296 297 298 299 300 301 302 303 304 305 306 307 308 309 310 311 312 313 314 315 316 317 318 319 320 321 322 323 324 325 326 327 328 329 330 331 332 333 334 335 336 337 338 339 340 341 342 343 344 345 346 347 348 349 350 351 352 353 354 355 356 357 358 359 360 361 362 363 364 365 366 367 368 369 370 371 372 373 374 375 376 377 378 379 380 381 382 383 384 385 386 387 388 389 390 391 392 393 394 395 396 397 398 399 400 401 402 403 404 405 406 407 408 409 410 411 412 413 414 415 416 417 418 419 420 421 422 423 424 425 426 427 428 429 430 431 432 433 434 435 436 437 438 439 440 441 442 443 444 445 446 |
IF CountAll = 1 THEN IF Down = 1 THEN IF Twelve = 1 THEN IF close > Open + Spread and close[1] < open[1] and close[2] < open[2] and close[3] < open[3] and close[4] < open[4] and close[5] < open[5] and close[6] < open[6] and close[7] < open[7] and close[8] < open[8] and close[9] < open[9] and close[10] < open[10] and close[11] < open[11] and close[12] < open[12] THEN Down12Total = Down12Total + (close - open) - Spread ENDIF IF close < open and close[1] < open[1] and close[2] < open[2] and close[3] < open[3] and close[4] < open[4] and close[5] < open[5] and close[6] < open[6] and close[7] < open[7] and close[8] < open[8] and close[9] < open[9] and close[10] < open[10] and close[11] < open[11] and close[12] < open[12] THEN Down12Total = Down12Total + (close - open) - Spread ENDIF ENDIF IF Eleven = 1 THEN IF close > Open + Spread and close[1] < open[1] and close[2] < open[2] and close[3] < open[3] and close[4] < open[4] and close[5] < open[5] and close[6] < open[6] and close[7] < open[7] and close[8] < open[8] and close[9] < open[9] and close[10] < open[10] and close[11] < open[11] THEN Down11Total = Down11Total + (close - open) - Spread ENDIF IF close < open and close[1] < open[1] and close[2] < open[2] and close[3] < open[3] and close[4] < open[4] and close[5] < open[5] and close[6] < open[6] and close[7] < open[7] and close[8] < open[8] and close[9] < open[9] and close[10] < open[10] and close[11] < open[11] THEN Down11Total = Down11Total + (close - open) - Spread ENDIF ENDIF IF Ten = 1 THEN IF close > Open + Spread and close[1] < open[1] and close[2] < open[2] and close[3] < open[3] and close[4] < open[4] and close[5] < open[5] and close[6] < open[6] and close[7] < open[7] and close[8] < open[8] and close[9] < open[9] and close[10] < open[10] THEN Down10Total = Down10Total + (close - open) - Spread ENDIF IF close < open and close[1] < open[1] and close[2] < open[2] and close[3] < open[3] and close[4] < open[4] and close[5] < open[5] and close[6] < open[6] and close[7] < open[7] and close[8] < open[8] and close[9] < open[9] and close[10] < open[10] THEN Down10Total = Down10Total + (close - open) - Spread ENDIF ENDIF IF Nine = 1 THEN IF close > Open + Spread and close[1] < open[1] and close[2] < open[2] and close[3] < open[3] and close[4] < open[4] and close[5] < open[5] and close[6] < open[6] and close[7] < open[7] and close[8] < open[8] and close[9] < open[9] THEN Down9Total = Down9Total + (close - open) - Spread ENDIF IF close < open and close[1] < open[1] and close[2] < open[2] and close[3] < open[3] and close[4] < open[4] and close[5] < open[5] and close[6] < open[6] and close[7] < open[7] and close[8] < open[8] and close[9] < open[9]THEN Down9Total = Down9Total + (close - open) - Spread ENDIF ENDIF IF Eight = 1 THEN IF close > Open + Spread and close[1] < open[1] and close[2] < open[2] and close[3] < open[3] and close[4] < open[4] and close[5] < open[5] and close[6] < open[6] and close[7] < open[7] and close[8] < open[8] THEN Down8Total = Down8Total + (close - open) - Spread ENDIF IF close < open and close[1] < open[1] and close[2] < open[2] and close[3] < open[3] and close[4] < open[4] and close[5] < open[5] and close[6] < open[6] and close[7] < open[7] and close[8] < open[8] THEN Down8Total = Down8Total + (close - open) - Spread ENDIF ENDIF IF Seven = 1 THEN IF close > Open + Spread and close[1] < open[1] and close[2] < open[2] and close[3] < open[3] and close[4] < open[4] and close[5] < open[5] and close[6] < open[6] and close[7] < open[7] THEN Down7Total = Down7Total + (close - open) - Spread ENDIF IF close < open and close[1] < open[1] and close[2] < open[2] and close[3] < open[3] and close[4] < open[4] and close[5] < open[5] and close[6] < open[6] and close[7] < open[7] THEN Down7Total = Down7Total + (close - open) - Spread ENDIF ENDIF IF Six = 1 THEN IF close > Open + Spread and close[1] < open[1] and close[2] < open[2] and close[3] < open[3] and close[4] < open[4] and close[5] < open[5] and close[6] < open[6] THEN Down6Total = Down6Total + (close - open) - Spread ENDIF IF close < open and close[1] < open[1] and close[2] < open[2] and close[3] < open[3] and close[4] < open[4] and close[5] < open[5] and close[6] < open[6] THEN Down6Total = Down6Total + (close - open) - Spread ENDIF ENDIF IF Five = 1 THEN IF close > Open + Spread and close[1] < open[1] and close[2] < open[2] and close[3] < open[3] and close[4] < open[4] and close[5] < open[5] THEN Down5Total = Down5Total + (close - open) - Spread ENDIF IF close < open and close[1] < open[1] and close[2] < open[2] and close[3] < open[3] and close[4] < open[4] and close[5] < open[5] THEN Down5Total = Down5Total + (close - open) - Spread ENDIF ENDIF IF Four = 1 THEN IF close > Open + Spread and close[1] < open[1] and close[2] < open[2] and close[3] < open[3] and close[4] < open[4] THEN Down4Total = Down4Total + (close - open) - Spread ENDIF IF close < open and close[1] < open[1] and close[2] < open[2] and close[3] < open[3] and close[4] < open[4] THEN Down4Total = Down4Total + (close - open) - Spread ENDIF ENDIF IF Three = 1 THEN IF close > Open + Spread and close[1] < open[1] and close[2] < open[2] and close[3] < open[3] THEN Down3Total = Down3Total + (close - open) - Spread ENDIF IF close < open and close[1] < open[1] and close[2] < open[2] and close[3] < open[3] THEN Down3Total = Down3Total + (close - open) - Spread ENDIF ENDIF IF Two = 1 THEN IF close > Open + Spread and close[1] < open[1] and close[2] < open[2] THEN Down2Total = Down2Total + (close - open) - Spread ENDIF IF close < open and close[1] < open[1] and close[2] < open[2] THEN Down2Total = Down2Total + (close - open) - Spread ENDIF ENDIF IF One = 1 THEN IF close > Open + Spread and close[1] < open[1] THEN Down1Total = Down1Total + (close - open) - Spread ENDIF IF close < open and close[1] < open[1] THEN Down1Total = Down1Total + (close - open) - Spread ENDIF ENDIF ENDIF IF Up = 1 THEN IF Twelve = 1 THEN IF close > Open + Spread and close[1] > open[1] and close[2] > open[2] and close[3] > open[3] and close[4] > open[4] and close[5] > open[5] and close[6] > open[6] and close[7] > open[7] and close[8] > open[8] and close[9] > open[9] and close[10] > open[10] and close[11] > open[11] and close[12] > open[12] THEN Up12Total = Up12Total + (close - open) - Spread ENDIF IF close < open and close[1] > open[1] and close[2] > open[2] and close[3] > open[3] and close[4] > open[4] and close[5] > open[5] and close[6] > open[6] and close[7] > open[7] and close[8] > open[8] and close[9] > open[9] and close[10] > open[10] and close[11] > open[11] and close[12] > open[12] THEN Up12Total = Up12Total + (close - open) - Spread ENDIF ENDIF IF Eleven = 1 THEN IF close > Open + Spread and close[1] > open[1] and close[2] > open[2] and close[3] > open[3] and close[4] > open[4] and close[5] > open[5] and close[6] > open[6] and close[7] > open[7] and close[8] > open[8] and close[9] > open[9] and close[10] > open[10] and close[11] > open[11] THEN Up11Total = Up11Total + (close - open) - Spread ENDIF IF close < open and close[1] > open[1] and close[2] > open[2] and close[3] > open[3] and close[4] > open[4] and close[5] > open[5] and close[6] > open[6] and close[7] > open[7] and close[8] > open[8] and close[9] > open[9] and close[10] > open[10] and close[11] > open[11] THEN Up11Total = Up11Total + (close - open) - Spread ENDIF ENDIF IF Ten = 1 THEN IF close > Open + Spread and close[1] > open[1] and close[2] > open[2] and close[3] > open[3] and close[4] > open[4] and close[5] > open[5] and close[6] > open[6] and close[7] > open[7] and close[8] > open[8] and close[9] > open[9] and close[10] > open[10] THEN Up10Total = Up10Total + (close - open) - Spread ENDIF IF close < open and close[1] > open[1] and close[2] > open[2] and close[3] > open[3] and close[4] > open[4] and close[5] > open[5] and close[6] > open[6] and close[7] > open[7] and close[8] > open[8] and close[9] > open[9] and close[10] > open[10] THEN Up10Total = Up10Total + (close - open) - Spread ENDIF ENDIF IF Nine = 1 THEN IF close > Open + Spread and close[1] > open[1] and close[2] > open[2] and close[3] > open[3] and close[4] > open[4] and close[5] > open[5] and close[6] > open[6] and close[7] > open[7] and close[8] > open[8] and close[9] > open[9] THEN Up9Total = Up9Total + (close - open) - Spread ENDIF IF close < open and close[1] > open[1] and close[2] > open[2] and close[3] > open[3] and close[4] > open[4] and close[5] > open[5] and close[6] > open[6] and close[7] > open[7] and close[8] > open[8] and close[9] > open[9] THEN Up9Total = Up9Total + (close - open) - Spread ENDIF ENDIF IF Eight = 1 THEN IF close > Open + Spread and close[1] > open[1] and close[2] > open[2] and close[3] > open[3] and close[4] > open[4] and close[5] > open[5] and close[6] > open[6] and close[7] > open[7] and close[8] > open[8] THEN Up8Total = Up8Total + (close - open) - Spread ENDIF IF close < open and close[1] > open[1] and close[2] > open[2] and close[3] > open[3] and close[4] > open[4] and close[5] > open[5] and close[6] > open[6] and close[7] > open[7] and close[8] > open[8] THEN Up8Total = Up8Total + (close - open) - Spread ENDIF ENDIF IF Seven = 1 THEN IF close > Open + Spread and close[1] > open[1] and close[2] > open[2] and close[3] > open[3] and close[4] > open[4] and close[5] > open[5] and close[6] > open[6] and close[7] > open[7] THEN Up7Total = Up7Total + (close - open) - Spread ENDIF IF close < open and close[1] > open[1] and close[2] > open[2] and close[3] > open[3] and close[4] > open[4] and close[5] > open[5] and close[6] > open[6] and close[7] > open[7] THEN Up7Total = Up7Total + (close - open) - Spread ENDIF ENDIF IF Six = 1 THEN IF close > Open + Spread and close[1] > open[1] and close[2] > open[2] and close[3] > open[3] and close[4] > open[4] and close[5] > open[5] and close[6] > open[6] THEN Up6Total = Up6Total + (close - open) - Spread ENDIF IF close < open and close[1] > open[1] and close[2] > open[2] and close[3] > open[3] and close[4] > open[4] and close[5] > open[5] and close[6] > open[6] THEN Up6Total = Up6Total + (close - open) - Spread ENDIF ENDIF IF Five = 1 THEN IF close > Open + Spread and close[1] > open[1] and close[2] > open[2] and close[3] > open[3] and close[4] > open[4] and close[5] > open[5] THEN Up5Total = Up5Total + (close - open) - Spread ENDIF IF close < open and close[1] > open[1] and close[2] > open[2] and close[3] > open[3] and close[4] > open[4] and close[5] > open[5] THEN Up5Total = Up5Total + (close - open) - Spread ENDIF ENDIF IF Four = 1 THEN IF close > Open + Spread and close[1] > open[1] and close[2] > open[2] and close[3] > open[3] and close[4] > open[4] THEN Up4Total = Up4Total + (close - open) - Spread ENDIF IF close < open and close[1] > open[1] and close[2] > open[2] and close[3] > open[3] and close[4] > open[4] THEN Up4Total = Up4Total + (close - open) - Spread ENDIF ENDIF IF Three = 1 THEN IF close > Open + Spread and close[1] > open[1] and close[2] > open[2] and close[3] > open[3] THEN Up3Total = Up3Total + (close - open) - Spread ENDIF IF close < open and close[1] > open[1] and close[2] > open[2] and close[3] > open[3] THEN Up3Total = Up3Total + (close - open) - Spread ENDIF ENDIF IF Two = 1 THEN IF close > Open + Spread and close[1] > open[1] and close[2] > open[2] THEN Up2Total = Up2Total + (close - open) - Spread ENDIF IF close < open and close[1] > open[1] and close[2] > open[2] THEN Up2Total = Up2Total + (close - open) - Spread ENDIF ENDIF IF One = 1 THEN IF close > Open + Spread and close[1] > open[1] THEN Up1Total = Up1Total + (close - open) - Spread ENDIF IF close < open and close[1] > open[1] THEN Up1Total = Up1Total + (close - open) - Spread ENDIF ENDIF ENDIF ENDIF IF CountAll <> 1 THEN IF Down = 1 THEN IF Twelve =1 THEN IF close > Open + Spread and close[1] < open[1] and close[2] < open[2] and close[3] < open[3] and close[4] < open[4] and close[5] < open[5] and close[6] < open[6] and close[7] < open[7] and close[8] < open[8] and close[9] < open[9] and close[10] < open[10] and close[11] < open[11] and close[12] < open[12] and close[13] > open[13] THEN Down12Total = Down12Total + (close - open) - Spread ENDIF IF close < open and close[1] < open[1] and close[2] < open[2] and close[3] < open[3] and close[4] < open[4] and close[5] < open[5] and close[6] < open[6] and close[7] < open[7] and close[8] < open[8] and close[9] < open[9] and close[10] < open[10] and close[11] < open[11] and close[12] < open[12] and close[13] > open[13] THEN Down12Total = Down12Total + (close - open) - Spread ENDIF ENDIF IF Eleven = 1 THEN IF close > Open + Spread and close[1] < open[1] and close[2] < open[2] and close[3] < open[3] and close[4] < open[4] and close[5] < open[5] and close[6] < open[6] and close[7] < open[7] and close[8] < open[8] and close[9] < open[9] and close[10] < open[10] and close[11] < open[11] and close[12] > open[12] THEN Down11Total = Down11Total + (close - open) - Spread ENDIF IF close < open and close[1] < open[1] and close[2] < open[2] and close[3] < open[3] and close[4] < open[4] and close[5] < open[5] and close[6] < open[6] and close[7] < open[7] and close[8] < open[8] and close[9] < open[9] and close[10] < open[10] and close[11] < open[11] and close[12] > open[12] THEN Down11Total = Down11Total + (close - open) - Spread ENDIF ENDIF IF Ten = 1 THEN IF close > Open + Spread and close[1] < open[1] and close[2] < open[2] and close[3] < open[3] and close[4] < open[4] and close[5] < open[5] and close[6] < open[6] and close[7] < open[7] and close[8] < open[8] and close[9] < open[9] and close[10] < open[10] and close[11] > open[11] THEN Down10Total = Down10Total + (close - open) - Spread ENDIF IF close < open and close[1] < open[1] and close[2] < open[2] and close[3] < open[3] and close[4] < open[4] and close[5] < open[5] and close[6] < open[6] and close[7] < open[7] and close[8] < open[8] and close[9] < open[9] and close[10] < open[10] and close[11] > open[11] THEN Down10Total = Down10Total + (close - open) - Spread ENDIF ENDIF IF Nine = 1 THEN IF close > Open + Spread and close[1] < open[1] and close[2] < open[2] and close[3] < open[3] and close[4] < open[4] and close[5] < open[5] and close[6] < open[6] and close[7] < open[7] and close[8] < open[8] and close[9] < open[9] and close[10] > open[10] THEN Down9Total = Down9Total + (close - open) - Spread ENDIF IF close < open and close[1] < open[1] and close[2] < open[2] and close[3] < open[3] and close[4] < open[4] and close[5] < open[5] and close[6] < open[6] and close[7] < open[7] and close[8] < open[8] and close[9] < open[9] and close[10] > open[10] THEN Down9Total = Down9Total + (close - open) - Spread ENDIF ENDIF IF Eight = 1 THEN IF close > Open + Spread and close[1] < open[1] and close[2] < open[2] and close[3] < open[3] and close[4] < open[4] and close[5] < open[5] and close[6] < open[6] and close[7] < open[7] and close[8] < open[8] and close[9] > open[9] THEN Down8Total = Down8Total + (close - open) - Spread ENDIF IF close < open and close[1] < open[1] and close[2] < open[2] and close[3] < open[3] and close[4] < open[4] and close[5] < open[5] and close[6] < open[6] and close[7] < open[7] and close[8] < open[8] and close[9] > open[9] THEN Down8Total = Down8Total + (close - open) - Spread ENDIF ENDIF IF Seven = 1 THEN IF close > Open + Spread and close[1] < open[1] and close[2] < open[2] and close[3] < open[3] and close[4] < open[4] and close[5] < open[5] and close[6] < open[6] and close[7] < open[7] and close[8] > open[8] THEN Down7Total = Down7Total + (close - open) - Spread ENDIF IF close < open and close[1] < open[1] and close[2] < open[2] and close[3] < open[3] and close[4] < open[4] and close[5] < open[5] and close[6] < open[6] and close[7] < open[7] and close[8] > open[8] THEN Down7Total = Down7Total + (close - open) - Spread ENDIF ENDIF IF Six = 1 THEN IF close > Open + Spread and close[1] < open[1] and close[2] < open[2] and close[3] < open[3] and close[4] < open[4] and close[5] < open[5] and close[6] < open[6] and close[7] > open[7] THEN Down6Total = Down6Total + (close - open) - Spread ENDIF IF close < open and close[1] < open[1] and close[2] < open[2] and close[3] < open[3] and close[4] < open[4] and close[5] < open[5] and close[6] < open[6] and close[7] > open[7] THEN Down6Total = Down6Total + (close - open) - Spread ENDIF ENDIF IF Five = 1 THEN IF close > Open + Spread and close[1] < open[1] and close[2] < open[2] and close[3] < open[3] and close[4] < open[4] and close[5] < open[5] and close[6] > open[6] THEN Down5Total = Down5Total + (close - open) - Spread ENDIF IF close < open and close[1] < open[1] and close[2] < open[2] and close[3] < open[3] and close[4] < open[4] and close[5] < open[5] and close[6] > open[6] THEN Down5Total = Down5Total + (close - open) - Spread ENDIF ENDIF IF Four = 1 THEN IF close > Open + Spread and close[1] < open[1] and close[2] < open[2] and close[3] < open[3] and close[4] < open[4] and close[5] > open[5] THEN Down4Total = Down4Total + (close - open) - Spread ENDIF IF close < open and close[1] < open[1] and close[2] < open[2] and close[3] < open[3] and close[4] < open[4] and close[5] > open[5] THEN Down4Total = Down4Total + (close - open) - Spread ENDIF ENDIF IF Three = 1 THEN IF close > Open + Spread and close[1] < open[1] and close[2] < open[2] and close[3] < open[3] and close[4] > open[4] THEN Down3Total = Down3Total + (close - open) - Spread ENDIF IF close < open and close[1] < open[1] and close[2] < open[2] and close[3] < open[3] and close[4] > open[4] THEN Down3Total = Down3Total + (close - open) - Spread ENDIF ENDIF IF Two = 1 THEN IF close > Open + Spread and close[1] < open[1] and close[2] < open[2] and close[3] > open[3] THEN Down2Total = Down2Total + (close - open) - Spread ENDIF IF close < open and close[1] < open[1] and close[2] < open[2] and close[3] > open[3] THEN Down2Total = Down2Total + (close - open) - Spread ENDIF ENDIF IF One = 1 THEN IF close > Open + Spread and close[1] < open[1] and close[2] > open[2] THEN Down1Total = Down1Total + (close - open) - Spread ENDIF IF close < open and close[1] < open[1] and close[2] > open[2] THEN Down1Total = Down1Total + (close - open) - Spread ENDIF ENDIF ENDIF IF Up = 1 THEN IF Twelve = 1 THEN IF close > Open + Spread and close[1] > open[1] and close[2] > open[2] and close[3] > open[3] and close[4] > open[4] and close[5] > open[5] and close[6] > open[6] and close[7] > open[7] and close[8] > open[8] and close[9] > open[9] and close[10] > open[10] and close[11] > open[11] and close[12] > open[12] and close[13] < open[13] THEN Up12Total = Up12Total + (close - open) - Spread ENDIF IF close < open and close[1] > open[1] and close[2] > open[2] and close[3] > open[3] and close[4] > open[4] and close[5] > open[5] and close[6] > open[6] and close[7] > open[7] and close[8] > open[8] and close[9] > open[9] and close[10] > open[10] and close[11] > open[11] and close[12] > open[12] and close[13] < open[13] THEN Up12Total = Up12Total + (close - open) - Spread ENDIF ENDIF IF Eleven = 1 THEN IF close > Open + Spread and close[1] > open[1] and close[2] > open[2] and close[3] > open[3] and close[4] > open[4] and close[5] > open[5] and close[6] > open[6] and close[7] > open[7] and close[8] > open[8] and close[9] > open[9] and close[10] > open[10] and close[11] > open[11] and close[12] < open[12] THEN Up11Total = Up11Total + (close - open) - Spread ENDIF IF close < open and close[1] > open[1] and close[2] > open[2] and close[3] > open[3] and close[4] > open[4] and close[5] > open[5] and close[6] > open[6] and close[7] > open[7] and close[8] > open[8] and close[9] > open[9] and close[10] > open[10] and close[11] > open[11] and close[12] < open[12] THEN Up11Total = Up11Total + (close - open) - Spread ENDIF ENDIF IF Ten = 1 THEN IF close > Open + Spread and close[1] > open[1] and close[2] > open[2] and close[3] > open[3] and close[4] > open[4] and close[5] > open[5] and close[6] > open[6] and close[7] > open[7] and close[8] > open[8] and close[9] > open[9] and close[10] > open[10] and close[11] < open[11] THEN Up10Total = Up10Total + (close - open) - Spread ENDIF IF close < open and close[1] > open[1] and close[2] > open[2] and close[3] > open[3] and close[4] > open[4] and close[5] > open[5] and close[6] > open[6] and close[7] > open[7] and close[8] > open[8] and close[9] > open[9] and close[10] > open[10] and close[11] < open[11] THEN Up10Total = Up10Total + (close - open) - Spread ENDIF ENDIF IF Nine = 1 THEN IF close > Open + Spread and close[1] > open[1] and close[2] > open[2] and close[3] > open[3] and close[4] > open[4] and close[5] > open[5] and close[6] > open[6] and close[7] > open[7] and close[8] > open[8] and close[9] > open[9] and close[10] < open[10] THEN Up9Total = Up9Total + (close - open) - Spread ENDIF IF close < open and close[1] > open[1] and close[2] > open[2] and close[3] > open[3] and close[4] > open[4] and close[5] > open[5] and close[6] > open[6] and close[7] > open[7] and close[8] > open[8] and close[9] > open[9] and close[10] < open[10] THEN Up9Total = Up9Total + (close - open) - Spread ENDIF ENDIF IF Eight = 1 THEN IF close > Open + Spread and close[1] > open[1] and close[2] > open[2] and close[3] > open[3] and close[4] > open[4] and close[5] > open[5] and close[6] > open[6] and close[7] > open[7] and close[8] > open[8] and close[9] < open[9] THEN Up8Total = Up8Total + (close - open) - Spread ENDIF IF close < open and close[1] > open[1] and close[2] > open[2] and close[3] > open[3] and close[4] > open[4] and close[5] > open[5] and close[6] > open[6] and close[7] > open[7] and close[8] > open[8] and close[9] < open[9] THEN Up8Total = Up8Total + (close - open) - Spread ENDIF ENDIF IF Seven = 1 THEN IF close > Open + Spread and close[1] > open[1] and close[2] > open[2] and close[3] > open[3] and close[4] > open[4] and close[5] > open[5] and close[6] > open[6] and close[7] > open[7] and close[8] < open[8] THEN Up7Total = Up7Total + (close - open) - Spread ENDIF IF close < open and close[1] > open[1] and close[2] > open[2] and close[3] > open[3] and close[4] > open[4] and close[5] > open[5] and close[6] > open[6] and close[7] > open[7] and close[8] < open[8] THEN Up7Total = Up7Total + (close - open) - Spread ENDIF ENDIF IF Six = 1 THEN IF close > Open + Spread and close[1] > open[1] and close[2] > open[2] and close[3] > open[3] and close[4] > open[4] and close[5] > open[5] and close[6] > open[6] and close[7] < open[7] THEN Up6Total = Up6Total + (close - open) - Spread ENDIF IF close < open and close[1] > open[1] and close[2] > open[2] and close[3] > open[3] and close[4] > open[4] and close[5] > open[5] and close[6] > open[6] and close[7] < open[7] THEN Up6Total = Up6Total + (close - open) - Spread ENDIF ENDIF IF Five = 1 THEN IF close > Open + Spread and close[1] > open[1] and close[2] > open[2] and close[3] > open[3] and close[4] > open[4] and close[5] > open[5] and close[6] < open[6] THEN Up5Total = Up5Total + (close - open) - Spread ENDIF IF close < open and close[1] > open[1] and close[2] > open[2] and close[3] > open[3] and close[4] > open[4] and close[5] > open[5] and close[6] < open[6] THEN Up5Total = Up5Total + (close - open) - Spread ENDIF ENDIF IF Four = 1 THEN IF close > Open + Spread and close[1] > open[1] and close[2] > open[2] and close[3] > open[3] and close[4] > open[4] and close[5] < open[5] THEN Up4Total = Up4Total + (close - open) - Spread ENDIF IF close < open and close[1] > open[1] and close[2] > open[2] and close[3] > open[3] and close[4] > open[4] and close[5] < open[5] THEN Up4Total = Up4Total + (close - open) - Spread ENDIF ENDIF IF Three = 1 THEN IF close > Open + Spread and close[1] > open[1] and close[2] > open[2] and close[3] > open[3] and close[4] < open[4] THEN Up3Total = Up3Total + (close - open) - Spread ENDIF IF close < open and close[1] > open[1] and close[2] > open[2] and close[3] > open[3] and close[4] < open[4] THEN Up3Total = Up3Total + (close - open) - Spread ENDIF ENDIF IF Two = 1 THEN IF close > Open + Spread and close[1] > open[1] and close[2] > open[2] and close[3] < open[3] THEN Up2Total = Up2Total + (close - open) - Spread ENDIF IF close < open and close[1] > open[1] and close[2] > open[2] and close[3] < open[3]THEN Up2Total = Up2Total + (close - open) - Spread ENDIF ENDIF IF One = 1 THEN IF close > Open + Spread and close[1] > open[1] and close[2] < open[2] THEN Up1Total = Up1Total + (close - open) - Spread ENDIF IF close < open and close[1] > open[1] and close[2] < open[2] THEN Up1Total = Up1Total + (close - open) - Spread ENDIF ENDIF ENDIF ENDIF Return Up12Total Coloured(0,128,0) as "12 Up Total" ,Up11Total Coloured(0,128,0) as "11 Up Total",Up10Total Coloured(0,128,0) as "10 Up Total", Up9Total Coloured(0,128,0) as "9 Up Total", Up8Total Coloured(0,128,0) as "8 Up Total", Up7Total Coloured(0,128,0) as "7 Up Total", Up6Total Coloured(0,128,0) as "6 Up Total", Up5Total Coloured(0,128,0) as "5 Up Total", Up4Total Coloured(0,128,0) as "4 Up Total", Up3Total Coloured(0,128,0) as "3 Up Total", Up2Total Coloured(0,128,0) as "2 Up Total", Up1Total Coloured(0,128,0) as "1 Up Total", Down12Total Coloured(128,0,0) as "12 Down Total", Down11Total Coloured(128,0,0) as "11 Down Total", Down10Total Coloured(128,0,0) as "10 Down Total", Down9Total Coloured(128,0,0) as "9 Down Total", Down8Total Coloured(128,0,0) as "8 Down Total", Down7Total Coloured(128,0,0) as "7 Down Total", Down6Total Coloured(128,0,0) as "6 Down Total", Down5Total Coloured(128,0,0) as "5 Down Total", Down4Total Coloured(128,0,0) as "4 Down Total", Down3Total Coloured(128,0,0) as "3 Down Total", Down2Total Coloured(128,0,0) as "2 Down Total", Down1Total Coloured(128,0,0) as "1 Down Total" |
Share this
No information on this site is investment advice or a solicitation to buy or sell any financial instrument. Past performance is not indicative of future results. Trading may expose you to risk of loss greater than your deposits and is only suitable for experienced investors who have sufficient financial means to bear such risk.
ProRealTime ITF files and other attachments :
Find other exclusive trading pro-tools on ![]()
PRC is also on YouTube, subscribe to our channel for exclusive content and tutorials


Thanks for sharing so much work. This goes in the indicator window, yes?
It’s ok, I imported the rtf as suggested now it works.
What I’m seeing is this – in a solid uptrend, mean reversion is best. In a volatile market, best to follow the immediate trend.
Thanks for your thanks Real Pro and yes everyone should import the itf file to make sure that it works. Your conclusions of the graphs will depend upon which market and which time frame you are testing. On indices and longer time frames it clearly confirms the benefits of buying in dips but we must remember that we are always dealing with what has happened and not what will happen! Some markets can clearly be seen to have changed their character at some point. The invention of the computer and automatic trading is quite often a changing point so we should consider putting less interest in earlier data results.
Good job, which could be applied for a spectrum of another indicators.
As to better understand which parameters are better for an indicators in a specific period (and above all, why ?…..)