

Candlestick Probability
This indicator analyses candles in the past and then displays in a text format what has historically happened based on how the current candle is drawn.
It analyses every candle back to whatever start date you set and the win rate is calculated based on buying or selling at the open of the next candle and then selling at the close.
It analyses colour, highs and lows and every combination of them.
It returns short and long win rate results for:
- Candle colour – a green or red body.
- A higher high (HH) or lower high (LH) or higher low (HL) or lower low (LL) compared to the previous candle.
- Candles with a HH, LH, HL or LL with either green or red body.
- Candles with HH+HL, LH+LL, HH+LL or LH+HL.
- Candles with HH+HL, LH+LL, HH+LL or LH+HL with either a green or red body.
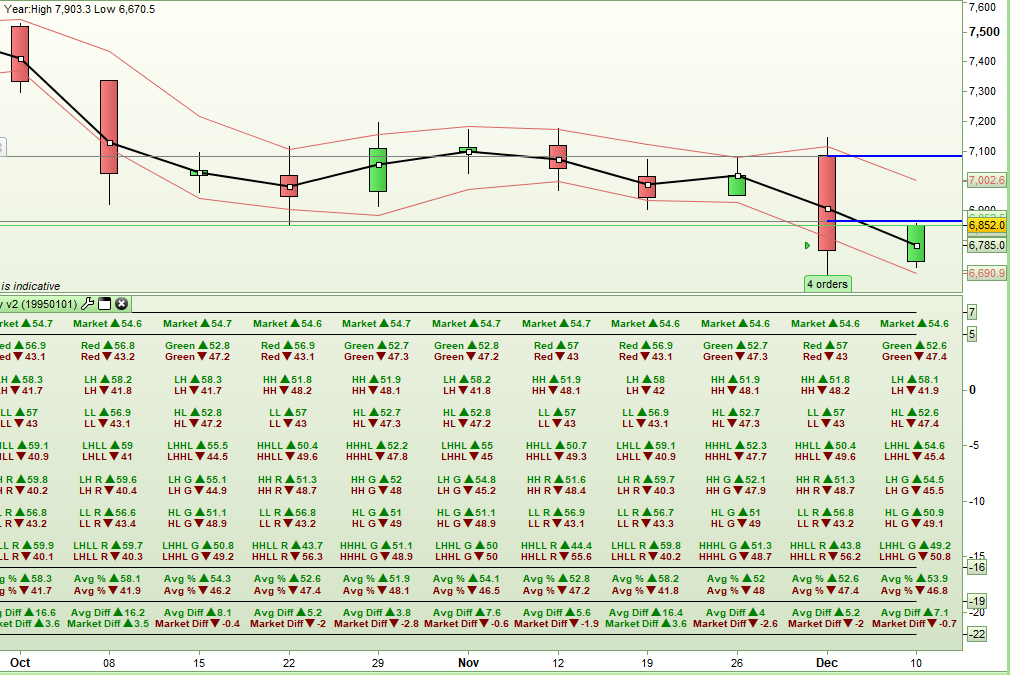
It checks the current candle and then displays below it the following data based on which of the above candle conditions are met:
- Market – the all time win rate if you bought at the open of every candle and sold at the close. It is shown as green if longs have been more successful and red if shorts have been more successful. This is our baseline probability to try to beat.
- The long win rate and short win rate for each of the possible combinations that fit the candle drawn above.
- The average long win rate and the average short win rate for all the results for the candle drawn above.
- The difference between the average win rates. The higher number is the highest probable direction of the next candle based on what has happened historically.
- The difference between the all time market win rate and the highest of the two long/short average win rates. A minus/red number indicates that the probability is not greater than the market norm and a higher/green number indicates that probability is greater than the market norm.
Obviously zoom in to see the indicator more clearly.
This indicator could be useful for checking on weekly and daily charts to get a feel for what might happen next but remember that what happened in the past may not necessarily repeat itself in the future! Also on indices where the trend is normally up the probability for short trades will always be low compared to long trades.
//Candlestick Probability
//
//By Vonasi
//Created 20181211
//

//StartDate = 19950101

hh = high[1] > high[2]
ll = low[1] < low[2]
hl = low[1] >= low[2]
lh = high[1] <= high[2]
g = close[1] > open[1]
r = close [1] <= open[1]

if date >= startdate then
//HH
if hh then
hhcount = hhcount + 1
if close > open then
hhlong = hhlong + 1
endif
endif

//LL
if ll then
llcount = llcount + 1
if close > open then
lllong = lllong + 1
endif
endif

//LH
if lh then
lhcount = lhcount + 1
if close > open then
lhlong = lhlong + 1
endif
endif

//HL
if hl then
hlcount = hlcount + 1
if close > open then
hllong = hllong + 1
endif
endif

//HHHL
if hh and hl then
hhhlcount = hhhlcount + 1
if close > open then
hhhllong = hhhllong + 1
endif
endif

//LHLL
if lh and ll then
lhllcount = lhllcount + 1
if close > open then
lhlllong = lhlllong + 1
endif
endif

//HHLL
if hh and ll then
hhllcount = hhllcount + 1
if close > open then
hhlllong = hhlllong + 1
endif
endif

//LHHL
if lh and hl then
lhhlcount = lhhlcount + 1
if close > open then
lhhllong = lhhllong + 1
endif
endif

//HHG
if hh and g then
hhgcount = hhgcount + 1
if close > open then
hhglong = hhglong + 1
endif
endif

//LLG
if ll and g then
llgcount = llgcount + 1
if close > open then
llglong = llglong + 1
endif
endif

//LHG
if lh and g then
lhgcount = lhgcount + 1
if close > open then
lhglong = lhglong + 1
endif
endif

//HLG
if hl and g then
hlgcount = hlgcount + 1
if close > open then
hlglong = hlglong + 1
endif
endif

//HHR
if hh and r then
hhrcount = hhrcount + 1
if close > open then
hhrlong = hhrlong + 1
endif
endif

//LLR
if ll and r then
llrcount = llrcount + 1
if close > open then
llrlong = llrlong + 1
endif
endif


//LHR
if lh and r then
lhrcount = lhrcount + 1
if close > open then
lhrlong = lhrlong + 1
endif
endif

//HLR
if hl and r then
hlrcount = hlrcount + 1
if close > open then
hlrlong = hlrlong + 1
endif
endif

//HHHLG
if hh and hl and g then
hhhlgcount = hhhlgcount + 1
if close > open then
hhhlglong = hhhlglong + 1
endif
endif

//LHLLG
if lh and ll and g then
lhllgcount = lhllgcount + 1
if close > open then
lhllglong = lhllglong + 1
endif
endif

//HHLLG
if hh and ll and g then
hhllgcount = hhllgcount + 1
if close > open then
hhllglong = hhllglong + 1
endif
endif

//LHHLG
if lh and hl and g then
lhhlgcount = lhhlgcount + 1
if close > open then
lhhlglong = lhhlglong + 1
endif
endif

//HHHLR
if hh and hl and r then
hhhlrcount = hhhlrcount + 1
if close > open then
hhhlrlong = hhhlrlong + 1
endif
endif

//LHLLR
if lh and ll and r then
lhllrcount = lhllrcount + 1
if close > open then
lhllrlong = lhllrlong + 1
endif
endif

//HHLLR
if hh and ll and r then
hhllrcount = hhllrcount + 1
if close > open then
hhllrlong = hhllrlong + 1
endif
endif

//LHHLR
if lh and hl and r then
lhhlrcount = lhhlrcount + 1
if close > open then
lhhlrlong = lhhlrlong + 1
endif
endif

//G
if g then
gcount = gcount + 1
if close > open then
glong = glong + 1
endif
endif

//R
if r then
rcount = rcount + 1
if close > open then
rlong = rlong + 1
endif
endif

hhrate = round((hhlong/hhcount) * 1000) / 10
llrate = round((lllong/llcount) * 1000) / 10
lhrate = round((lhlong/lhcount) * 1000) / 10
hlrate = round((hllong/hlcount) * 1000) / 10
hhhlrate = round((hhhllong/hhhlcount) * 1000) / 10
lhllrate = round((lhlllong/lhllcount) * 1000) / 10
hhllrate = round((hhlllong/hhllcount) * 1000) / 10
lhhlrate = round((lhhllong/lhhlcount) * 1000) / 10
hhgrate = round((hhglong/hhgcount) * 1000) / 10
llgrate = round((llglong/llgcount) * 1000) / 10
hhrrate = round((hhrlong/hhrcount) * 1000) / 10
llrrate = round((llrlong/llrcount) * 1000) / 10
lhgrate = round((lhglong/lhgcount) * 1000) / 10
hlgrate = round((hlglong/hlgcount) * 1000) / 10
lhrrate = round((lhrlong/lhrcount) * 1000) / 10
hlrrate = round((hlrlong/hlrcount) * 1000) / 10

hhhlgrate = round((hhhlglong/hhhlgcount) * 1000) / 10
lhllgrate = round((lhllglong/lhllgcount) * 1000) / 10
hhllgrate = round((hhllglong/hhllgcount) * 1000) / 10
lhhlgrate = round((lhhlglong/lhhlgcount) * 1000) / 10
hhhlrrate = round((hhhlrlong/hhhlrcount) * 1000) / 10
lhllrrate = round((lhllrlong/lhllrcount) * 1000) / 10
hhllrrate = round((hhllrlong/hhllrcount) * 1000) / 10
lhhlrrate = round((lhhlrlong/lhhlrcount) * 1000) / 10
grate = round((glong/gcount) * 1000) / 10
rrate = round((rlong/rcount) * 1000) / 10

shhrate = 100 - hhrate
sllrate = 100 - llrate
slhrate = 100 - lhrate
shlrate = 100 - hlrate
shhhlrate = 100 - hhhlrate
slhllrate = 100 - lhllrate
shhllrate = 100 - hhllrate
slhhlrate = 100 - lhhlrate
shhgrate = 100 - hhgrate
sllgrate = 100 - llgrate
shhrrate = 100 - hhrrate
sllrrate = 100 - llrrate
slhgrate = 100 - lhgrate
shlgrate = 100 - hlgrate
slhrrate = 100 - lhrrate
shlrrate = 100 - hlrrate
shhhlgrate = 100 - hhhlgrate
slhllgrate = 100 - lhllgrate
shhllgrate = 100 - hhllgrate
slhhlgrate = 100 - lhhlgrate
shhhlrrate = 100 - hhhlrrate
slhllrrate = 100 - lhllrrate
shhllrrate = 100 - hhllrrate
slhhlrrate = 100 - lhhlrrate
sgrate = 100 - grate
srrate = 100 - rrate


marketcount = marketcount + 1
if close > open then
marketlong = marketlong + 1
endif

marketrate = round((marketlong/marketcount) * 1000) / 10
endif

hhnow = high > high[1]
llnow = low < low[1]
hlnow = low > low[1]
lhnow = high < high[1]
gnow = close > open
rnow = close < open

if marketrate >= 50 then
DRAWTEXT("Market ▲#marketrate#", barindex, 6, SansSerif,Bold,10) COLOURED(0,128,0)
else
DRAWTEXT("Market ▼#marketrate#", barindex, 6, SansSerif,Bold,10) COLOURED(128,0,0)
endif

uptotal = 0
downtotal = 0

if gnow then
DRAWTEXT("Green ▲#grate#", barindex, 4, SansSerif,Bold,10) COLOURED(0,128,0)
uptotal = uptotal + grate
DRAWTEXT("Green ▼#sgrate#", barindex, 3, SansSerif,Bold,10) COLOURED(128,0,0)
downtotal = downtotal + sgrate
endif

if rnow then
DRAWTEXT("Red ▲#rrate#", barindex, 4, SansSerif,Bold,10) COLOURED(0,128,0)
uptotal = uptotal + rrate
DRAWTEXT("Red ▼#srrate#", barindex, 3, SansSerif,Bold,10) COLOURED(128,0,0)
downtotal = downtotal + srrate
endif


if hhnow then
DRAWTEXT("HH ▲#hhrate#", barindex, 1, SansSerif,Bold,10) COLOURED(0,128,0)
uptotal = uptotal + hhrate
DRAWTEXT("HH ▼#shhrate#", barindex, 0, SansSerif,Bold,10) COLOURED(128,0,0)
downtotal = downtotal + shhrate
endif

if lhnow then
DRAWTEXT("LH ▲#lhrate#", barindex, 1, SansSerif,Bold,10) COLOURED(0,128,0)
uptotal = uptotal + lhrate
DRAWTEXT("LH ▼#slhrate#", barindex, 0, SansSerif,Bold,10) COLOURED(128,0,0)
downtotal = downtotal + slhrate
endif

if llnow then
DRAWTEXT("LL ▲#llrate#", barindex, -2, SansSerif,Bold,10) COLOURED(0,128,0)
uptotal = uptotal + llrate
DRAWTEXT("LL ▼#sllrate#", barindex, -3, SansSerif,Bold,10) COLOURED(128,0,0)
downtotal = downtotal + sllrate
endif

if hlnow then
DRAWTEXT("HL ▲#hlrate#", barindex, -2, SansSerif,Bold,10) COLOURED(0,128,0)
uptotal = uptotal + hlrate
DRAWTEXT("HL ▼#shlrate#", barindex, -3, SansSerif,Bold,10) COLOURED(128,0,0)
downtotal = downtotal + shlrate
endif


if hhnow and hlnow then
DRAWTEXT("HHHL ▲#hhhlrate#", barindex, -5, SansSerif,Bold,10) COLOURED(0,128,0)
uptotal = uptotal + hhhlrate
DRAWTEXT("HHHL ▼#shhhlrate#", barindex, -6, SansSerif,Bold,10) COLOURED(128,0,0)
downtotal = downtotal + shhhlrate
endif

if lhnow and llnow then
DRAWTEXT("LHLL ▲#lhllrate#", barindex, -5, SansSerif,Bold,10) COLOURED(0,128,0)
uptotal = uptotal + lhllrate
DRAWTEXT("LHLL ▼#slhllrate#", barindex, -6, SansSerif,Bold,10) COLOURED(128,0,0)
downtotal = downtotal + slhllrate
endif

if hhnow and llnow then
DRAWTEXT("HHLL ▲#hhllrate#", barindex, -5, SansSerif,Bold,10) COLOURED(0,128,0)
uptotal = uptotal + hhllrate
DRAWTEXT("HHLL ▼#shhllrate#", barindex, -6, SansSerif,Bold,10) COLOURED(128,0,0)
downtotal = downtotal + shhllrate
endif

if lhnow and hlnow then
DRAWTEXT("LHHL ▲#lhhlrate#", barindex, -5, SansSerif,Bold,10) COLOURED(0,128,0)
uptotal = uptotal + lhllrate
DRAWTEXT("LHHL ▼#slhhlrate#", barindex, -6, SansSerif,Bold,10) COLOURED(128,0,0)
downtotal = downtotal + slhhlrate
endif


if hhnow and gnow then
DRAWTEXT("HH G ▲#hhgrate#", barindex, -8, SansSerif,Bold,10) COLOURED(0,128,0)
uptotal = uptotal + hhgrate
DRAWTEXT("HH G ▼#shhgrate#", barindex, -9, SansSerif,Bold,10) COLOURED(128,0,0)
downtotal = downtotal + shhgrate
endif

if hhnow and rnow then
DRAWTEXT("HH R ▲#hhrrate#", barindex, -8, SansSerif,Bold,10) COLOURED(0,128,0)
uptotal = uptotal + hhrrate
DRAWTEXT("HH R ▼#shhrrate#", barindex, -9, SansSerif,Bold,10) COLOURED(128,0,0)
downtotal = downtotal + shhrrate
endif

if lhnow and gnow then
DRAWTEXT("LH G ▲#lhgrate#", barindex, -8, SansSerif,Bold,10) COLOURED(0,128,0)
uptotal = uptotal + lhgrate
DRAWTEXT("LH G ▼#slhgrate#", barindex, -9, SansSerif,Bold,10) COLOURED(128,0,0)
downtotal = downtotal + slhgrate
endif

if lhnow and rnow then
DRAWTEXT("LH R ▲#lhrrate#", barindex, -8, SansSerif,Bold,10) COLOURED(0,128,0)
uptotal = uptotal + lhrrate
DRAWTEXT("LH R ▼#slhrrate#", barindex, -9, SansSerif,Bold,10) COLOURED(128,0,0)
downtotal = downtotal + slhrrate
endif

if llnow and gnow then
DRAWTEXT("LL G ▲#llgrate#", barindex, -11, SansSerif,Bold,10) COLOURED(0,128,0)
uptotal = uptotal + llgrate
DRAWTEXT("LL G ▼#sllgrate#", barindex, -12, SansSerif,Bold,10) COLOURED(128,0,0)
downtotal = downtotal + sllgrate
endif

if llnow and rnow then
DRAWTEXT("LL R ▲#llrrate#", barindex, -11, SansSerif,Bold,10) COLOURED(0,128,0)
uptotal = uptotal + llrrate
DRAWTEXT("LL R ▼#sllrrate#", barindex, -12, SansSerif,Bold,10) COLOURED(128,0,0)
downtotal = downtotal + sllrrate
endif

if hlnow and gnow then
DRAWTEXT("HL G ▲#hlgrate#", barindex, -11, SansSerif,Bold,10) COLOURED(0,128,0)
uptotal = uptotal + hlgrate
DRAWTEXT("HL G ▼#shlgrate#", barindex, -12, SansSerif,Bold,10) COLOURED(128,0,0)
downtotal = downtotal + shlgrate
endif

if hlnow and rnow then
DRAWTEXT("HL R ▲#hlrrate#", barindex, -11, SansSerif,Bold,10) COLOURED(0,128,0)
uptotal = uptotal + hlrrate
DRAWTEXT("HL R ▼#shlrrate#", barindex, -12, SansSerif,Bold,10) COLOURED(128,0,0)
downtotal = downtotal + shlrrate
endif

if hhnow and hlnow and gnow then
DRAWTEXT("HHHL G ▲#hhhlgrate#", barindex, -14, SansSerif,Bold,10) COLOURED(0,128,0)
uptotal = uptotal + hhhlgrate
DRAWTEXT("HHHL G ▼#shhhlgrate#", barindex, -15, SansSerif,Bold,10) COLOURED(128,0,0)
downtotal = downtotal + shhhlgrate
endif

if lhnow and llnow and gnow then
DRAWTEXT("LHLL G ▲#lhllgrate#", barindex, -14, SansSerif,Bold,10) COLOURED(0,128,0)
uptotal = uptotal + lhllgrate
DRAWTEXT("LHLL G ▼#slhllgrate#", barindex, -15, SansSerif,Bold,10) COLOURED(128,0,0)
downtotal = downtotal + slhllgrate
endif

if hhnow and llnow and gnow then
DRAWTEXT("HHLL G ▲#hhllgrate#", barindex, -14, SansSerif,Bold,10) COLOURED(0,128,0)
uptotal = uptotal + hhllgrate
DRAWTEXT("HHLL G ▼#shhllgrate#", barindex, -15, SansSerif,Bold,10) COLOURED(128,0,0)
downtotal = downtotal + shhllgrate
endif

if lhnow and hlnow and gnow then
DRAWTEXT("LHHL G ▲#lhhlgrate#", barindex, -14, SansSerif,Bold,10) COLOURED(0,128,0)
uptotal = uptotal + lhhlgrate
DRAWTEXT("LHHL G ▼#slhhlgrate#", barindex, -15, SansSerif,Bold,10) COLOURED(128,0,0)
downtotal = downtotal + slhhlgrate
endif

if hhnow and hlnow and rnow then
DRAWTEXT("HHHL R ▲#hhhlrrate#", barindex, -14, SansSerif,Bold,10) COLOURED(0,128,0)
uptotal = uptotal + hhhlrrate
DRAWTEXT("HHHL R ▼#shhhlrrate#", barindex, -15, SansSerif,Bold,10) COLOURED(128,0,0)
downtotal = downtotal + shhhlrrate
endif

if lhnow and llnow and rnow then
DRAWTEXT("LHLL R ▲#lhllrrate#", barindex, -14, SansSerif,Bold,10) COLOURED(0,128,0)
uptotal = uptotal + lhllrrate
DRAWTEXT("LHLL R ▼#slhllrrate#", barindex, -15, SansSerif,Bold,10) COLOURED(128,0,0)
downtotal = downtotal + slhllrrate
endif

if hhnow and llnow and rnow then
DRAWTEXT("HHLL R ▲#hhllrrate#", barindex, -14, SansSerif,Bold,10) COLOURED(0,128,0)
uptotal = uptotal + hhllrrate
DRAWTEXT("HHLL R ▼#shhllrrate#", barindex, -15, SansSerif,Bold,10) COLOURED(128,0,0)
downtotal = downtotal + shhllrrate
endif

if lhnow and hlnow and rnow then
DRAWTEXT("LHHL R ▲#lhhlrrate#", barindex, -14, SansSerif,Bold,10) COLOURED(0,128,0)
uptotal = uptotal + lhhlrrate
DRAWTEXT("LHHL R ▼#slhhlrrate#", barindex, -15, SansSerif,Bold,10) COLOURED(128,0,0)
downtotal = downtotal + slhhlrrate
endif

upavg = round((uptotal / 7) * 10) / 10
downavg = round((downtotal / 7) * 10) / 10

DRAWTEXT("Avg % ▲#upavg#", barindex, -17, SansSerif,Bold,10) COLOURED(0,128,0)
DRAWTEXT("Avg % ▼#downavg#", barindex, -18, SansSerif,Bold,10) COLOURED(128,0,0)

if upavg > downavg then
Difference = (upavg - downavg)
DRAWTEXT("Avg Diff ▲#difference#", barindex, -20, SansSerif,Bold,10) COLOURED(0,128,0)
marketdiff = (upavg - marketrate)
else
Difference = (downavg - upavg)
DRAWTEXT("Avg Diff ▼#difference#", barindex, -20, SansSerif,Bold,10) COLOURED(128,0,0)
marketdiff = (downavg - marketrate)
endif

if marketdiff > 0 then
DRAWTEXT("Market Diff ▲#marketdiff#", barindex, -21, SansSerif,Bold,10) COLOURED(0,128,0)
else
DRAWTEXT("Market Diff ▼#marketdiff#", barindex, -21, SansSerif,Bold,10) COLOURED(128,0,0)
endif

return 5, 7, -16, -19, -22