

Index Projections
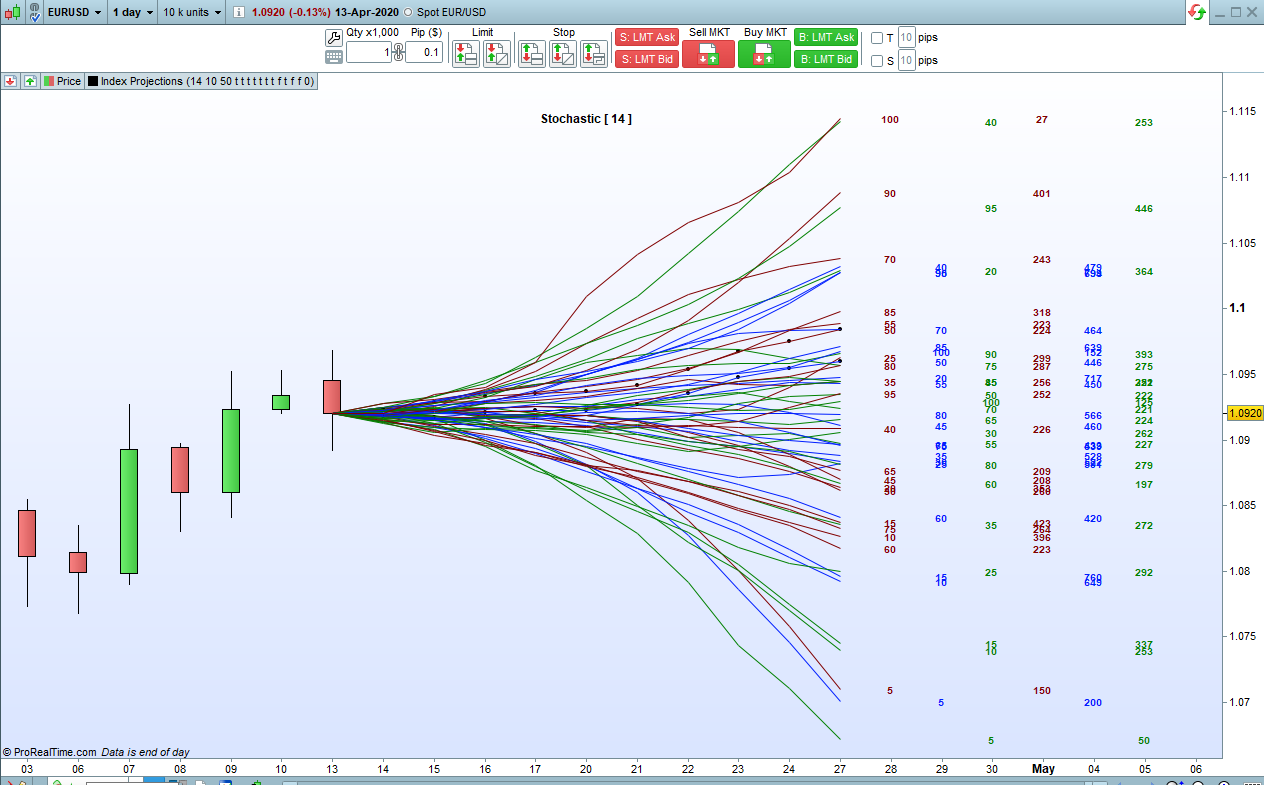
This indicator allows us to analyse four popular index indicators that return values between zero and 100 and plot lines that show the average of historical price movements following the index indicator returning any particular value.
This indicator only works on PRTv11 onwards.
The four indicators that you can analyse are:
- RSI
- Stochastic
- Williams%R
- ADX
Select whichever indicator you want to analyse with the ‘RSIndex’, ‘Stoch’, ‘WilliamsR’ and ‘ADXIndex’ settings. RSI is the default if nothing is selected. If more than one is selected then they are prioritised from bottom to top in the above list.
Set ‘p’ to whatever period of indicator you want to analyse.
The returned values for each indicator are divided into 20 different buckets. (0 to 5) then (>5 and <=10) then (>10 and <=15) and so on. These buckets are then divided into two sets of buckets for if the value was rising or if it was falling. All of history is analysed and lines calculated that show where on average price went for each bucket of returned values.
Set ‘Length’ to how many bars long you want the projection lines to be. Be warned that high values can be very slow to calculate!
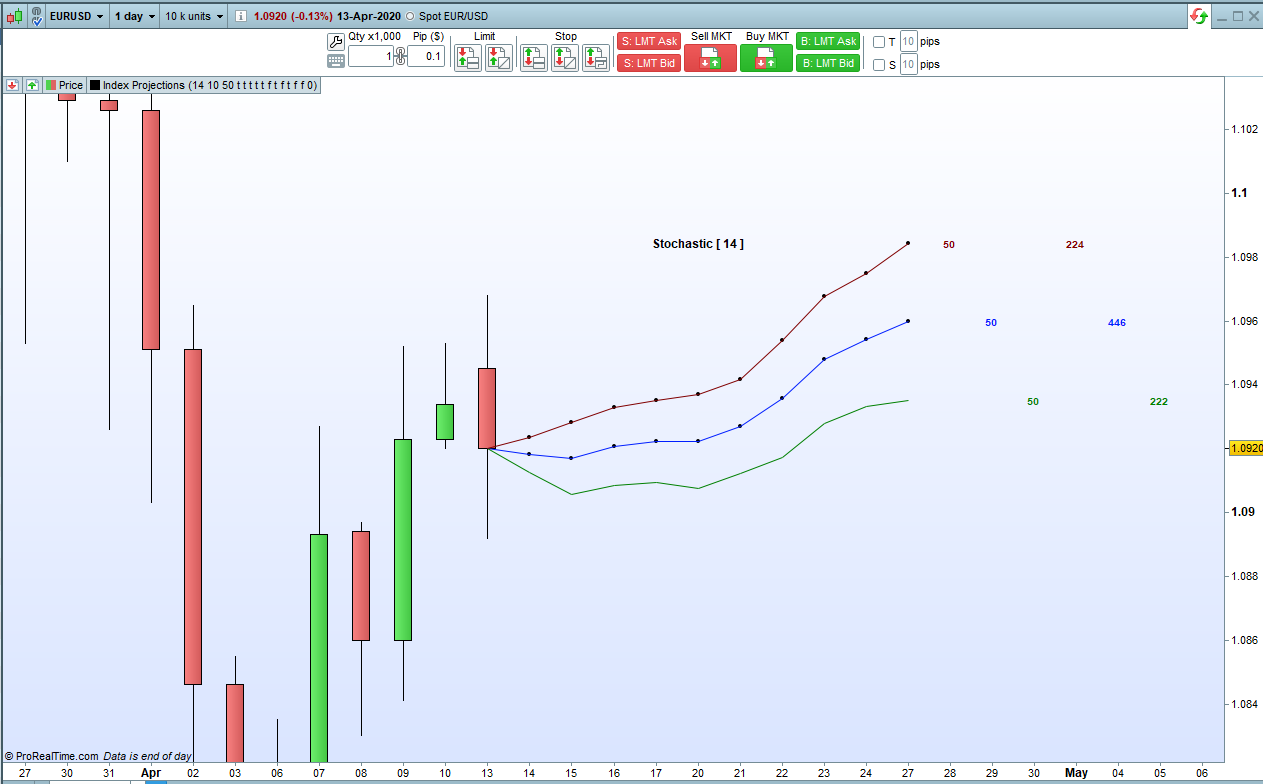
The different types of lines can be displayed or not displayed with the ‘Rising’, ‘Falling’ and ‘Both’ settings. In Auto mode (explained further down) the current candles line will always be displayed at minimum. Use the ‘AllValues’ setting combined with ‘Rising’, ‘Falling’ and ‘Both’ settings to display every possible line.
The lines are colour coded and at the end of the lines each one is labelled. The labelling is separated in to six columns for clarity. Green values are for lines where the chosen indicators returned value was rising and red are for when it was falling. The blue ones are for both combined so that is any returned value no matter whether it was rising or falling.
The right three columns of figures coloured similarly show the sample size or quantity of tests in each bucket. You can turn the display of this on or off with the ‘SampleSize’ setting.
The indicator can work in two modes’ in ‘Auto’ mode it can highlight or display only the lines that represent the current candle indicator’s current returned value. If ‘Auto’ is switched off then it will display or highlight just the lines that match your chosen ‘Value’ setting.
The highlighting of the current candles lines in auto mode or the ‘Value’ lines in non auto mode can be turned on or off with the ‘Points’ setting.
The ‘StartBack’ allows you to move the start of the projection lines back through past candles. The candle where the lines start will always be the one whose value is used when in auto mode.
As always I advise downloading and importing the indicator to get full functionality.
//Index Projections
//PRTv11
//By Vonasi
//20200414

//p = 14          //Period used in indicator.
//Value = 50      //Indicator value to display if not in auto mode.
//SampleSize = 1  //Turn on or off display of sample size.
//Auto = 1        //Turn on or off Auto mode. Auto displays and/or highlights lines for start candles indicator value.
//Rising = 1      //Display lines for indicator values that are rising.
//Falling = 1     //Display lines for indicator values that are falling.
//Both = 1        //Display lines for indicator values that are both rising or falling.
//AllValues = 1   //Display all indicator value lines.
//Points = 1      //Draw points on current value lines or 'Value' lines in non auto mode.
//RSIndex = 1     //Select RSI indicator (default).
//Stoch = 0       //Select Stochastic indicator.
//WilliamsR = 0   //Select Williams%R indicator.
//ADXIndex = 0    //Select ADX indicator.
//StartBack = 0   //Move start bar back by this quantity of bars.
//Length = 10     //Length of projection lines to be displayed.

length = min(999,length)
startback = max(1,startback)

if RSIndex or not RSIndex then
rise = rsi[p][startback-1] >= rsi[p][startback]
fall = rsi[p][startback-1] < rsi[p][startback]
indvalue = rsi[p][startback-1]
neg = 0
endif

if stoch then
rise = stochastic[p,3][startback-1] >= stochastic[p,3][startback]
fall = stochastic[p,3][startback-1] < stochastic[p,3][startback]
indvalue = stochastic[p,3][startback-1]
endif

if williamsr then
rise = williams[p][startback-1] >= williams[p][startback]
fall = williams[p][startback-1] < williams[p][startback]
indvalue = abs(williams[p][startback-1])
neg = 1
endif

if adxindex then
rise = adx[p][startback-1] >= adx[p][startback]
fall = adx[p][startback-1] < adx[p][startback]
indvalue = adx[p][startback-1]
endif

array = (ceil(indvalue/5)*5)

if array[length] >=5 and barindex > length then
for b = 1 to length
bb = (array[length]*1000)+b
if (not auto and rising) or auto or allvalues then
if rise[length] then
$gainlossrise[bb] = $gainlossrise[bb] + ((close[length-b]-close[length])/close[length])
$countrise[bb] = $countrise[bb] + 1
$avgrise[bb] = $gainlossrise[bb]/$countrise[bb]
endif
endif

if (not auto and falling) or auto or allvalues then
if fall[length] then
$gainlossfall[bb] = $gainlossfall[bb] + ((close[length-b]-close[length])/close[length])
$countfall[bb] = $countfall[bb] + 1
$avgfall[bb] = $gainlossfall[bb]/$countfall[bb]
endif
endif

if both or allvalues then
$gainloss[bb] = $gainloss[bb] + ((close[length-b]-close[length])/close[length])
$count[bb] = $count[bb] + 1
$avg[bb] = $gainloss[bb]/$count[bb]
endif
next
$allcount[array[length]*1000] = $allcount[array[length]*1000]+1
if rise[length] then
$allcountrise[array[length]*1000] = $allcountrise[array[length]*1000]+1
endif
if fall[length] then
$allcountfall[array[length]*1000] = $allcountfall[array[length]*1000]+1
endif
endif

if islastbarupdate then
maxval = 0
for x = 1 to 20
if not auto then
myarray = (ceil(value/5)*5)
endif
if auto then
myarray = array
endif
if allvalues then
myarray = x*5
endif
lasty = close[startback-1]
lastry = close[startback-1]
lastfy = close[startback-1]
for b = 1 to length
bb = (myarray*1000)+b
if (auto and both) or (allvalues and both) then
if isset($avg[bb]) then
gain = $avg[bb]*close
if (auto and points and array = myarray) or (not auto and points and (ceil(value/5)*5) = myarray) then
drawpoint(barindex+b-(startback-1),lasty+gain,1)
endif
drawsegment(barindex+b-1-(startback-1),lasty,barindex+b-(startback-1),lasty+gain)coloured(0,30,255)
lasty = lasty+gain
allcount = $allcount[bb-b]
maxval = max(maxval,lasty)
endif
endif

if (not auto and rising) or (auto and rise) or (allvalues and rising) or (auto and rising) then
if isset($avgrise[bb]) then
gainr = $avgrise[bb]*close
if (auto and rise and points and array = myarray) or (not auto and points and (ceil(value/5)*5) = myarray) then
drawpoint(barindex+b-(startback-1),lastry+gainr,1)
endif
drawsegment(barindex+b-1-(startback-1),lastry,barindex+b-(startback-1),lastry+gainr)coloured(0,128,0)
lastry = lastry+gainr
allcountrise = $allcountrise[bb-b]
maxval = max(maxval,lastry)
endif
endif

if (not auto and falling) or (auto and fall) or (allvalues and falling) or (auto and falling) then
if isset($avgfall[bb]) then
gainf = $avgfall[bb]*close
if (auto and fall and points and array = myarray) or (not auto and points and (ceil(value/5)*5) = myarray) then
drawpoint(barindex+b-(startback-1),lastfy+gainf,1)
endif
drawsegment(barindex+b-1-(startback-1),lastfy,barindex+b-(startback-1),lastfy+gainf)coloured(128,0,0)
lastfy = lastfy+gainf
allcountfall = $allcountfall[bb-b]
maxval = max(maxval,lastfy)
endif
endif
next
if isset($avg[bb]) and ((both and allvalues) or (auto and both)) then
x = max(barindex+1,(barindex+b-startback+1))
if not neg then
drawtext("#myarray#",x+1,lasty,sansserif,bold,10)coloured(0,30,255)
else
drawtext("-#myarray#",x+1,lasty,sansserif,bold,10)coloured(0,30,255)
endif
if samplesize then
drawtext("#allcount#",x+4,lasty,sansserif,bold,10)coloured(0,30,255)
endif
endif

if isset($avgrise[bb]) and (((auto and rise) or (rising)) or (allvalues and rising)) then
if not neg then
drawtext("#myarray#",x+2,lastry,sansserif,bold,10)coloured(0,128,0)
else
drawtext("-#myarray#",x+2,lastry,sansserif,bold,10)coloured(0,128,0)
endif
if samplesize then
drawtext("#allcountrise#",x+5,lastry,sansserif,bold,10)coloured(0,128,0)
endif
endif

if isset($avgfall[bb]) and (((auto and fall) or (falling)) or (allvalues and falling)) then
if not neg then
drawtext("#myarray#",x,lastfy,sansserif,bold,10)coloured(128,0,0)
else
drawtext("-#myarray#",x,lastfy,sansserif,bold,10)coloured(128,0,0)
endif
if samplesize then
drawtext("#allcountfall#",x+3,lastfy,sansserif,bold,10)coloured(128,0,0)
endif
endif
if not auto and not allvalues then
break
endif
next
if (rsindex and (not stoch and not williamsr and not adxindex)) or (not rsindex and not stoch and not williamsr and not adxindex) then
drawtext("RSI [ #p#]",barindex+length-startback+1-(length/2),maxval,sansserif,bold,12)coloured(0,0,0)
endif
if stoch and (not williamsr and not adxindex) then
drawtext("Stochastic [ #p#]",barindex+length-startback+1-(length/2),maxval,sansserif,bold,12)coloured(0,0,0)
endif
if williamsR and (not adxindex) then
drawtext("Wiliams%R [ #p#]",barindex+length-startback+1-(length/2),maxval,sansserif,bold,12)coloured(0,0,0)
endif
if adxindex then
drawtext("ADX [ #p#]",barindex+length-startback+1-(length/2),maxval,sansserif,bold,12)coloured(0,0,0)
endif
endif

return