is anyone else able to replicate these results?
I’d hazard a guess that others cannot even see your results!!?? 🙂
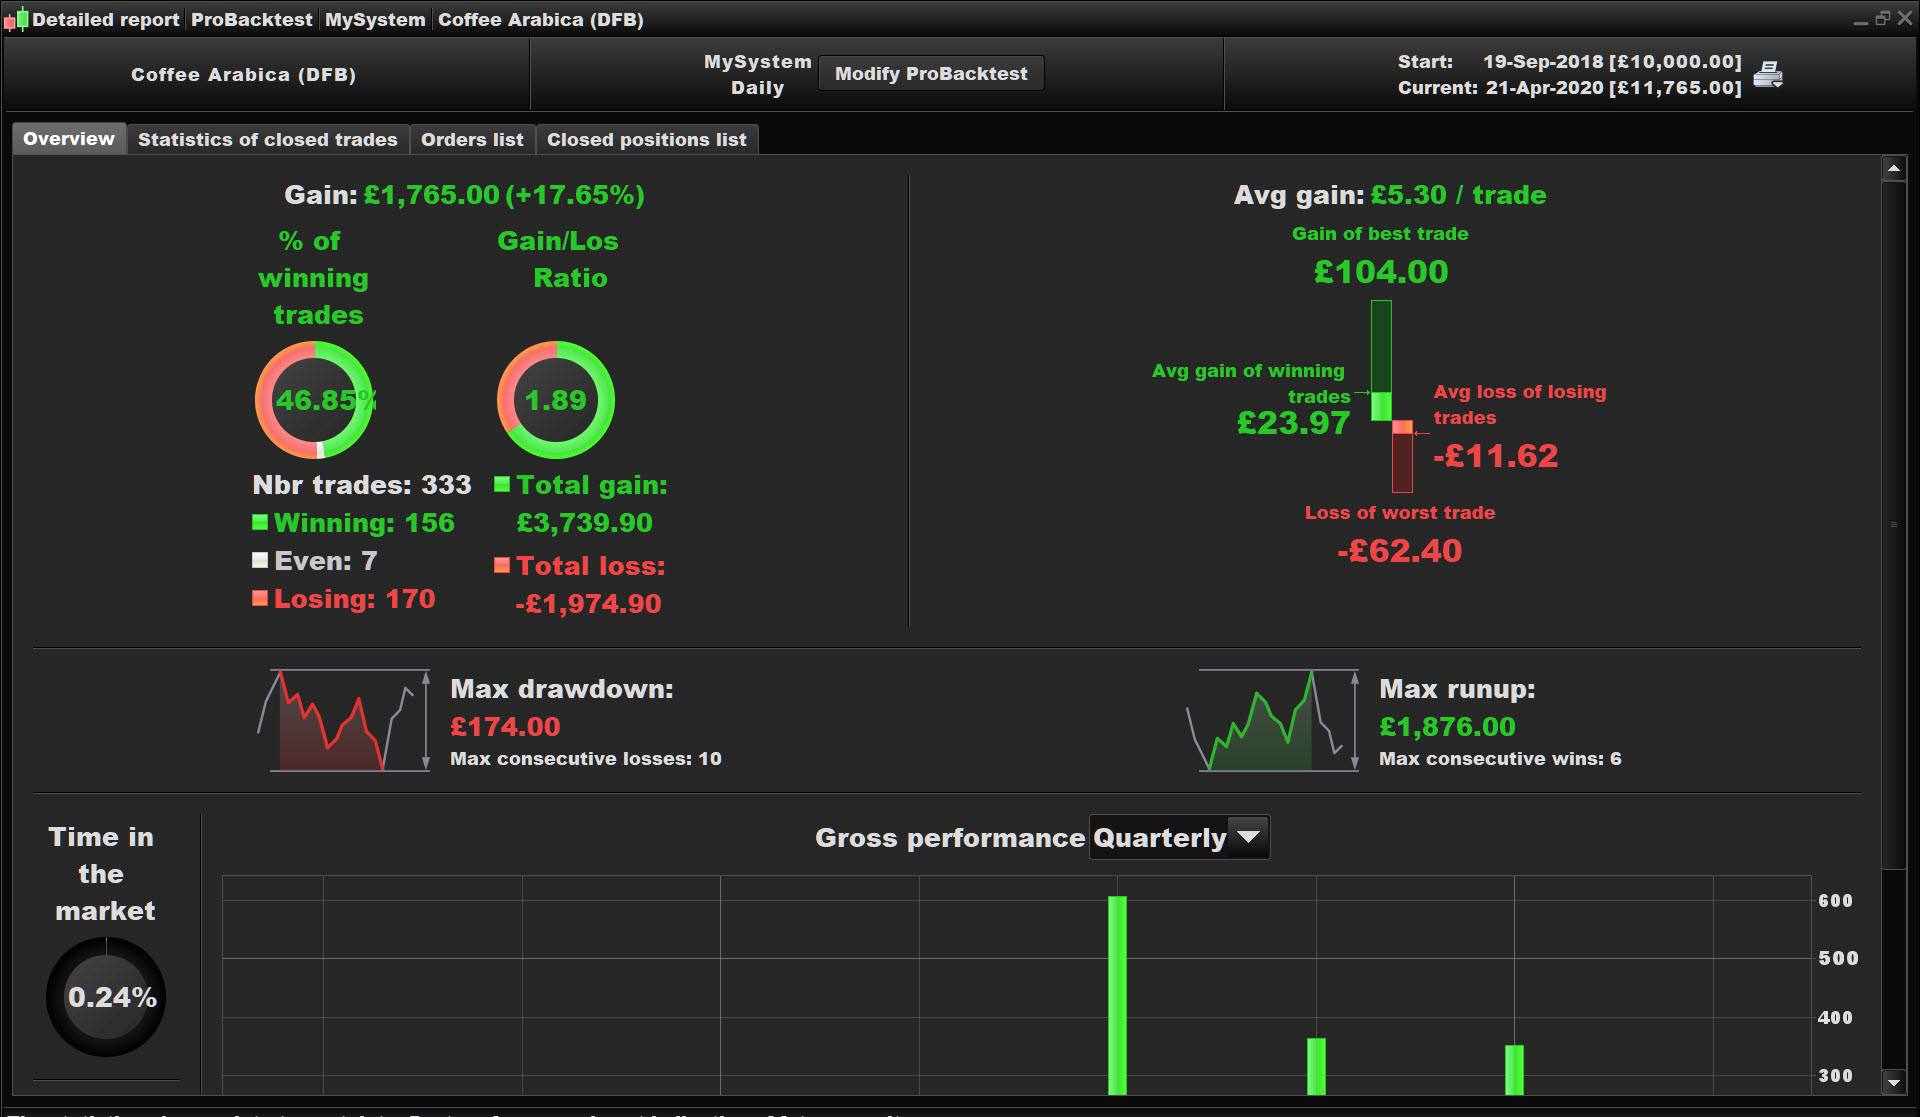
Did you not see where I suggested that you post the overview screen (not the stats screen)?
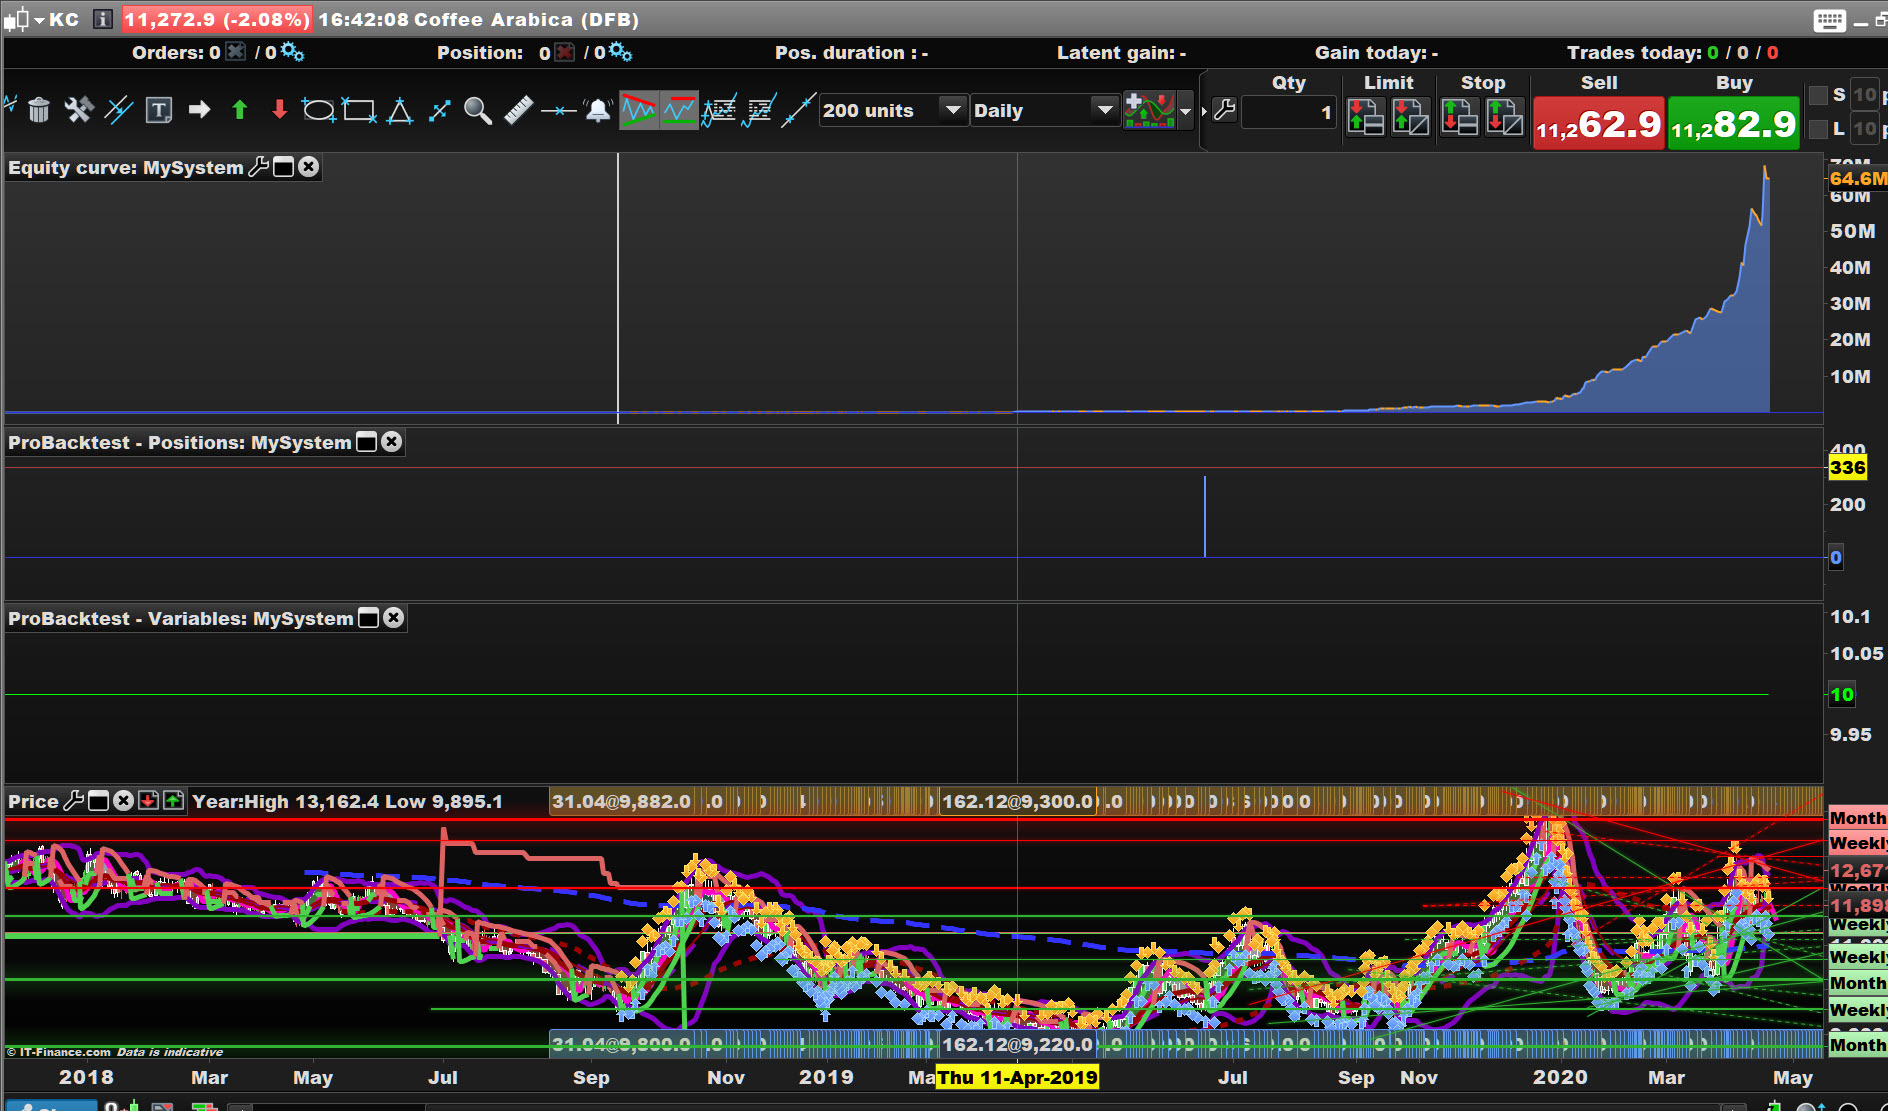
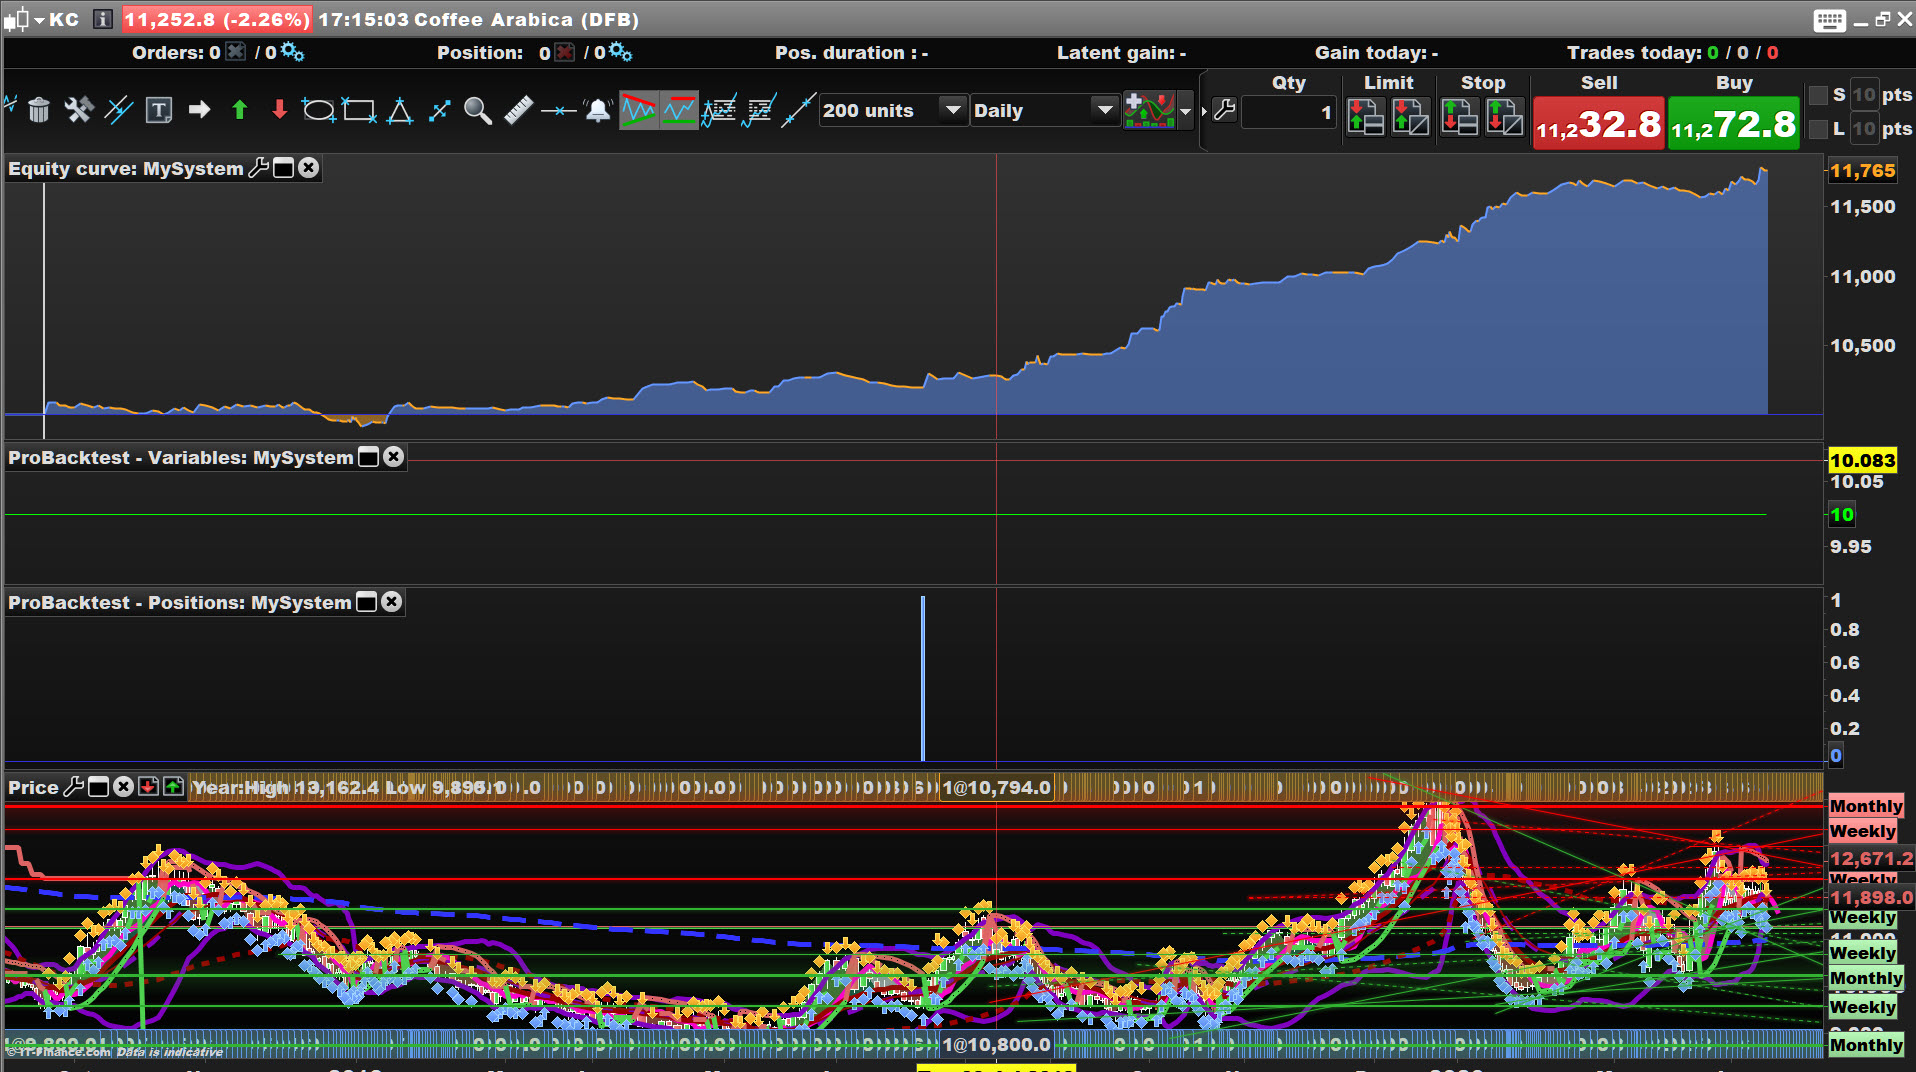
How come you show a backtest for 10000 Daily bars but the chart only goes back to 19 Sep 18?? 🙂
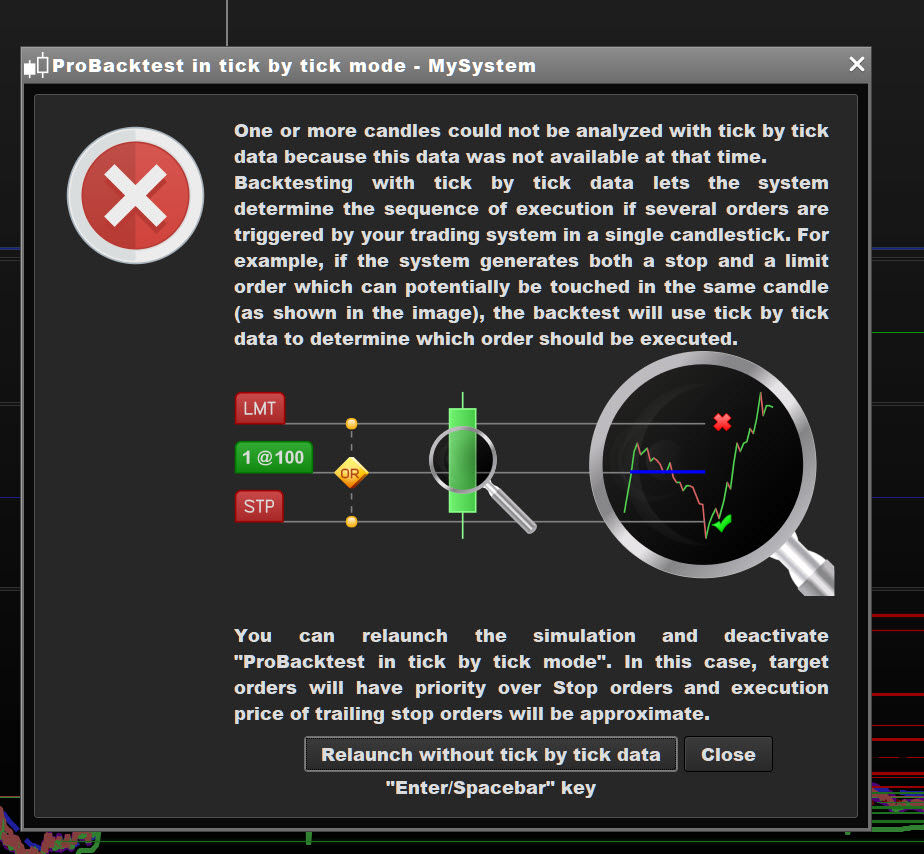
What do you do when you see the screen attached … which button do you click??
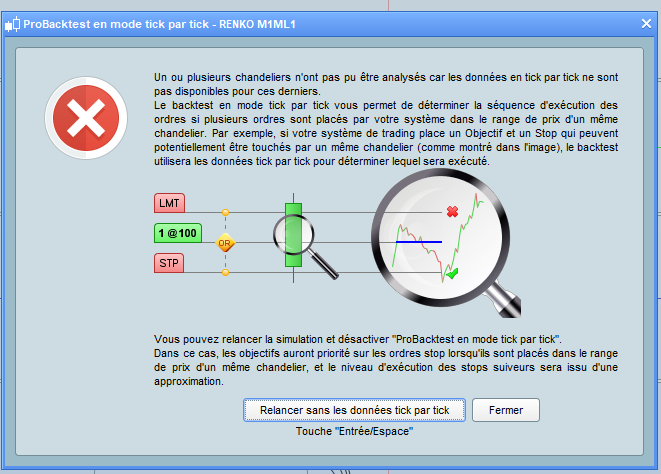
Having said above … Attached is what I get at same settings as you AND WITH Tick by Tick enabled.
So you were right all along … we are failed millionaires … we missed the boat and Vonasi is hiding from us beneath the waves after me saying we’ll have a party on his Yacht!! 🙂
So where do we go from here??
When I can get out of 3 losing trades … I’m moving onto coffee!! 🙂
I had similar results. But why does it only give 18months with tick by tick when it should be from Aug 2010? There’s something not right…
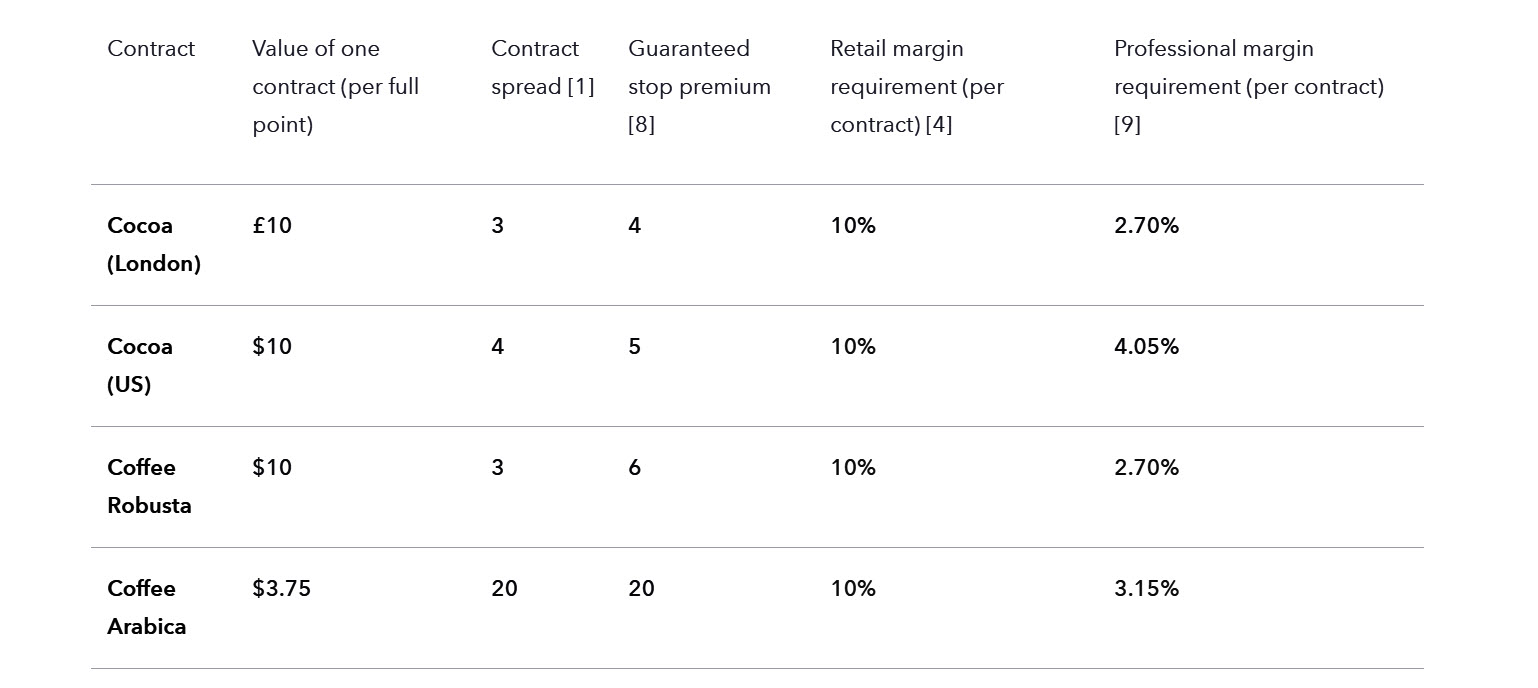
From what I can see Arabica Coffee has a spread of 20 … see attached.
So with spread = 20 and Lot size = 1 attached are the results since Sep 18 … still good!?
Now to try coffee Robusta! 🙂
EDIT / PS
Coffee Robusta with spread = 3 is no good at all … no point me posting screen shots etc.
Who would have thought 1 coffee does good and one coffee does bad!?
But why does it only give 18months with tick by tick when it should be from Aug 2010? There’s something not right…
Probably because tick data is not available for coffee before Sep 2018??
Who would have thought 1 coffee does good and one coffee does bad!?
I know why … coffee robusta is about 1/10 the price of Arabica and so the box size needs changing then it may be good to go??
Same thing for the dow jones impossible to activate tick data
I must go back to August 10, 2010
 Bard
BardParticipant
Master
Thanks for the feedback. I had written a more detailed with ” ” responses to questions/comments here but lost it because it seems that Chrome doesn’t keep a copy (accept the screenshot attachments) unlike Firefox would if you accidentally closed the tab.
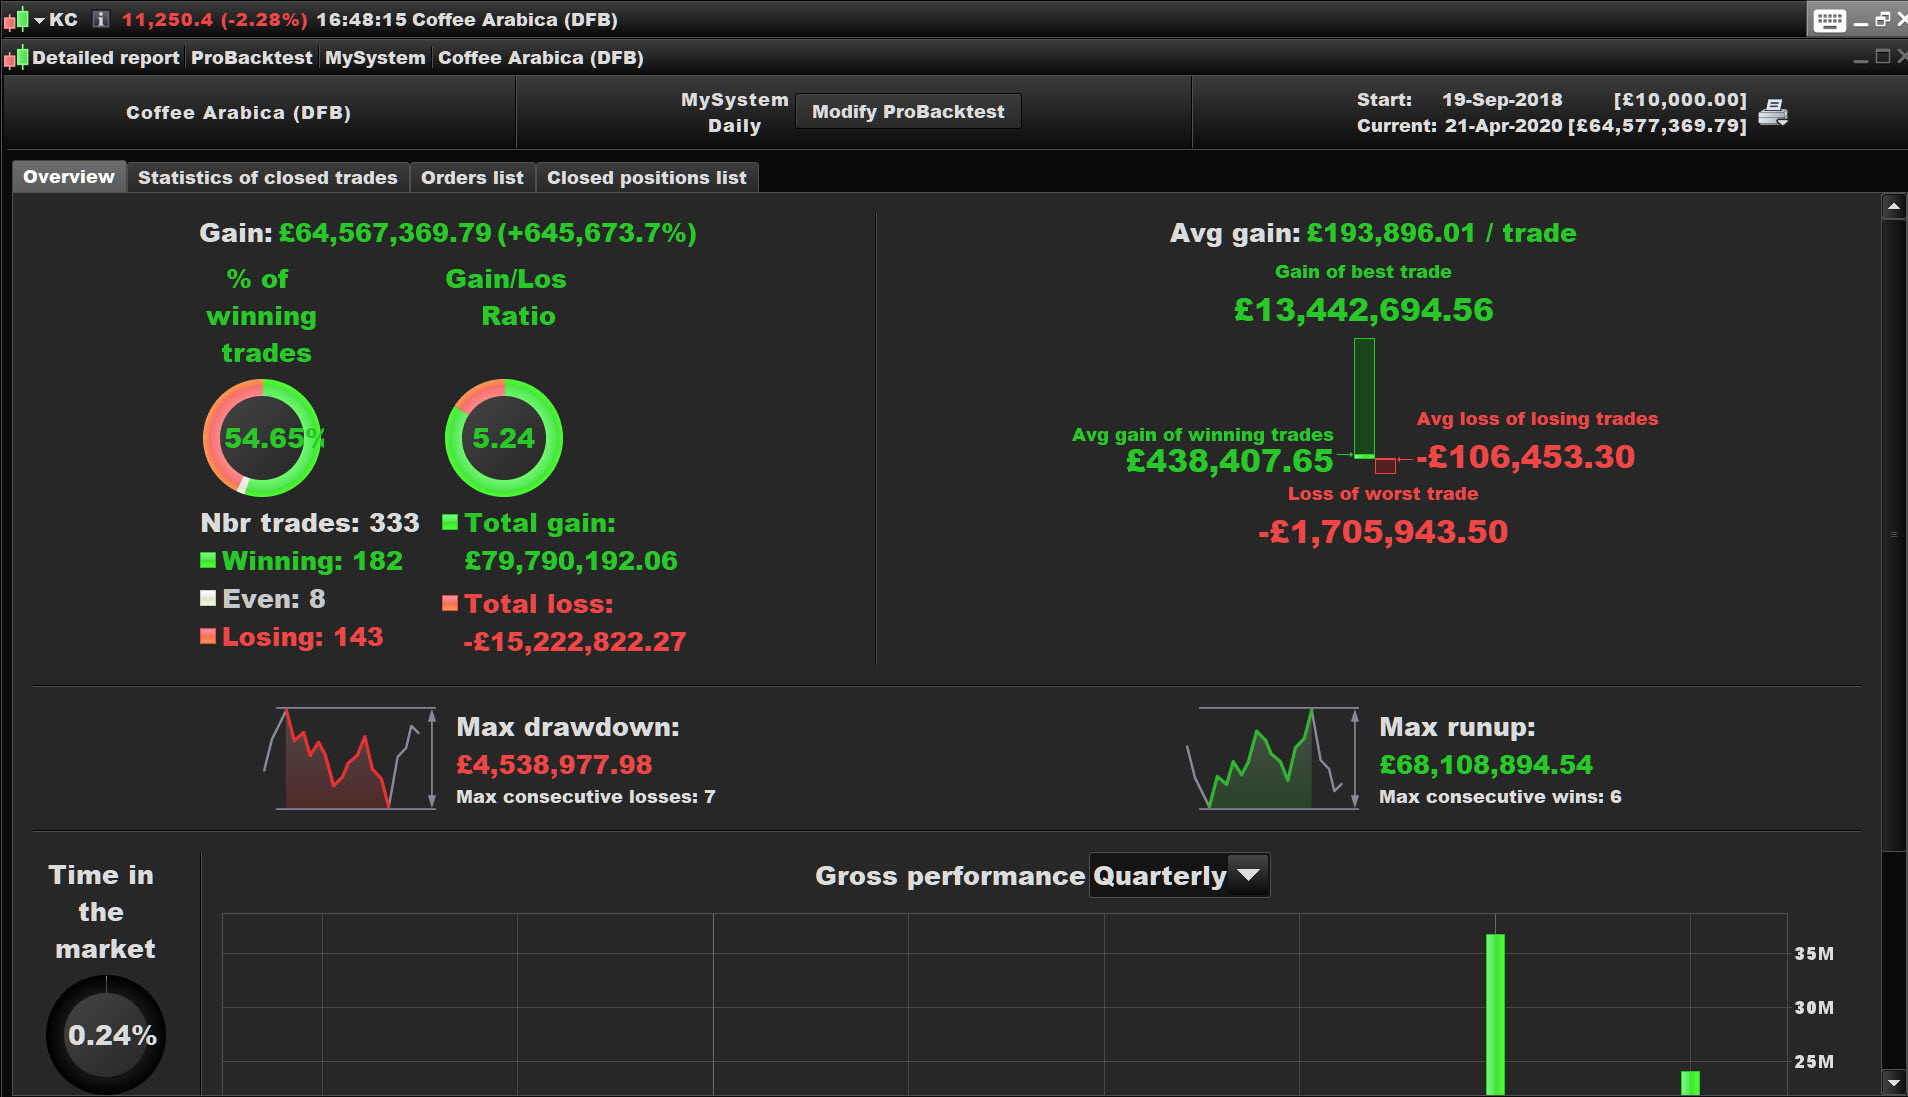
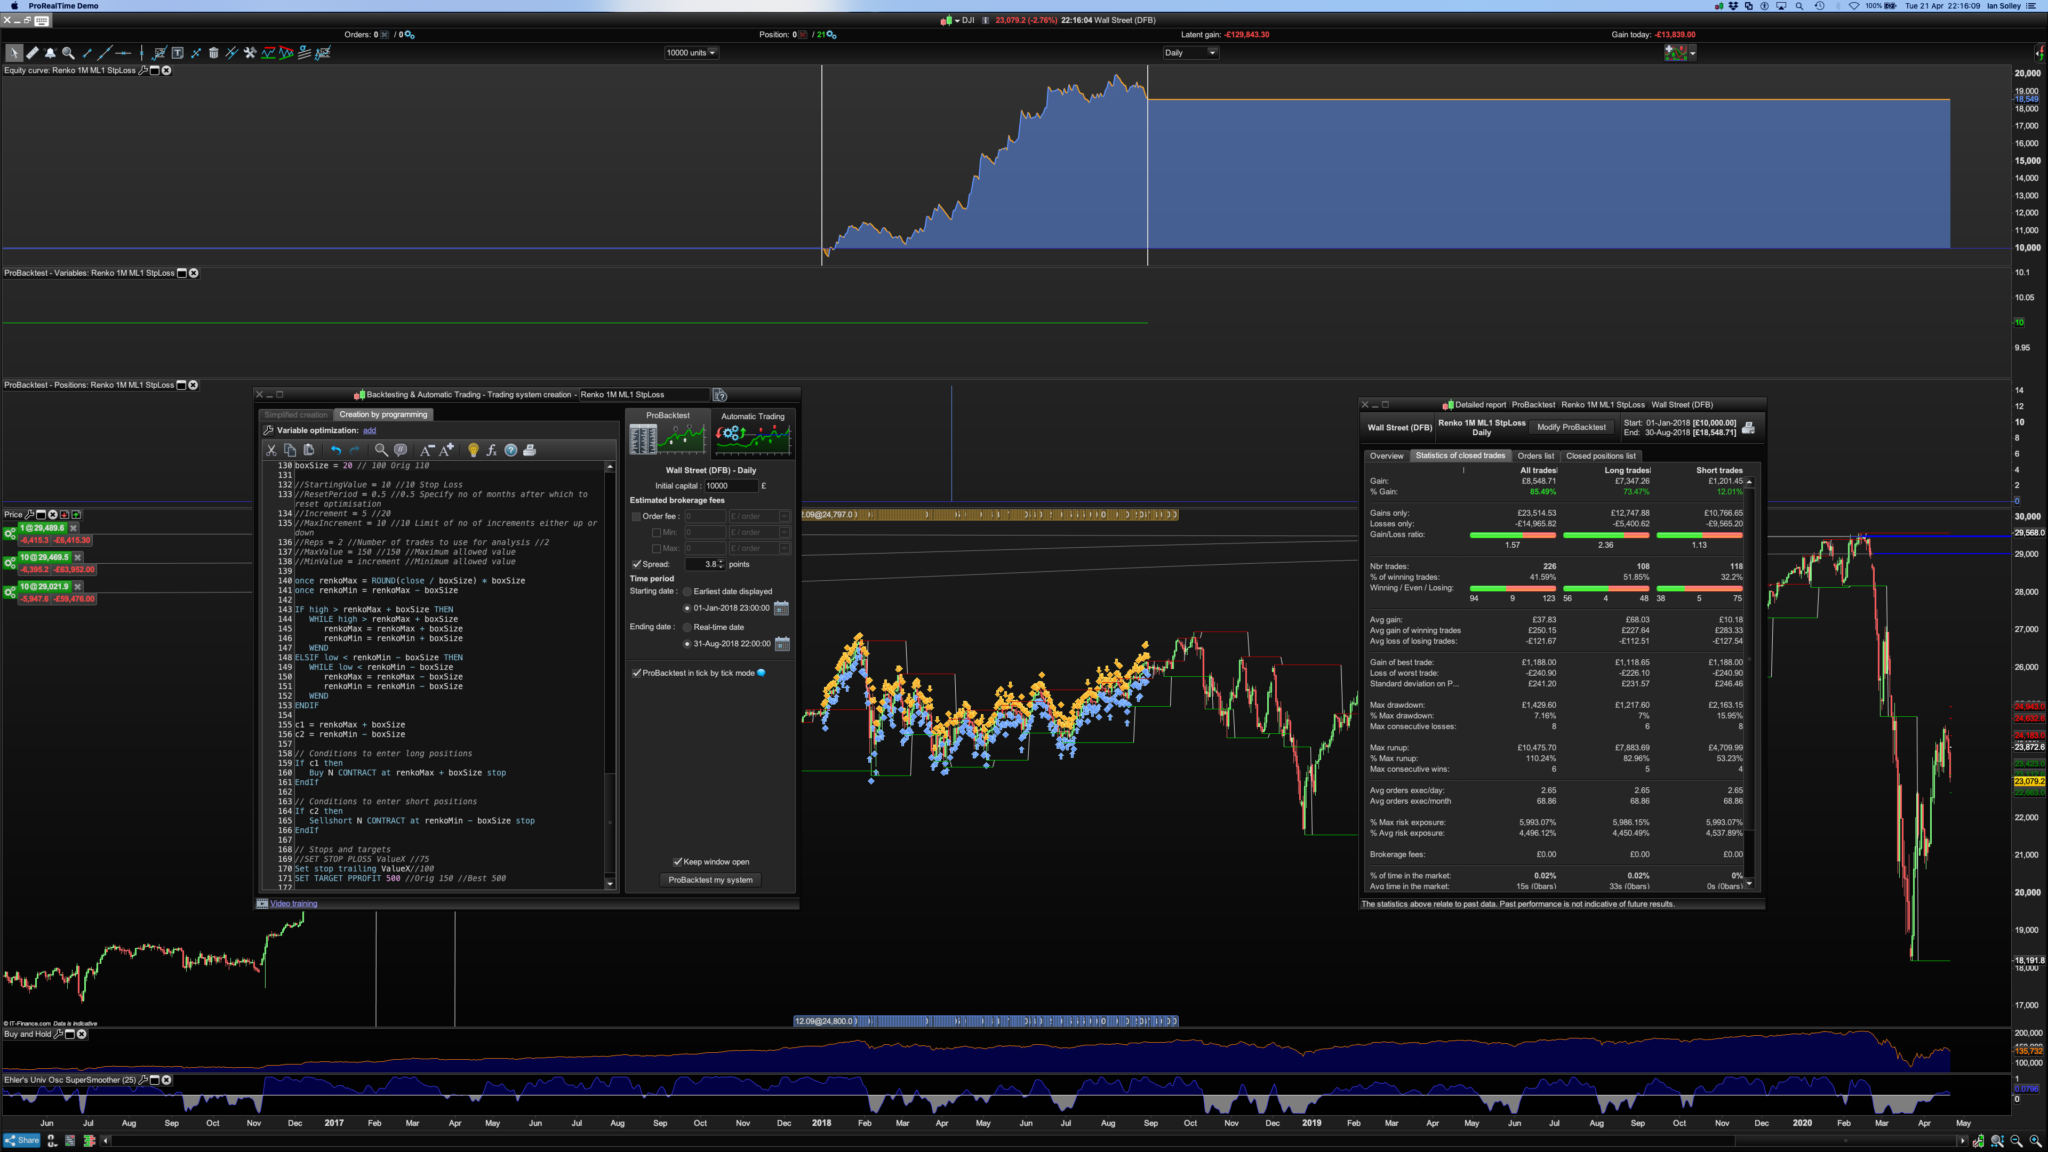
The main point is, if you use dates before the 19th Sept 2018 (which is where we/I thought the tick by tick data started from), with “tick by tick for the backtest” ticked on you still get great tick by tick results that reflect what would have happened intra bar if your entries and exits were activated within the same bar. I rarely use overview screens because they don’t show the drawdown, pls see screenshot. This tick by tick availability with KC is something I have asked IG.
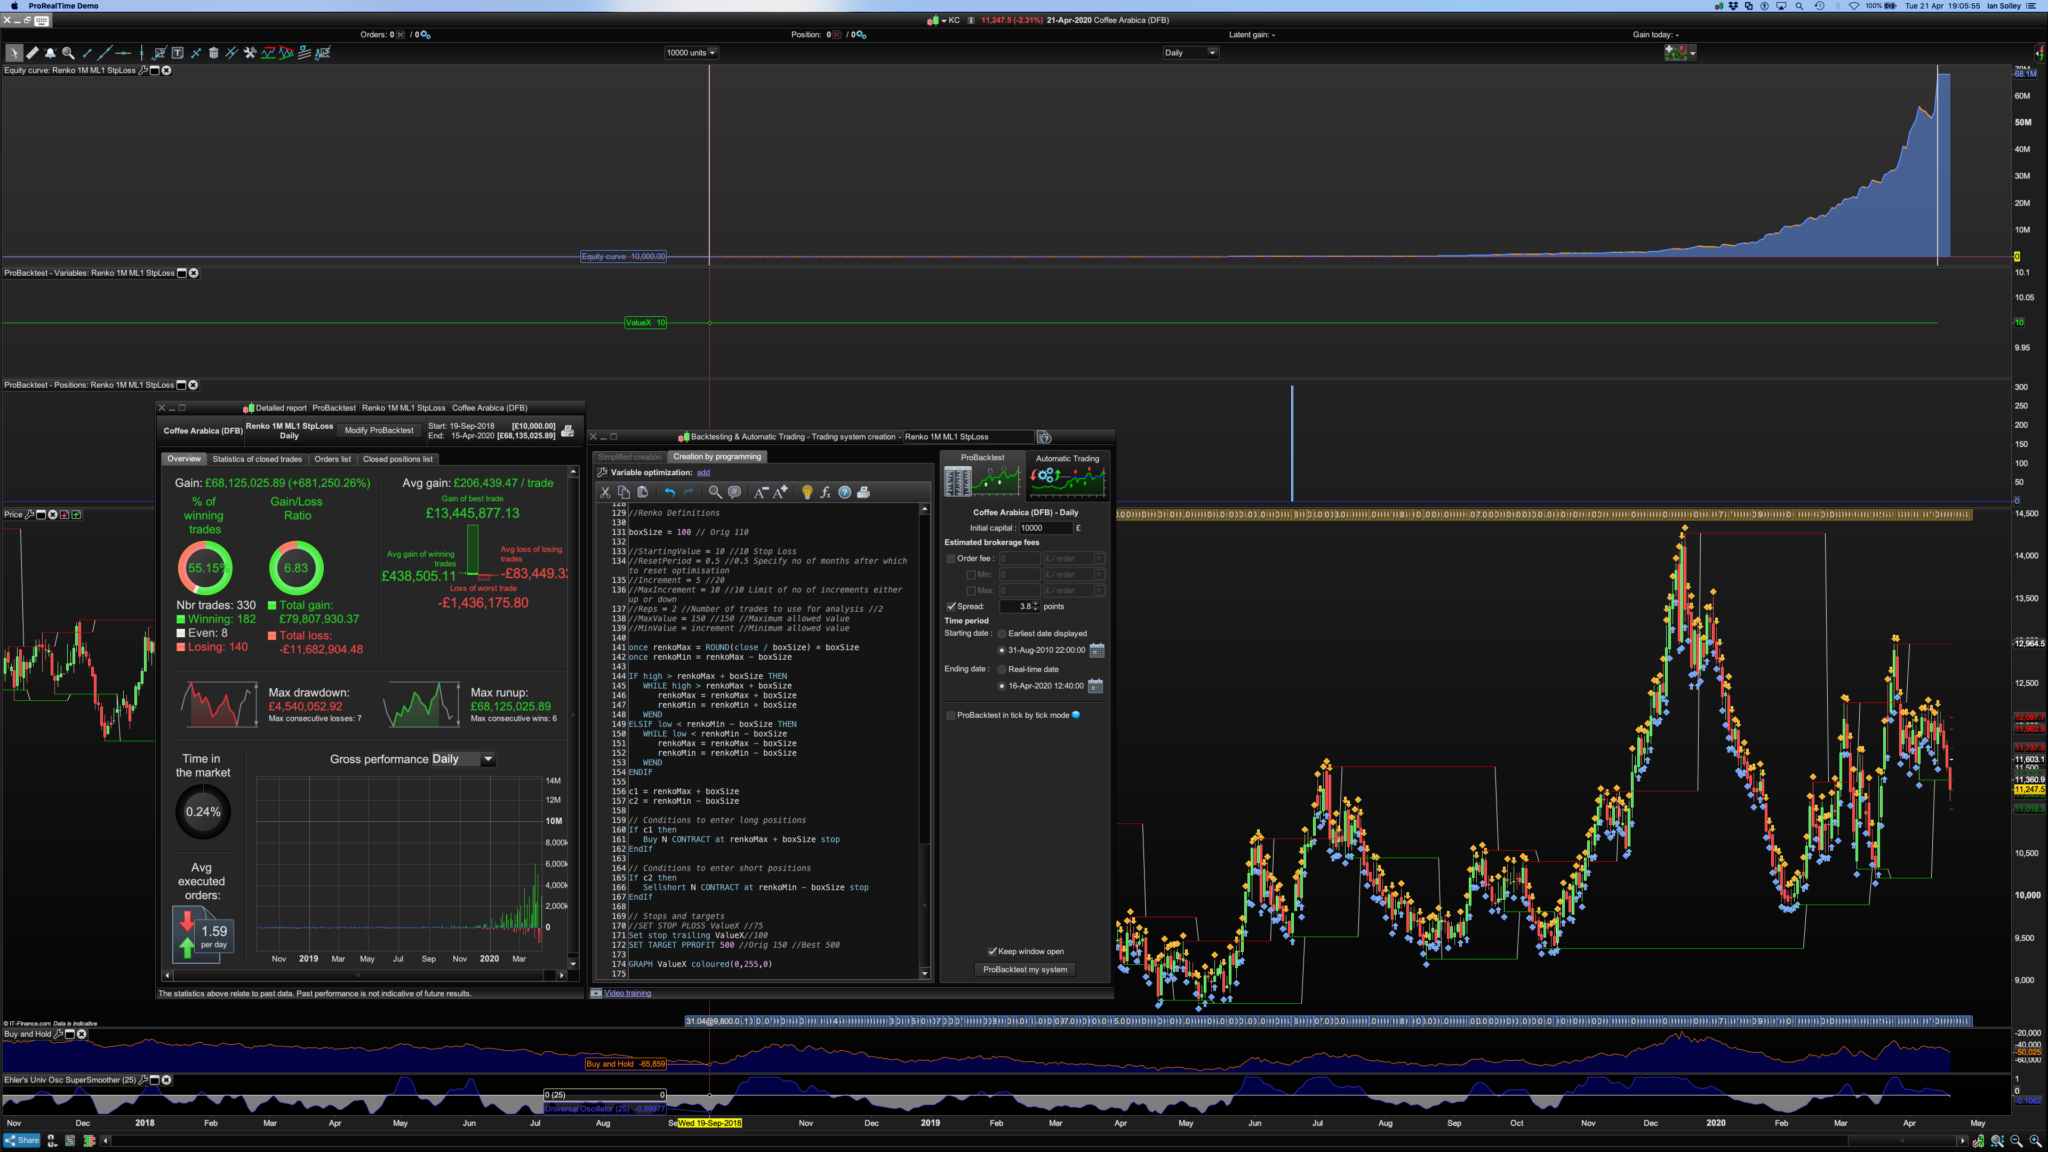
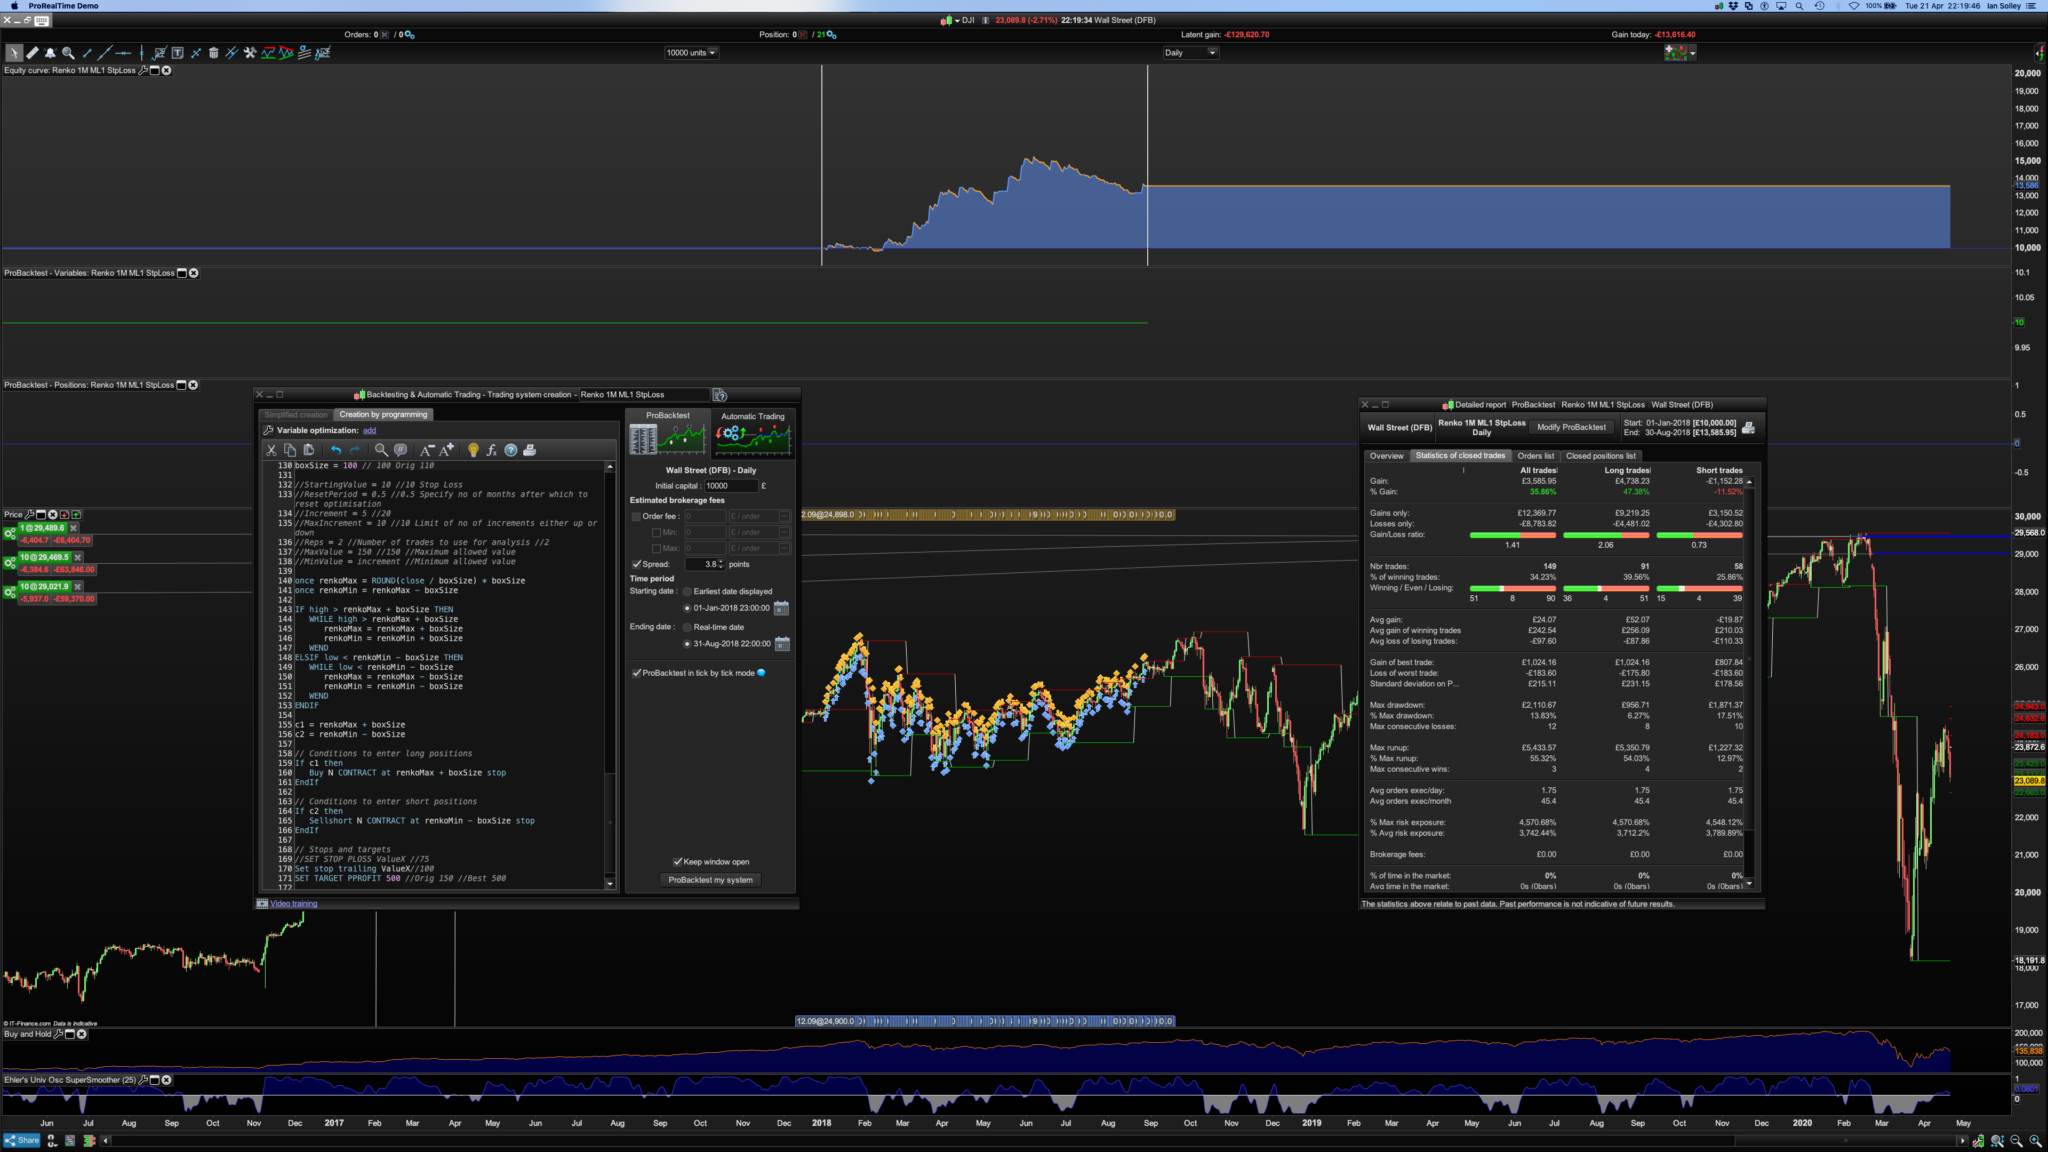
My first thought for Robusta was to set the boxsize to 1/10th of 100, at 10, that didn’t work, neither did 50 but 20 did for a while… Pls see screenshot. Perhaps a good volatility stop like Kaufman’s Volatility Stop or Kase’s Dev Stop should be added?
IG responded to me yesterday to clarify about the 37,500lb contract size: (IG’S commodities spread page it states Coffee Arabica is: “cents/pound $3.75”)
So from the ICE exchange we can see it’s 1 cent per pound. (“Per”? If it was then surely 37500 lbs of coffee would cost a very cheap $375? I think they meant quoted in cents per pound)
Therefore we should do: 375 cents x 100 = 37,500 which is the size of the contract.
Thus a lb of Coffee would cost:
3.75 x 11240.0 at current prices for 37,500 lbs
So if 37,500 (lbs) costs $42,150, you can do $42,150 / 37,500 to get cost / lb which is $1.124.
I also added Vonasi’s Robustness code to the top of Renko ML1 and then got an astronomical “profit” of 240m because of this:
A very important thing when carrying out any robustness testing is to ensure that any money management or increasing and decreasing of position sizing based on profit or loss is turned off.
https://www.prorealcode.com/topic/day-month-year-strategy-robustness-tester/page/4/#post-107553
Does theVRT code look right @GraHal? The rem’d out QYT and Random? I get the results but had a lot of trouble dragging them to this great VRT Excel sheet created by Paul:
https://www.prorealcode.com/topic/day-month-year-strategy-robustness-tester/page/7/#post-114611
I did try your one but it said I need to request permission to edit it?
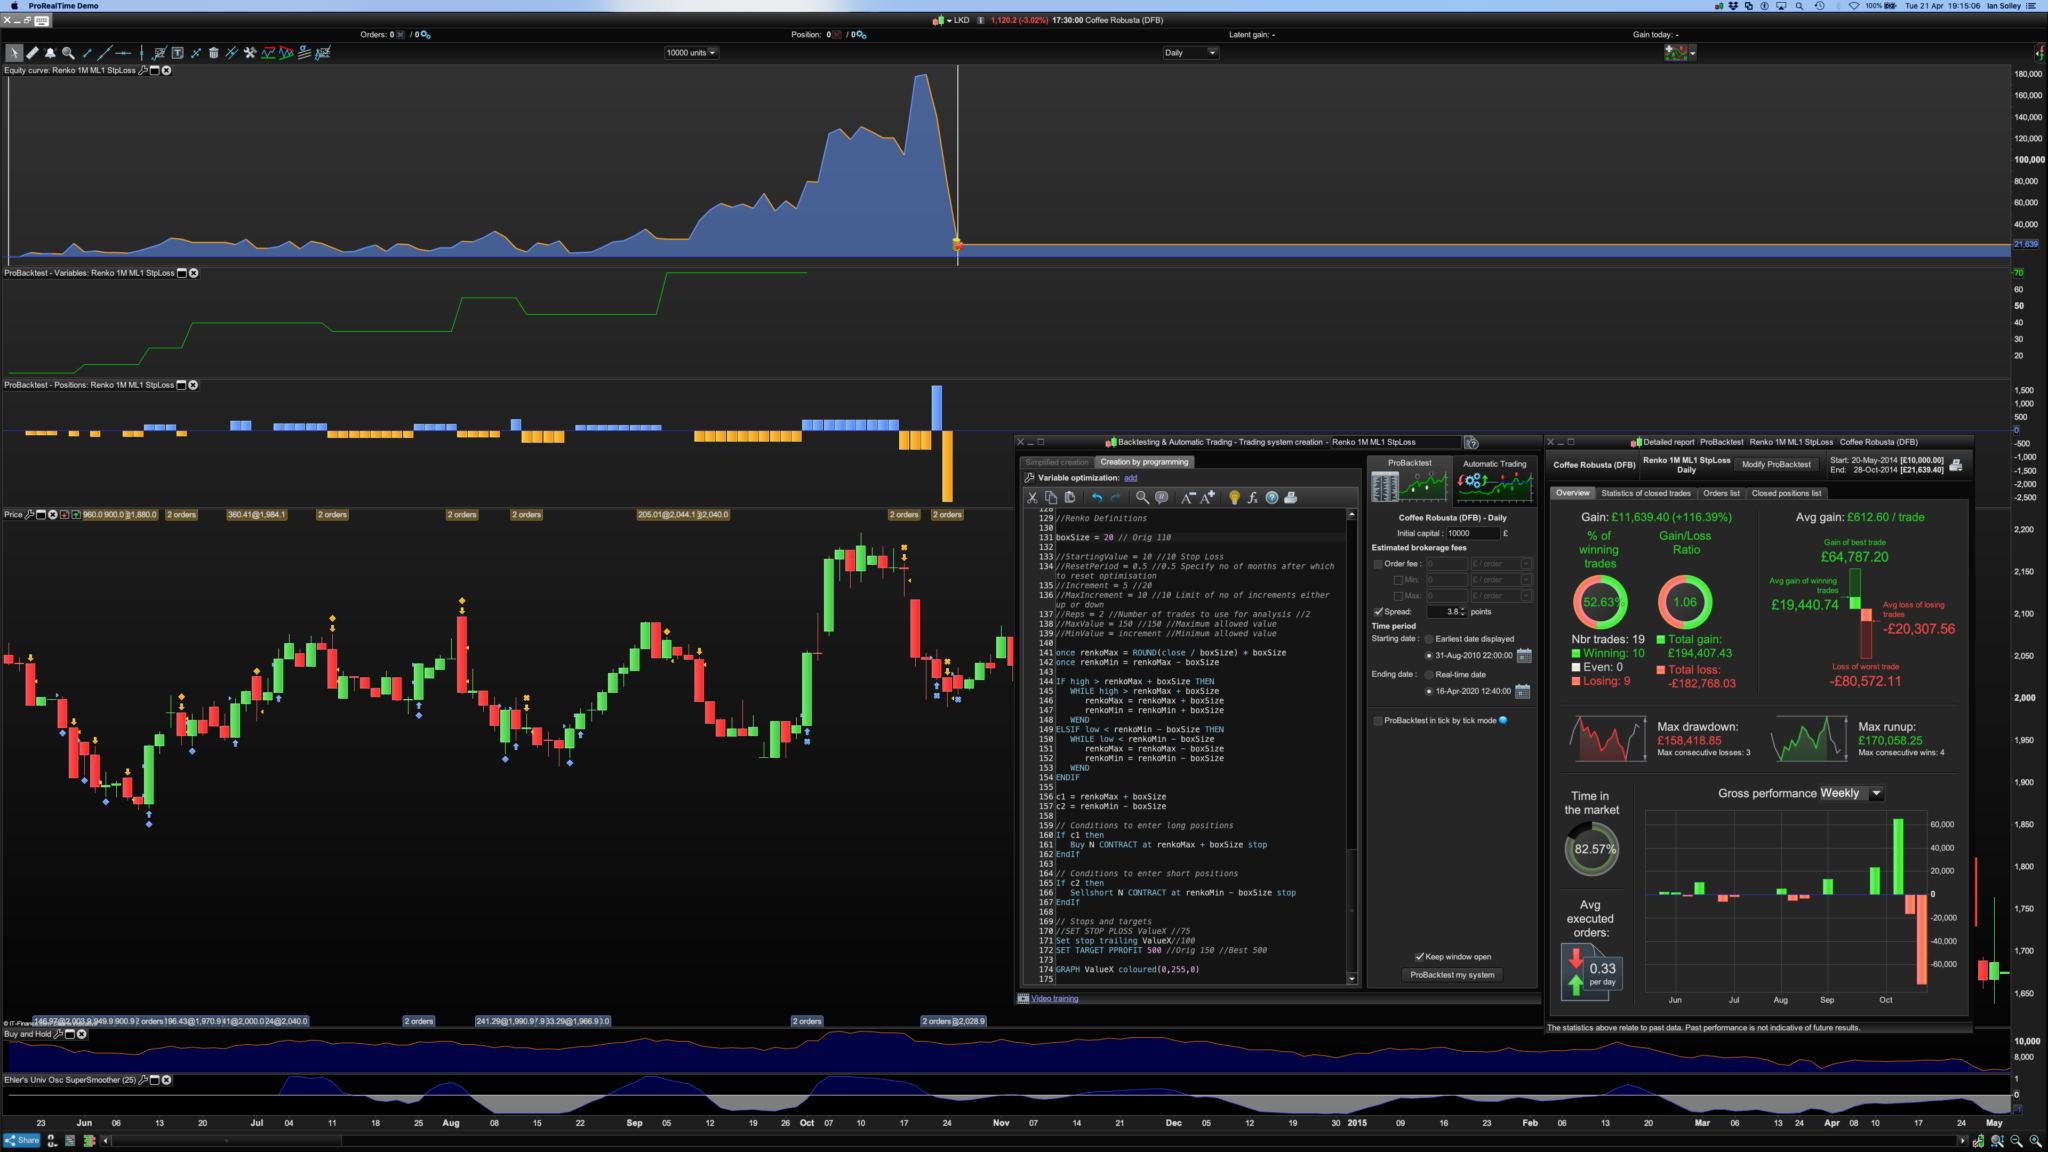
I think to conclude, for current KC trending and ranging markets over the last few years, Renko ML1 with a boxsize =100, works extremely well. Btw I’m not recommending anyone trade with 30 x capital/close.
Next time I see “1M” though I’ll know it means 1 minute and not 1 month… lol, which is the TF I used and how this algo got developed in the first place before being tested on daily, 4 hour and 1 hour all with generally good results, I guess that’s spectral dilation in action.
I rarely use overview screens because they don’t show the drawdown,
If Drawdown doesn’t show on the overview screen then click ‘
Details’ again and Drawdown will populate (yeah another annoying bug!).
Does theVRT code look right @GraHal?
I need to check back as when I last used the VRT, the code needed to be removed from the System before Forward Testing in Live?
Or has this changed lately and we now leave the VRT code in the System??
had a lot of trouble dragging them
Try selecting top left cell and Ctrl C then Ctrl V onto the excel sheet. I know … it doesn’t look like you are selecting all the cells, but this method works fine on google sheets! I found out by accident when drag and drop would not work on google sheets!
I’ve not got excel / ms office so please let me know if above works on excel or does it just work on google sheets??
Isn’t the “tick by tick issue” on higher TF’s related to the fact that renko charts are not time based and that several entries and exits would happen during one candlestick?
BardParticipant
Master
I had a share in a tech company once and “the churn” (up and down movement in value) was around £50k over a few months in an illiquid market. I wouldn’t recommend it! Lol.
BardParticipant
Master
I can see from my first two images of that last 4 image post of mine that tick by tick (tbt) wasn’t selected, but from previous backtests the same results occur with tbt and GraHal has confirmed this. I’ve seen many instances during backtests where the tbt warning screen doesn’t appear and others where it would appear (asking you to test not using tbt) and then as I said only for the warning not to appear with the same TF and date range on a later test…. I know doing a couple of days range that tbt is activated and the results are still very good on different timeframes (last two images above). I think I managed about 7 days of daily TF range with Coffee (KC) and tbt was activated. The tbt warning would also get triggered sometimes on a test where it hadn’t previously been when all I’d done was I up the money management amount.
Isn’t the “tick by tick issue” on higher TF’s related to the fact that renko charts are not time based and that several entries and exits would happen during one candlestick?
It’s possible I guess although I’m not sure. Best to check it out on Demo first before Live. Also the warning states it can potentially be just a couple of candles that can cause this tbt warning to appear. I’m waiting for IG to give some more clarity about tbt data lengths on KC.
BardParticipant
Master
Or has this changed lately and we now leave the VRT code in the System??
I think you use:
1
tradeon = 0
to
1
tradeon = 1
I couldn’t access your VRT? Thanks for the Excel tip. How the hell did Bill Gates get so rich, lol. Excel is hideously user unfriendly. Can’t wait to put the tbt data into the VRT. Has Vonasi “surfaced?” yet? 😀 Probably busy writing brilliant code and really interesting indicators…
BardParticipant
Master
I was thinking about how to improve this great ML code of Juanj’s. He mentioned using better criteria to measure performance: https://www.prorealcode.com/topic/machine-learning-in-proorder/page/3/#post-121130
Risk adjusted Returns are a way to have a better metric than just pure profits. Who wants to make double their money and make £1k if the drawdown associated with that gain was 80% before it hits £2k?
I would like to revive my comment on Sortino Ratios in the hope that someone can code this into the ML code: https://www.prorealcode.com/topic/machine-learning-in-proorder/page/8/#post-125922
The Sortino Ratio is calculated by dividing the difference between the minimally acceptable return and the portfolio’s actual return by the standard deviation of the negative asset returns or the downside deviation. One problem with the Sharpe Ratio: (system rate of return – risk-free rate of return) / standard deviation of system returns, is that it penalises a system for a big up month or “good volatility.” The Sortino Ratio attempts to overcome this issue by dividing the same risk-adjusted rate of return used in the Sharpe Ratio by only the negative deviation or “bad volatility” (the downside semi-variance).
At the moment we have:
StratAvgA = StratAvgA + (((PositionPerf(i)*countofposition[i]*Close)*-1)*-1)
PRT define POSITIONPERF(n) returns as: The performance (ratio gain/cost of the position) of the n-th last position closed if n>0 (not including brokerage fees) The performance (ratio gains/cost of the position) of the currently open position if n=0 (not including brokerage fees)
If n is not specified, we suppose that n=0. PositionPerf=PositionPerf(0).
Vonasi posted this money management code a while back:
Capital = 3000
MaxDrawDownPercentage = 66

Equity = Capital + StrategyProfit
MaxDrawdown = Equity * (MaxDrawDownPercentage/100)

IF OnMarket and ((PositionPrice - low)*CountOfPosition) > MaxDrawDown THEN
Quit
ENDIF
We need something like a PositionPerf divided by some historic (eg 20 day or longer) measure of the realised MaxDrawDownPercentage perhaps? Could anyone have a go at looking into Risk/Reward coding or think of a better metric that measures our risk better?
Cheers.
 Paul
PaulParticipant
Master
Risk adjusted Returns are a way to have a better metric than just pure profits. Who wants to make double their money and make £1k if the drawdown associated with that gain was 80% before it hits £2k?
100% agree with that! If you have a huge stoploss, you are more likely to make money (with luck) even after a big drawdown. But it doesn’t mean the entry was good and so next trade parameters better need adjustment. Maybe indeed with Sortino Ratios or with e-ratio mfa/mae.