Bard
BardParticipant
Master
Right, and scratch that last image because the tbt box had become automatically unticked when I had been using “earliest date available” on the previous test…
Here’s a thought; maybe it’s nothing to do with the code. Maybe there’s just some upper limit to how much tick data PRT can process per bar? When I was optimizing the 15m version I noticed that the tick mode was around 145 – pretty high – but scaled up to a daily TF would be some 14,000 transactions per bar. How that could be possible is another matter but maybe no renko strat will ever run tbt daily as it overdemands the system ???
I’ve gone back to basics and been trying to get a profitable system using / modifying the original DocTrading Renko System. I’ll post when I can prove any that work through Forward Test.
When you think … with all the skills contributing to this Topic we might be better starting a new Renko altogether?
We already have the bolt on bits … working ML, Paul’s additions and Trailing Stops, Nonetheless extras and Bard’s ideas etc … the original DocTrading Renko code might be flawed anyway with it’s While and Wend etc etc??
Something else I’ve worked out by experimentation! Using Box size = 40 to make it easier to explain, see below.
Doesn’t seem logical to me??
once renkoMax = ROUND(close / boxSize) * boxSize
once renkoMin = renkoMax - boxSize

buy at renkoMax + boxSize stop //Buy at Close + 40 (because renkomax = close).

sellshort at renkoMin - boxSize stop // SellShort at Close - 80 (because Renkomin = Close - 40)
In my Test System, I get a Stop Order appearing every second 40 points above Close and another 80 points below Close! 🙂
Maybe there’s just some upper limit to how much tick data PRT can process per bar?
There is an upper limit of 2,500 bars for tick by tick.
So if – due to settings / values for TP and SL – there are more than 2,500 instances of TP and SL being hit in the same bar then we get the warning message that tbt has reached it’s limit.
Doesn’t seem logical to me??
I think the renko we used (during the massive volatility of a few weeks ago) worked because even after a rise or drop of 125 points (box size = 125) that price just carried on going and so we made money!?
But now (with less volatility) after a 40 point rise or fall (box size = 40) then price retraces and so we lose money?
I think this is why renkos work on 1 sec, 5 sec, 10 sec etc because (if we get box size right) then price continues in the same direction for a bit longer and does not immediately retrace?
But on 1 min or even more so 5 min TF’s then after a decent box size rise or fall then there is a retrace??
Also using higher TF’s then optimisation would include the high volatility periods of a few weeks ago and so the opti results say … Box size = 90 or 100 etc is good.
But when we apply box = 100 to the lower volatility periods as of now this does not work and we lose because the uptrends and downtrends before a sizeable retrace are not now of 100 points + more to make profit?
Markets have settled down loads in the last week or so??
So very short TF’s and optimise over a few days or a week or so is best with renko so that the System is in the current zone (not using box size which was valid a few weeks ago)?
Just a few thoughts anyway?
boxsize=atr[period](close)*constant ??
With period being decent number-100 or 200??
Constant could be linear or changes with the size of atr to give an exponential effect?
Hate to say this but I have to-but my experience-i don’t do intrabar systems, only inter bar systems. I’ve found I can’t trust single bar open/closes for accuracy. I could be wrong but I am now very cautious of a system with predominantly same bar open/closes. Better off seeing the market action in front of you, and not trusting how it works being hidden in a single candle. Not to detract from any of the great work here that is definently worth paying attention to.
BardParticipant
Master
It’s possible @nonetheless, but according to that tbt email I got from Anton (see my earlier post) there is enough data for daily. I also found out that the spread for Coffee KC is normally around 20 not 60.
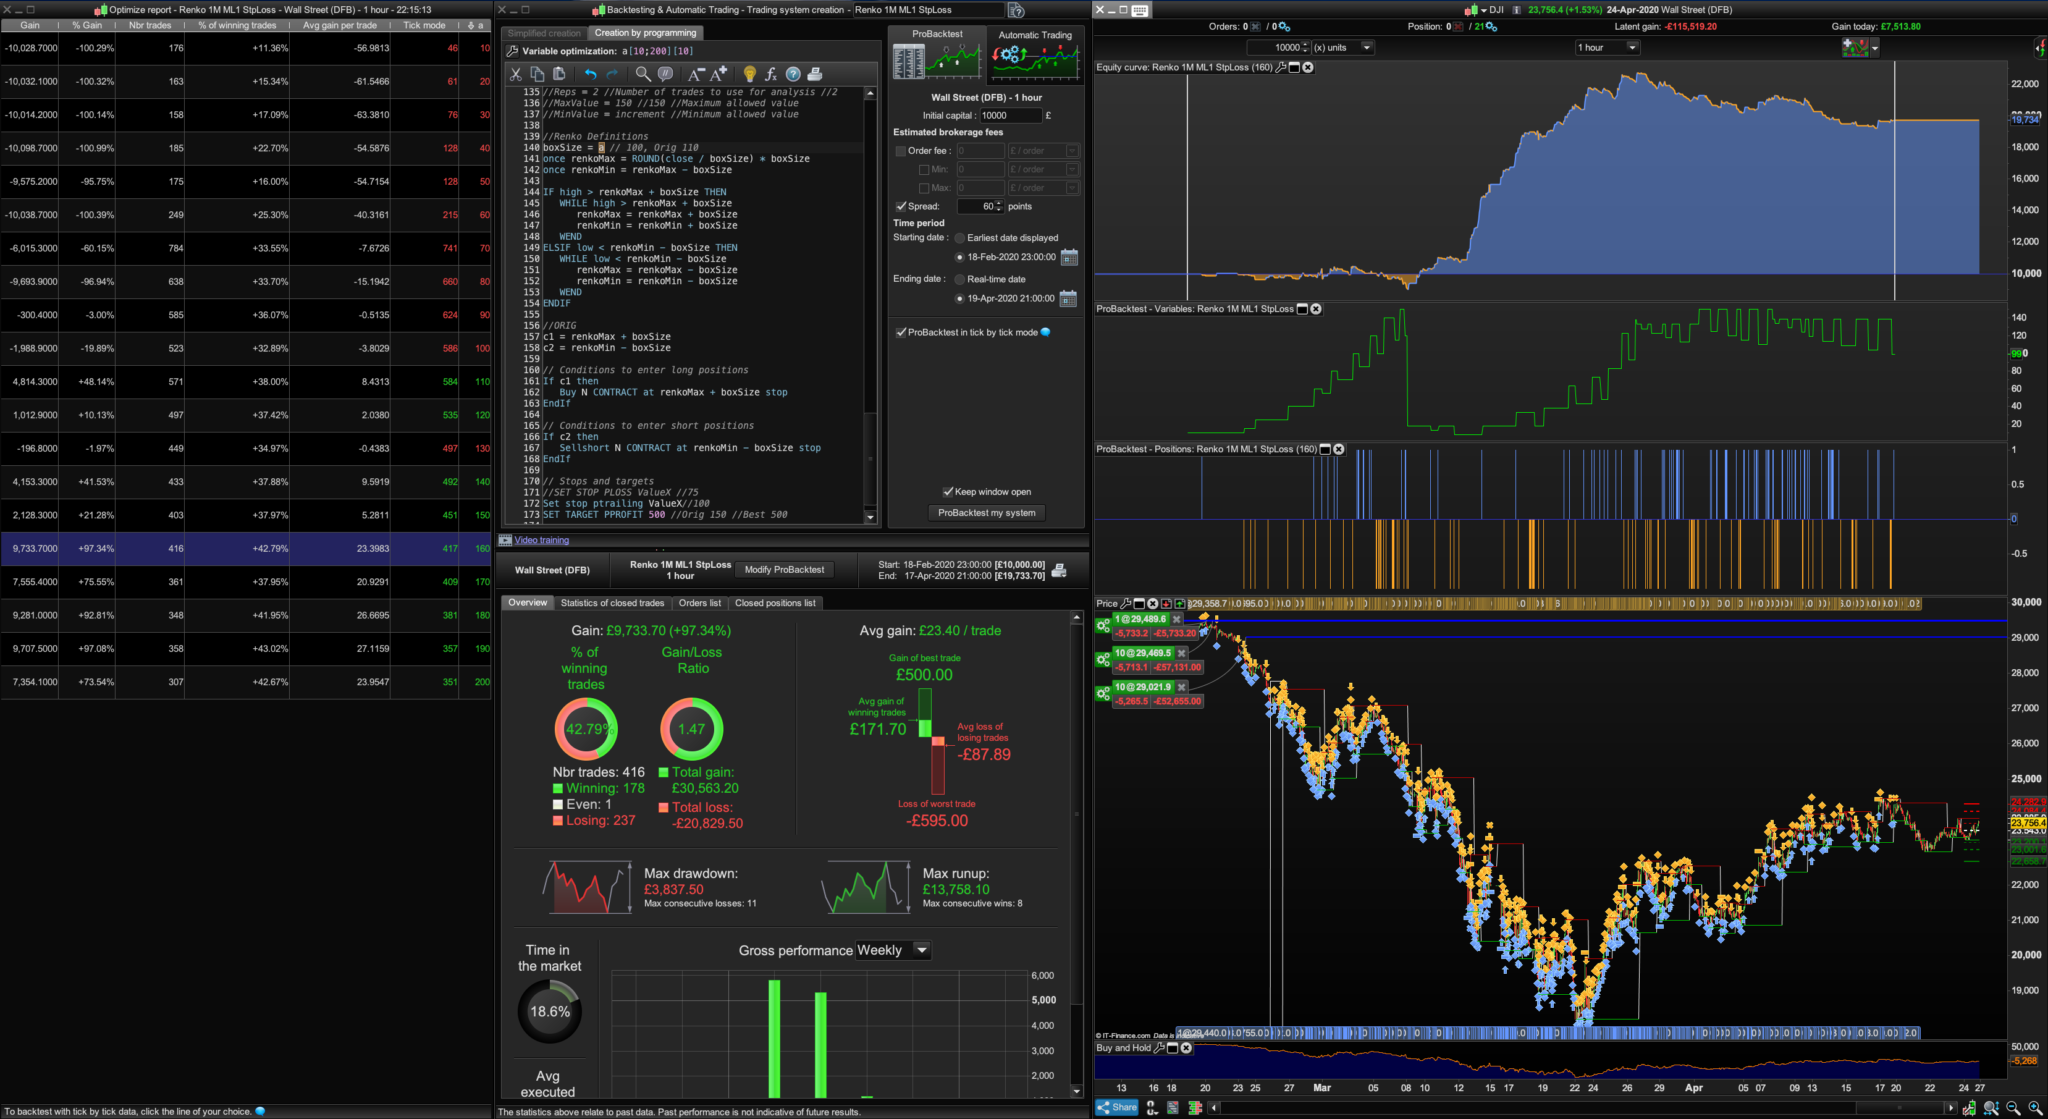
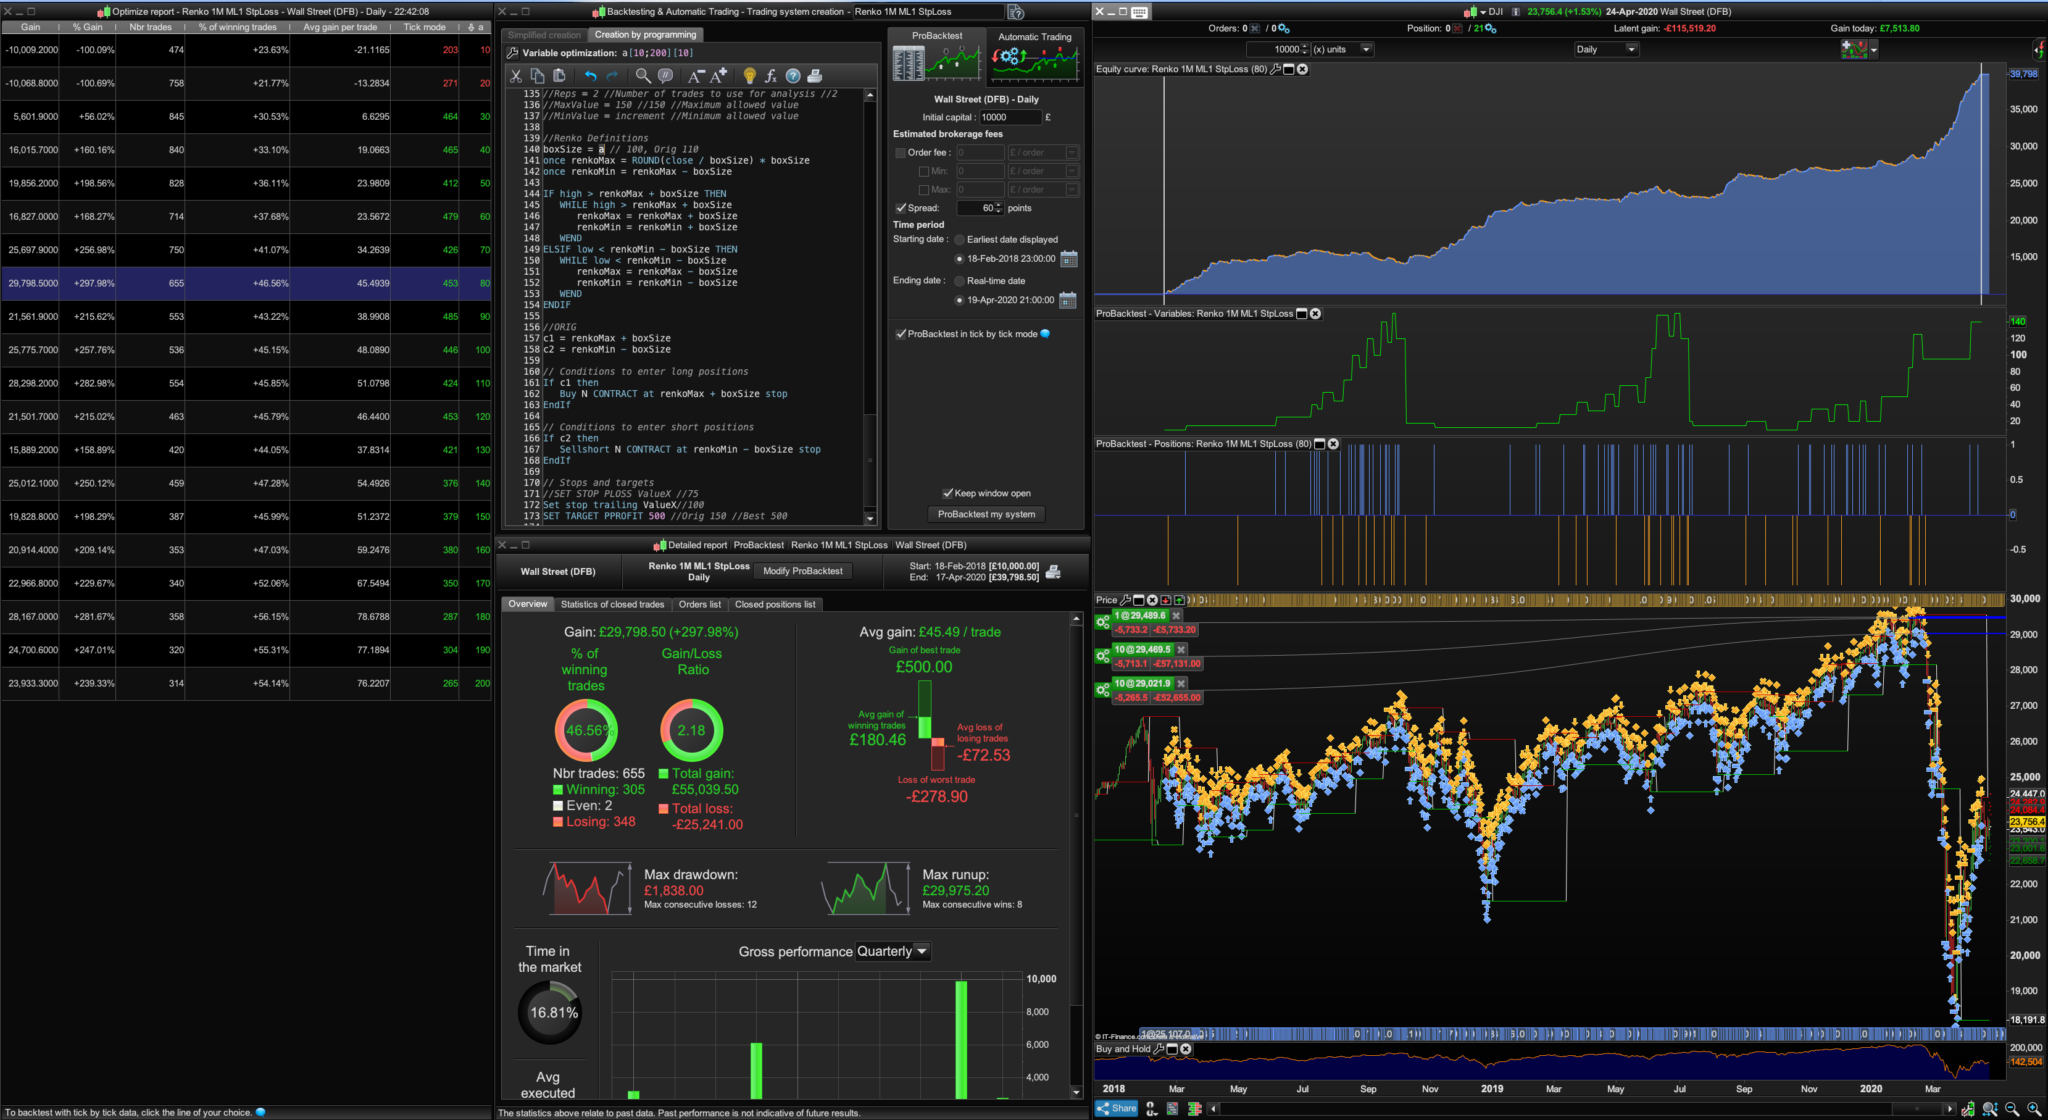
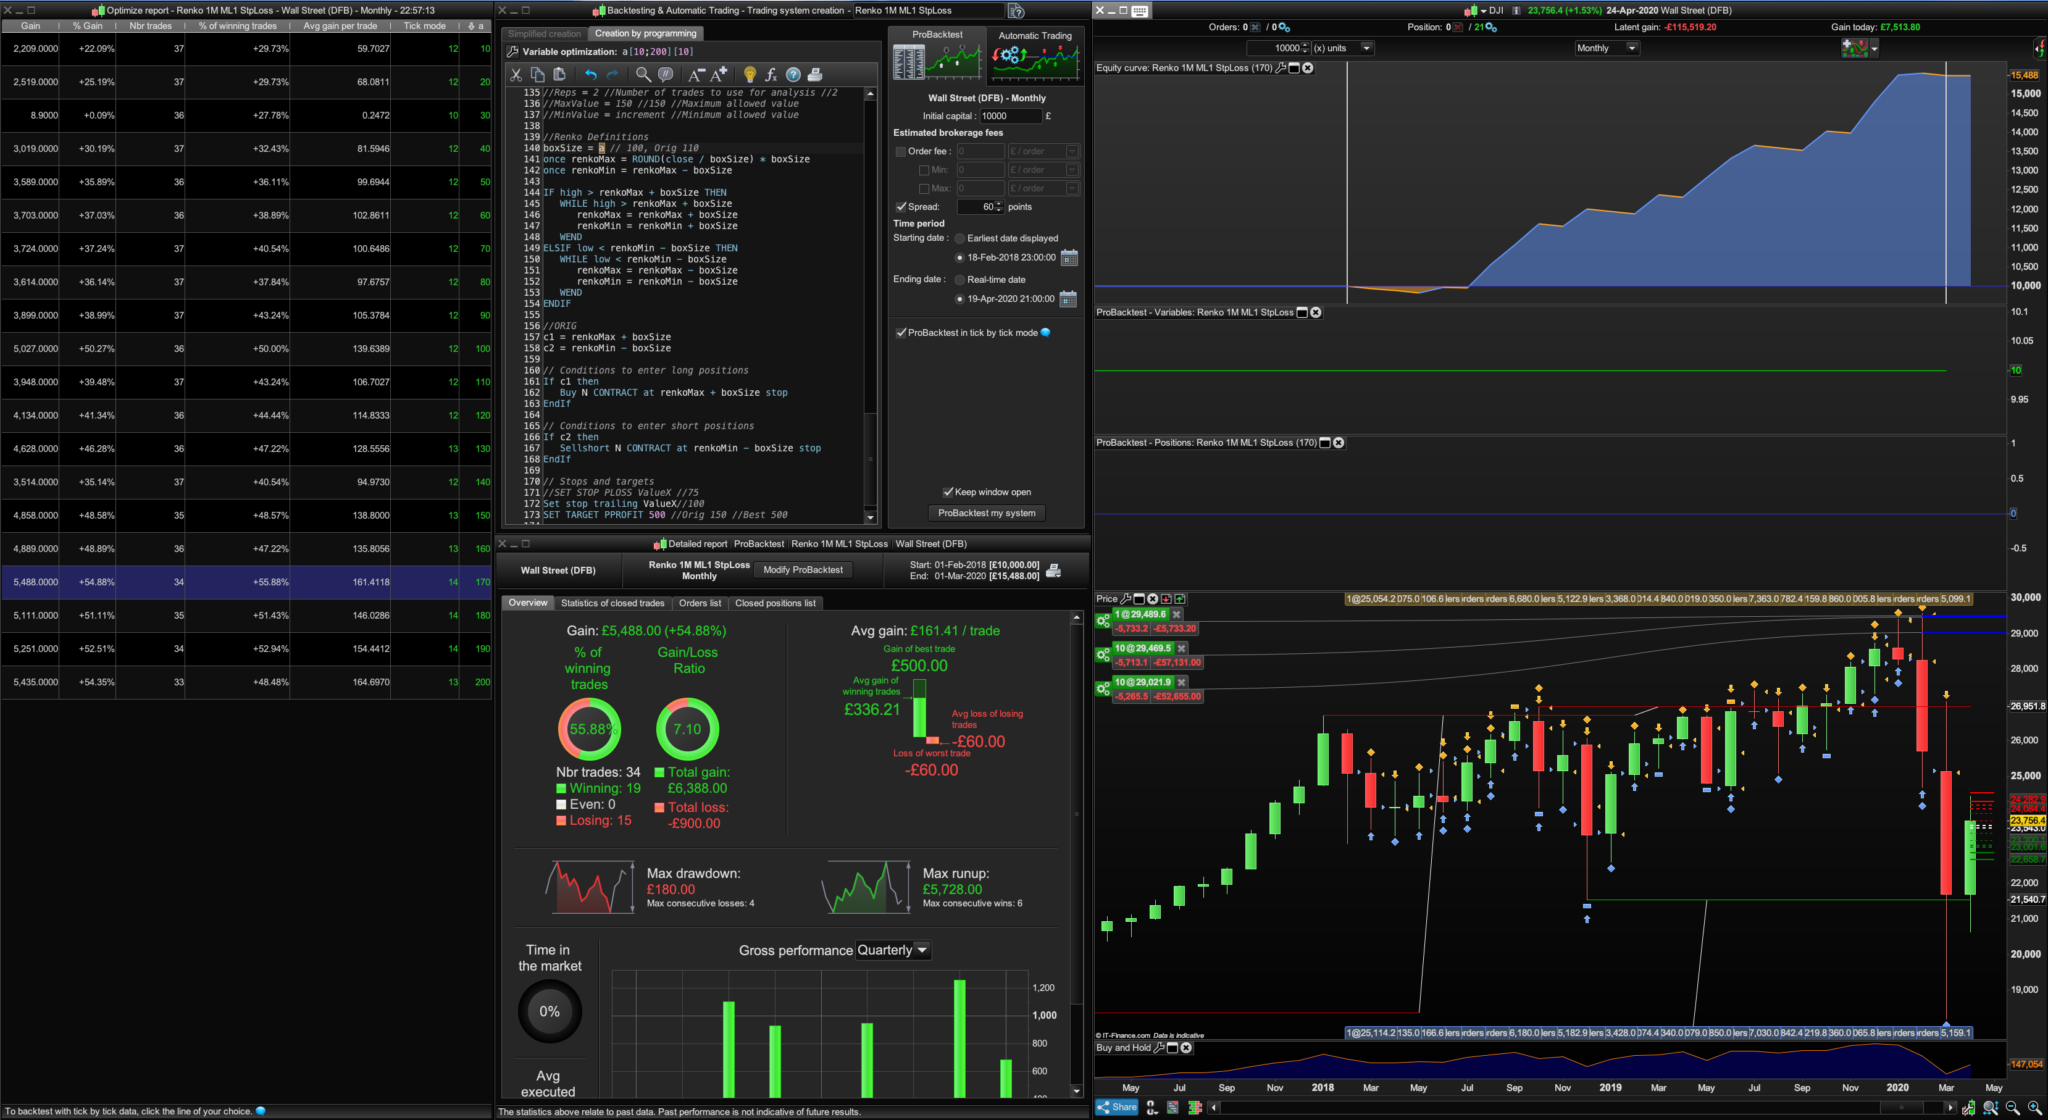
60 was used in the following optimisations tests on the Dow, non of which threw up any tbt warnings.
I used Dow 1 Hour, Daily and Monthly with that huge 60 point spread (from when we were testing the Coffee KC). It wasn’t intentional but I guess at least it’ll cover the worst market conditions and slippage. Pls see images.
I could not get the following to produce profits:
//c1 = renkoMax + boxSize
//c2 = renkoMin - boxSize

// Conditions to enter long positions
If close = renkoMax + boxSize then
Buy N CONTRACT at market
EndIf

// Conditions to enter short positions
If close = renkoMin - boxSize then
Sellshort N CONTRACT at market
EndIf
and have used the original buy and sell Stop conditions. Judging from these solid results for the Optimised BoxSize range of numbers, I’d say that if you put them into Excel and draw a scatter graph and pick a middle value from these very stable range of values they’d be safe to use on the Demo going forward.
I’ve attached the itf because it’d be interesting to see if they cause tbt warnings on the Daily charts for anyone? I expect they will. Particularly for the 2018-2020 range. Please let me know, (and if you see any errors too), I’d like to get to the bottom of this, (how can I put if tactfully?) “problematic” daily tbt warnings. Cheers.
BardParticipant
Master
In my Test System, I get a Stop Order appearing every second 40 points above Close and another 80 points below Close!
How do you get a Stop Order to appear on the backtest GraHal? Are you referring to GraphX?
Example:
1000/100 = 10 * 100 = 1000 = RenkoMax
renkoMax + boxSize –> 1000 + 100
renkoMin
– boxSize –> 1000 – 100
Re BoxSize thoughts:
https://www.prorealcode.com/topic/machine-learning-in-proorder/page/19/#post-127923
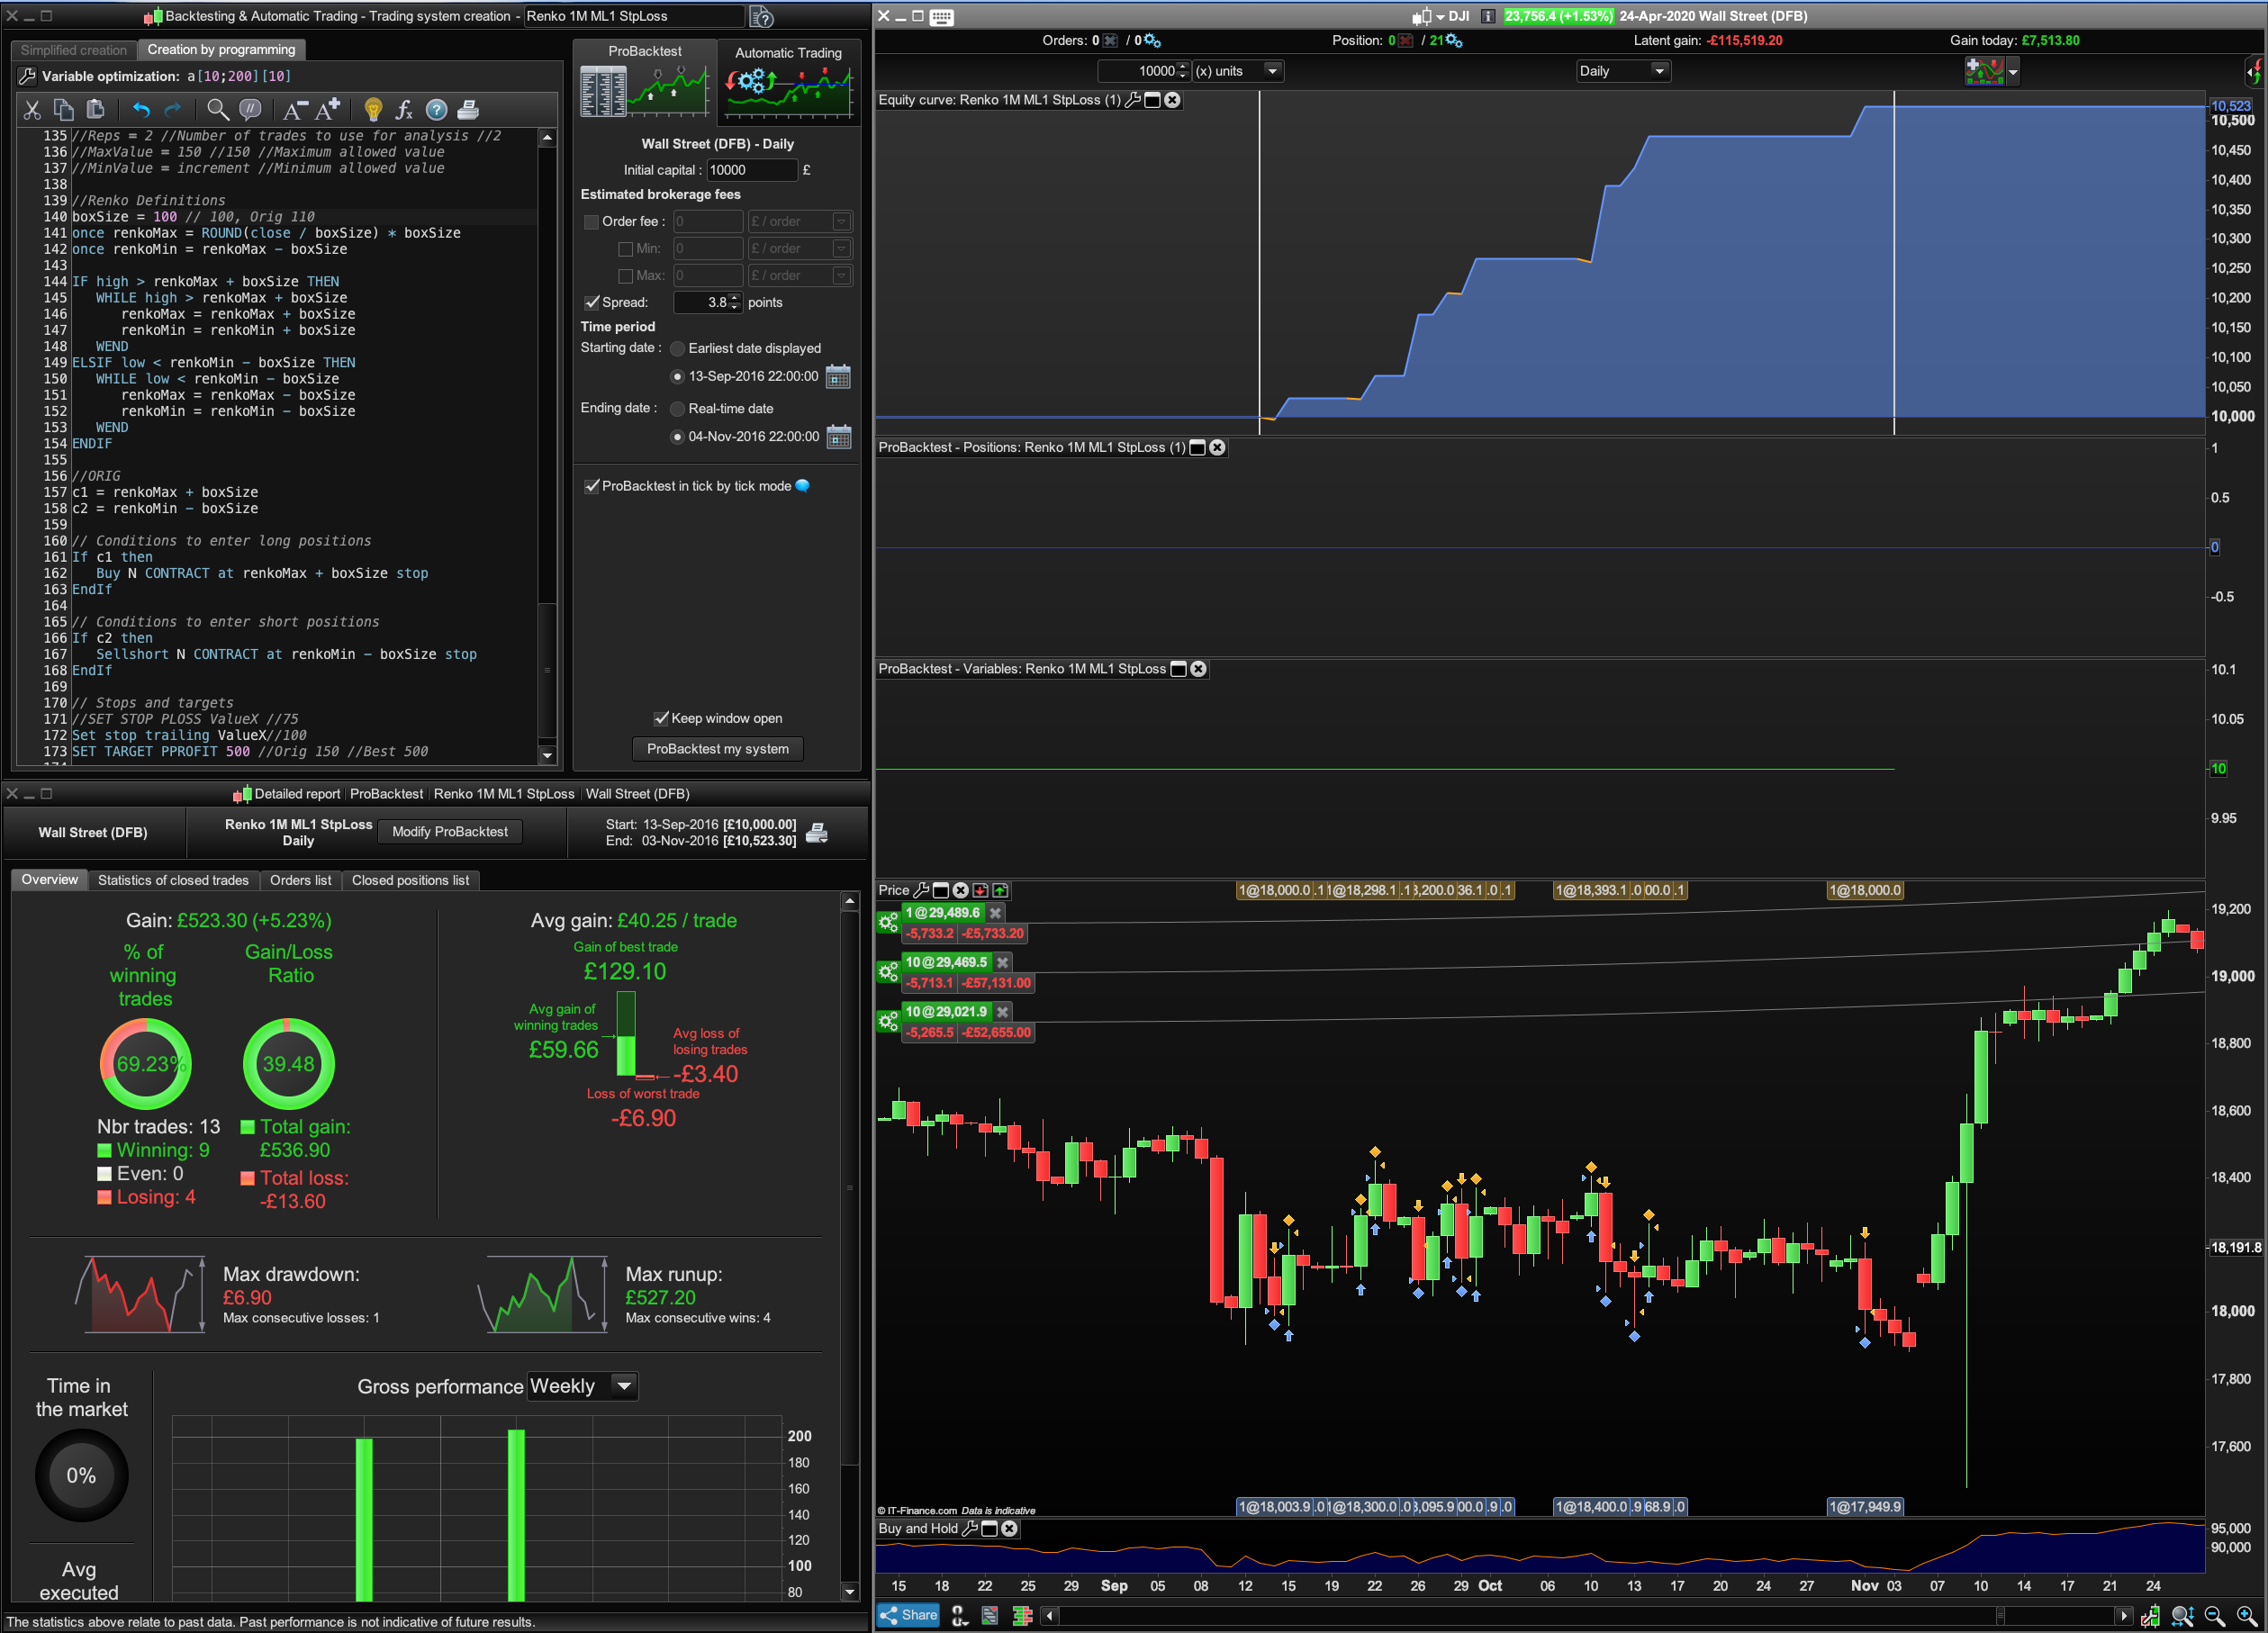
I just found a short 2 month period of flat Dow prices — 13/09/2016 to 04/11/2016 and ran the test with the itf, I just posted.
It might still have “a = BoxSize” for the optimisations I was running so I could post them here (which I have). The BoxSize = 100 in the image below, it appears to do very well in a flat market? I got no tbt warning. Be good to see if you can get the same? (I sometimes wonder if this tbt isn’t because of faulty daily candles cropping up somewhere?)
Good morning,
Be careful before you write anything thinking about the account you have subscribed to your broker.
If it is a guaranteed stop account: what is written below will not work.
once renkoMax = ROUND(close / boxSize) * boxSize
once renkoMin = renkoMax - boxSize

buy at renkoMax + boxSize stop //Buy at Close + 40 (because renkomax = close).

sellshort at renkoMin - boxSize stop
and ptrailling
How do you get a Stop Order to appear on the backtest GraHal?
It was on Forward Test. 🙂
If it is a guaranteed stop account:
Mine is not a guaranteed account.
See the post in Platform Support (link below)? One guy set up his System with SL = 30 and he must have missed not read an email from IG warning him that the min SL was increased to 300; it appears that with a guaranteed account IG can increase the SL dynamically. Anyway he lost a packet!
Doesnt say much for guaranteed accounts? I’d rather have my System rejected / stopped than have an automatic increase of SL??
I recently made big loss in volatile market.
I didn’t know.
But I’d rather the system be rejected, too.
BardParticipant
Master
Hi
@Finning, that sounds like a great idea because when I applied Machine Learning algo to the BoxSize it didn’t perform as well as when the ML algo was applied to just the Trailing Stop.
I tried:
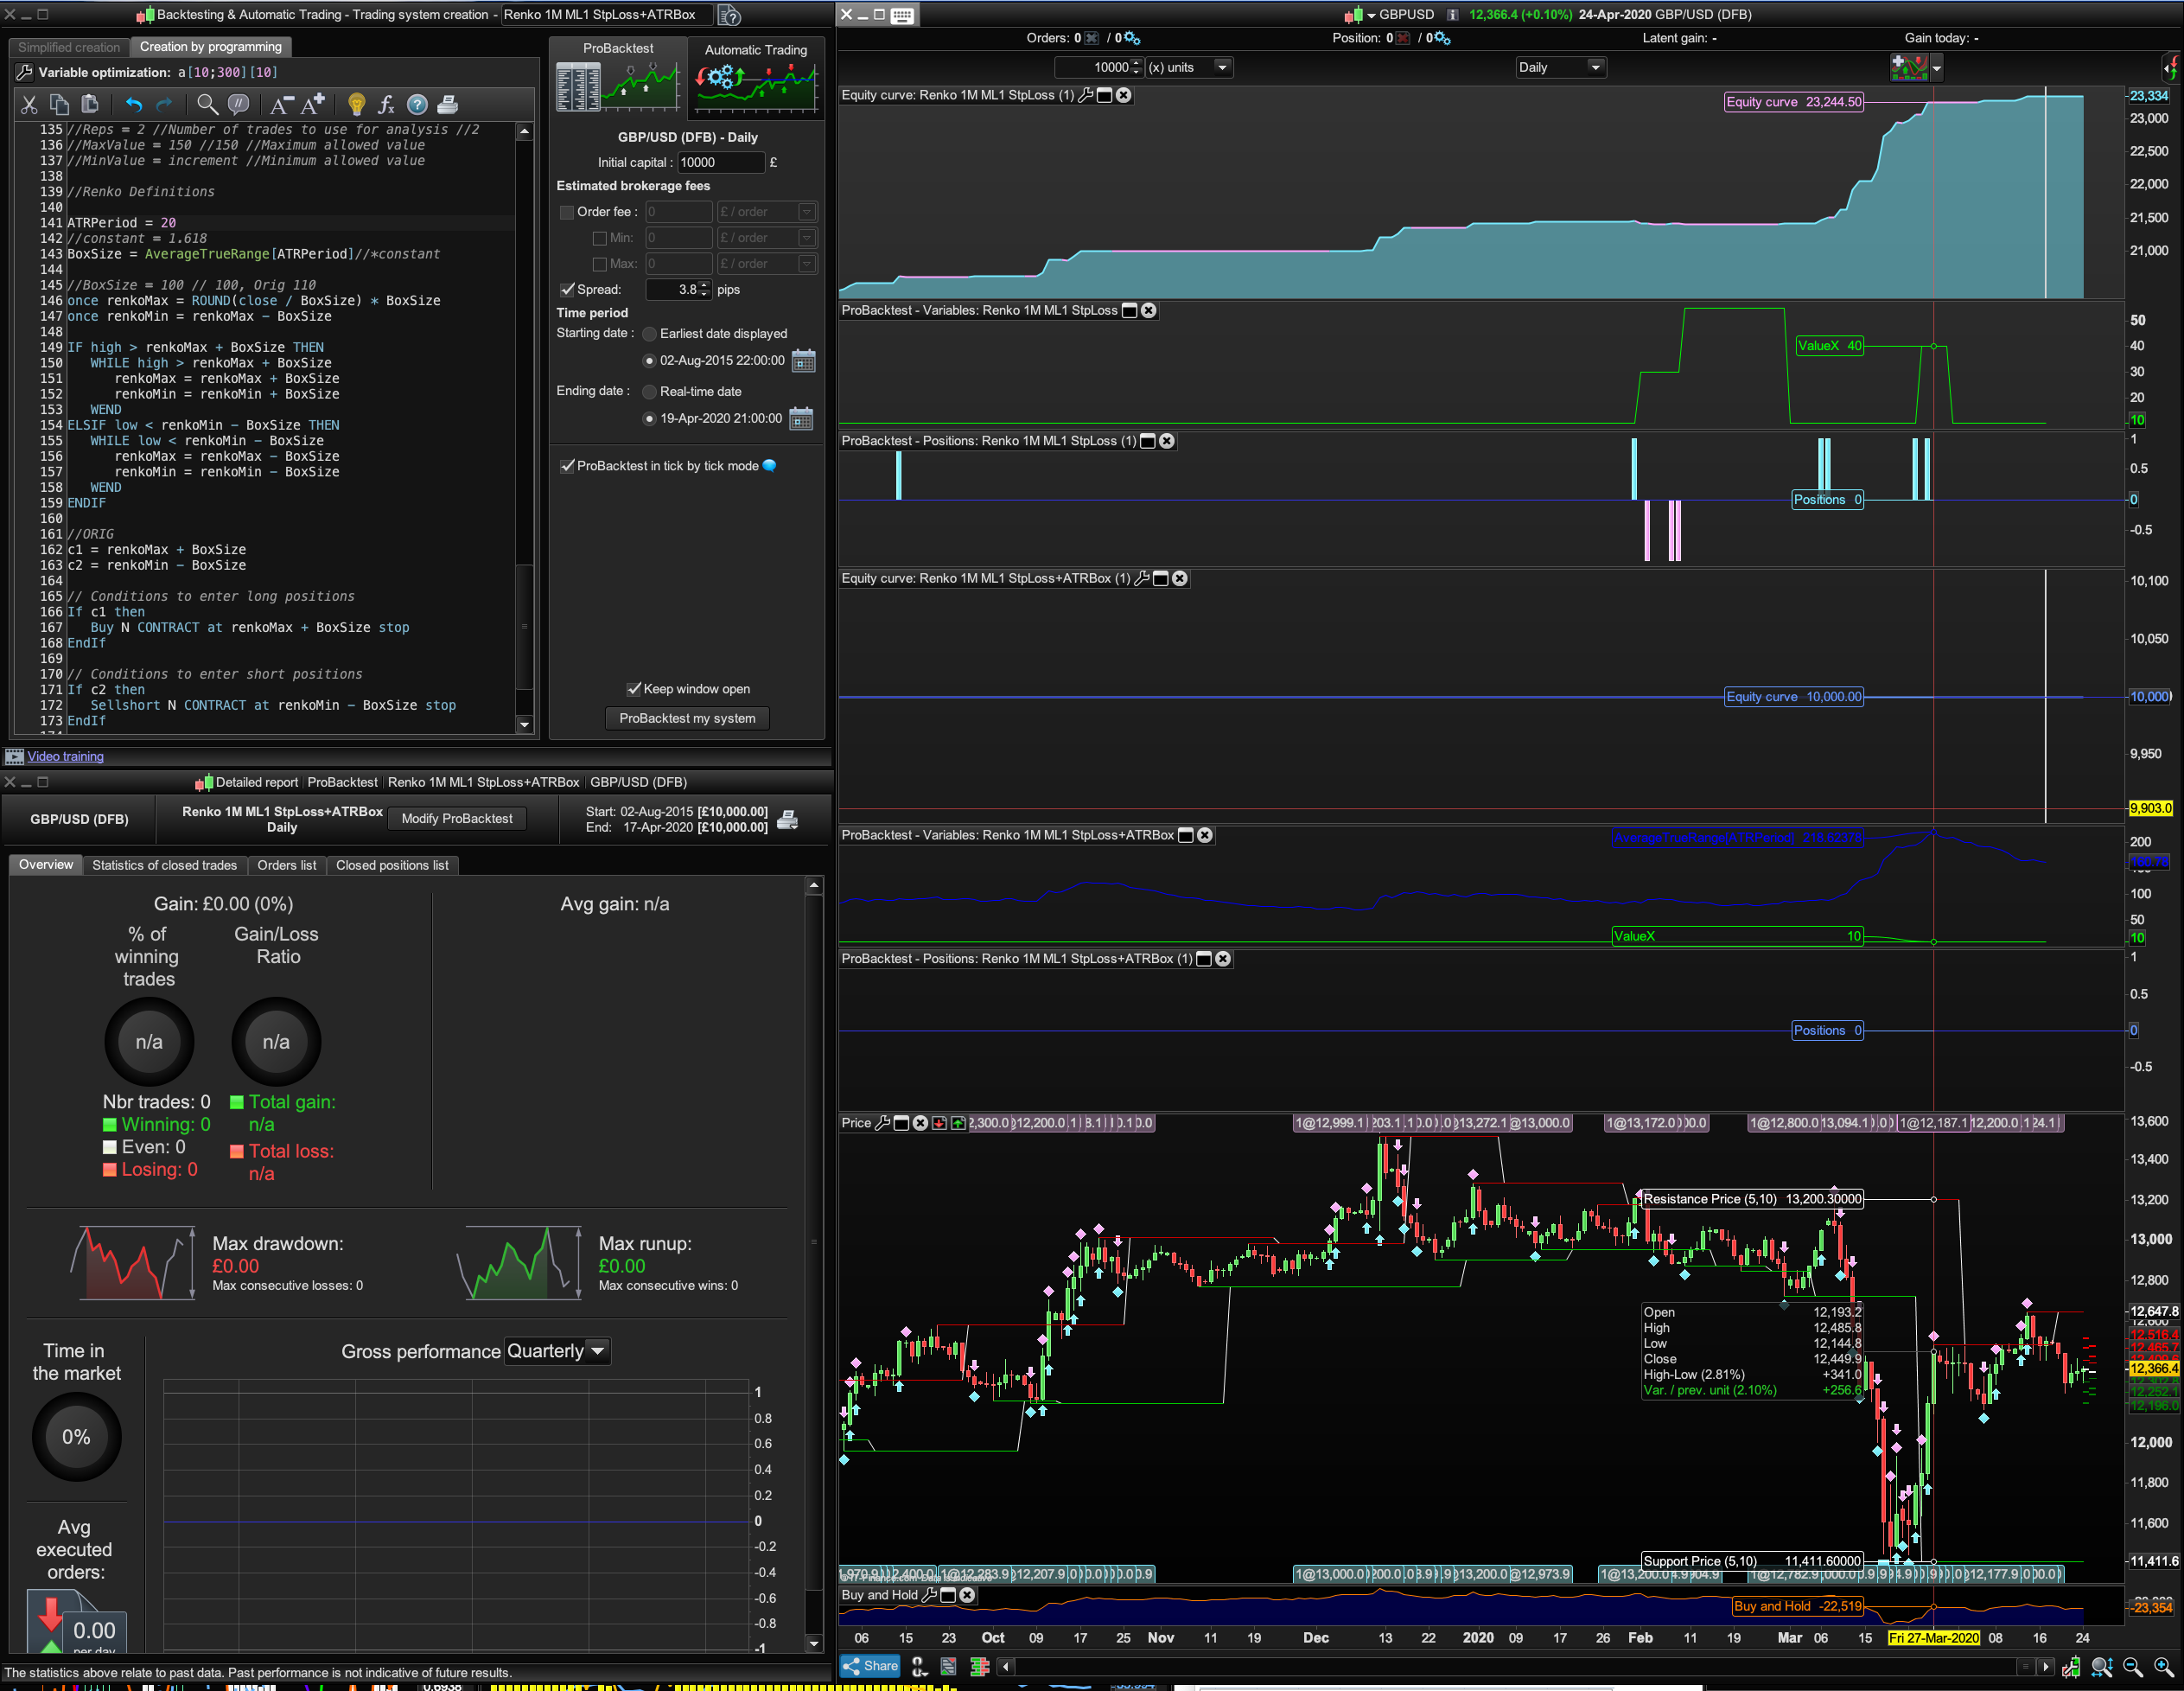
ATRPeriod = 20 (for better responsiveness)
//constant = 1.618 (getting fancy with the Golden Ratio....)
BoxSize = AverageTrueRange[ATRPeriod]//*constant
The BoxSize, which is the blue line in the screenshot, when it’s graphed, shows a nicely evolving BoxSize number but it doesn’t work in the code, in that no trades are taken. Any ideas?
I // the constant value too because it didn’t alter the BoxSize value when graphed?
I’ve attached the itf, if you or anyone else would like to have ago at getting it working?
BardParticipant
Master
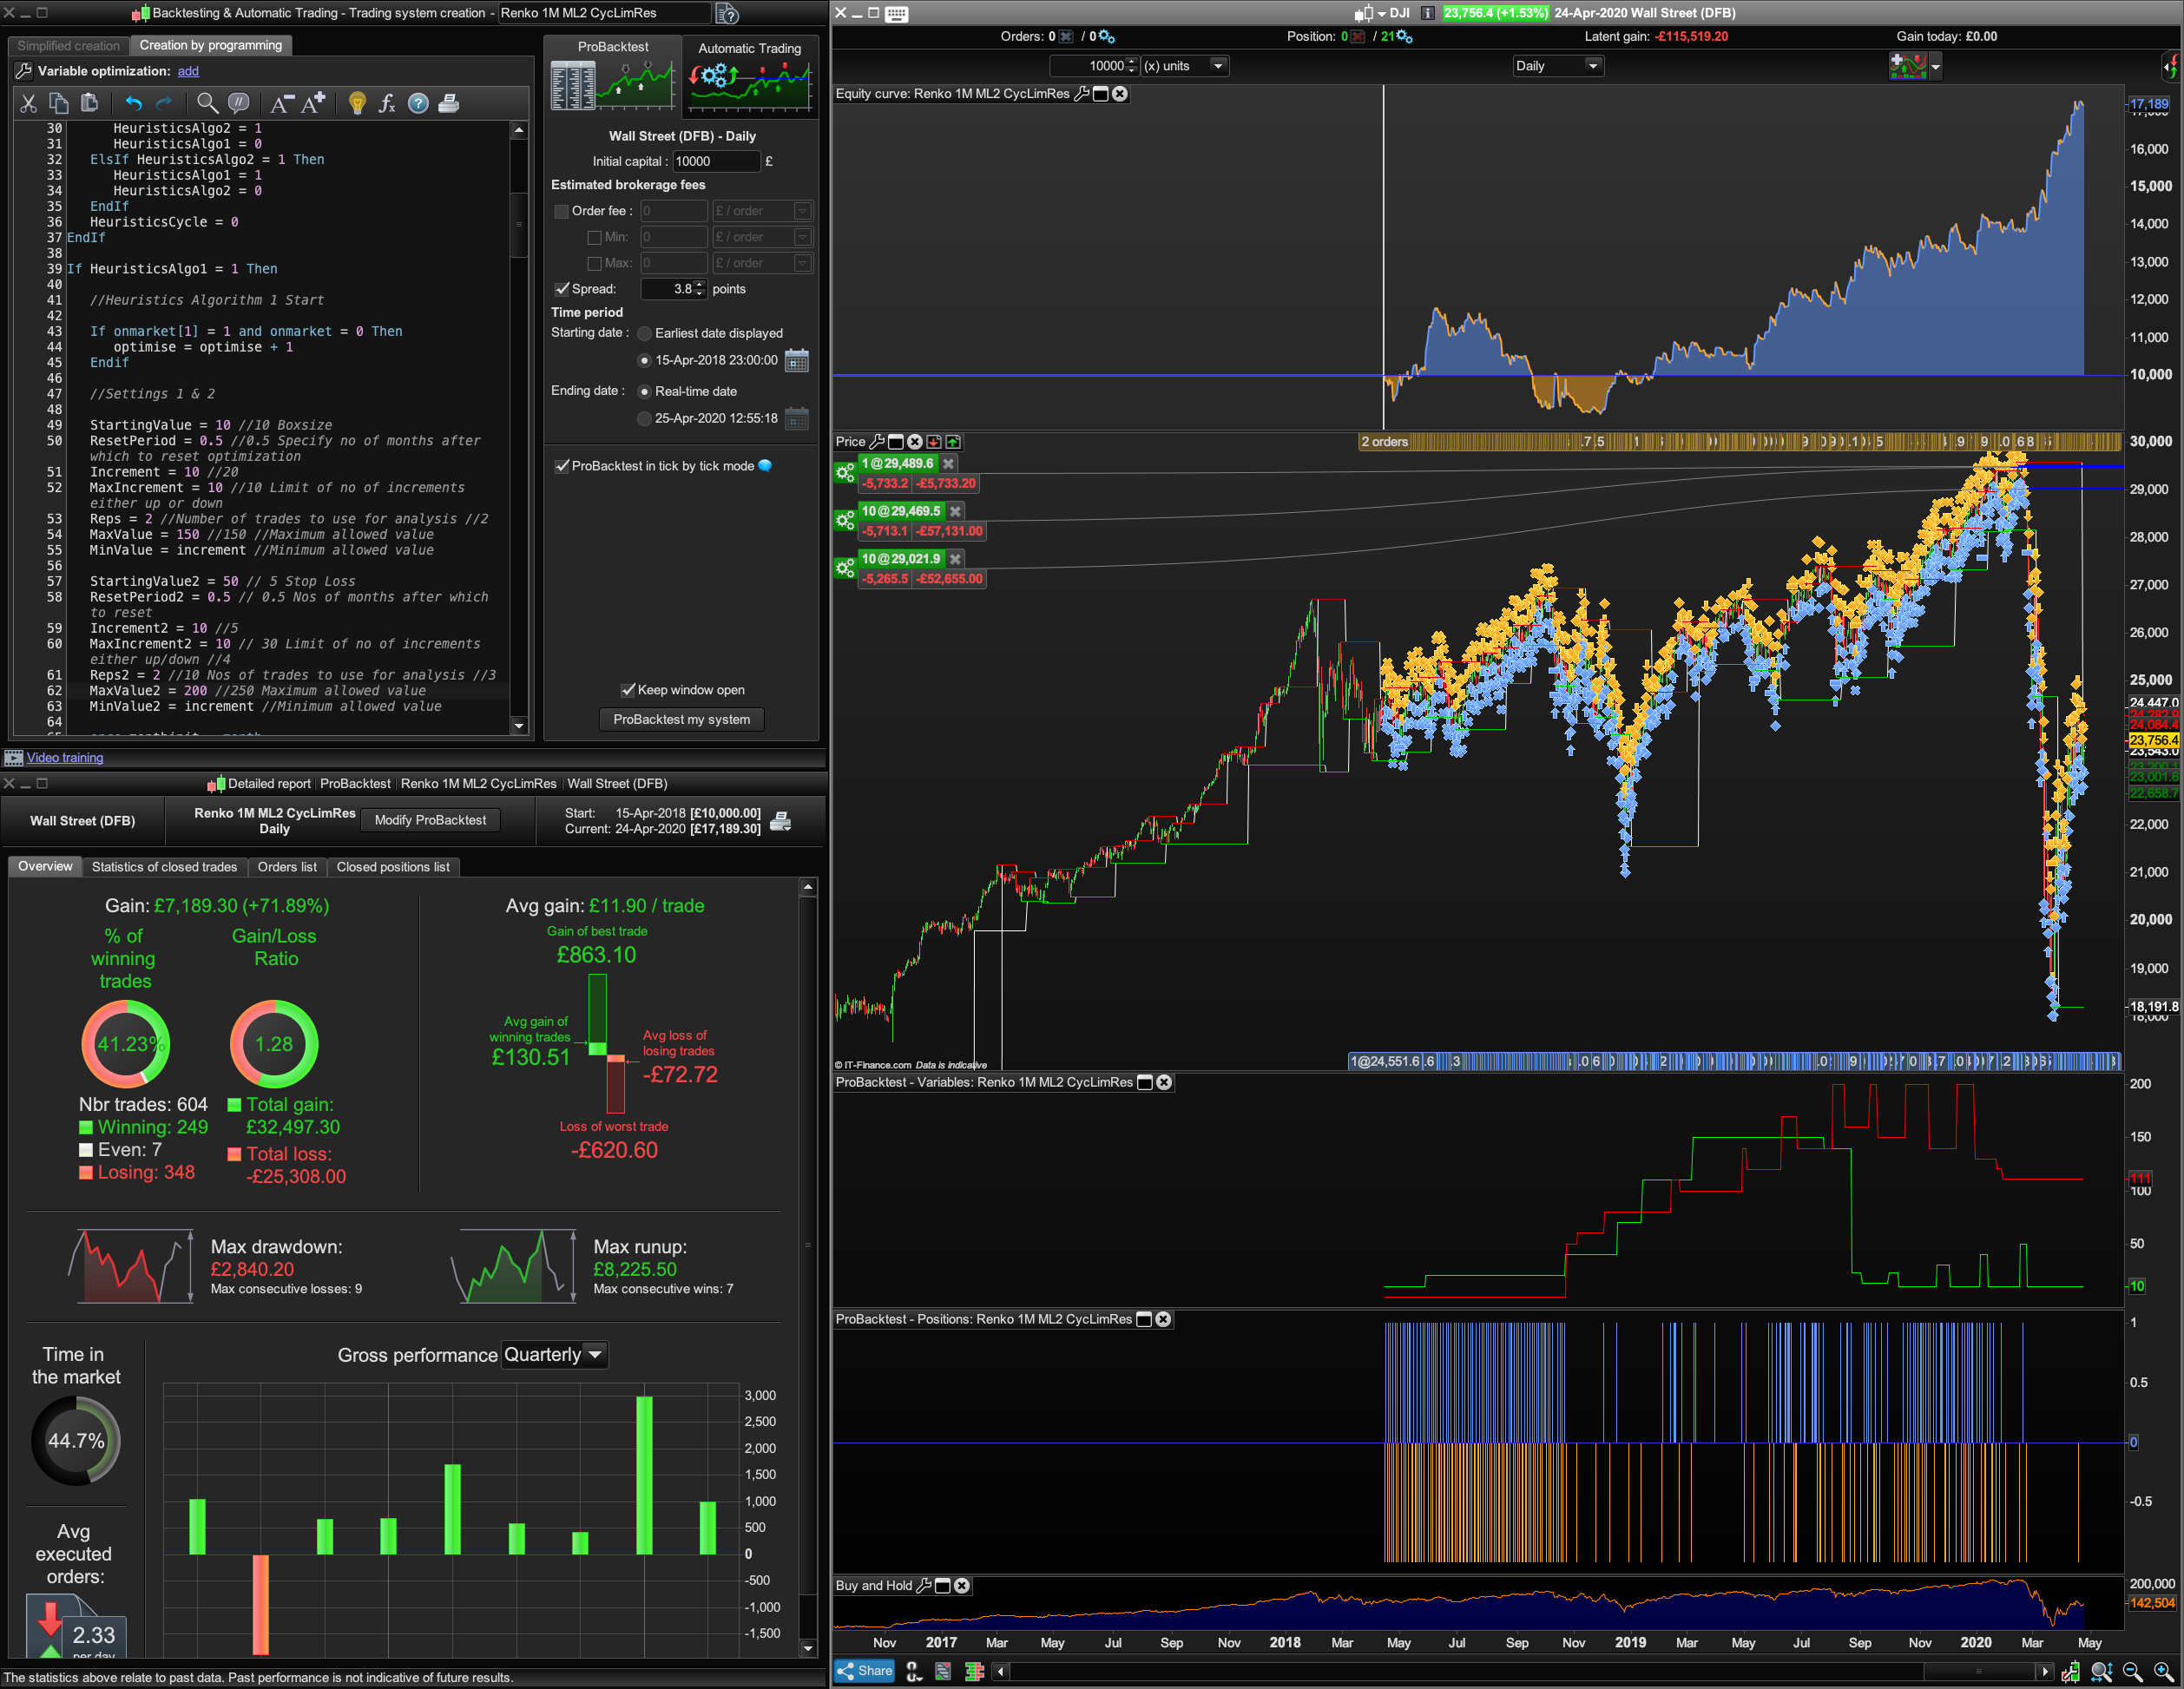
Attached is a Renko ML2: 2 x Machine Learning Algos: ValueX for the BoxSize and ValueY for the Trailing Stop.
I am not sure how much you can trust any of these results sometimes, because I have literally got quite different results using the exact same parameters (I screenshot everything as form of keeping track of data).
In the past I’ve tended to keep the BoxSizes and Trailing Stop Loss small between 10 and 150 but when you increase, eg the Trailing Stop range, like from 10 to 150 up to a new setting of 200 up to max 300 the profit might go down but drawdown has also gone down massively for some of my Dow backtests. I think ML1 is simpler and more profitable, I think the less parameters you have the more likely the system won’t suffer curve fitting. When I, (if I), get the Robustness Tester to be able to switch on an off using tradeon = 1, and without having to // all the code, I’ll do the VRT tests.
I’ve think I may have an answer to the Tick by Tick Warnings: Because of keeping track with screen-shoting, I think, the tbt warnings are at times being tripped by the settings and not because it’s a daily TF.
For example having used the larger Trailing Stop at 200 to max 300 and had no trouble backtesting Dow Daily 2015 to present, when I went back the smaller previous ranges (10 to 150 for both the Stop and the BoxSize) I immediately got a tbt warning. This happened with optimisations of the BoxSize when I used small starting values of 10 or 50 (to 300 in steps of 10) but not with 200 (to 300) but it didn’t happen when I replaced the ValueY with 10 (for a trailing stop loss)? When I went back and tried my ValueX = BoxSize (as opposed to Trailing Stop) system the only way I could get Dow Daily tbt warnings to stop was when I increased Starting Value to 200 (having tried 10, then 100 first). The Tick Mode was 579. However on the £/$ I got no tbt warning despite the Stop Loss starting at 10!?
The same thing happened when I changed the Ehler’s Universal Oscillator bandedge setting from 50 to 200, I got a tbt warning.
IG have confirmed there is enough daily tbt data: “Daily view: as much data as possible.” (Typically back to Aug 2010 and besides PRT will warn you when there isn’t enough data).
Who knows why this is happening?
Bottom line though: If the curve looks too good to be true (i.e. perfect line from the bottom left to top right like a lot of the ValueX Trailing Stops test can show), then it likely is. Those Stops probably won’t happen as perfectly in live trading. Just a hunch unless anyone has live data?
 Paul
PaulParticipant
Master
what is c1 and c2?
it adds to values together so condition is always true? If you remove these results are the same.
//c1 = renkoMax + boxSize
//c2 = renkoMin - boxSize

// Conditions to enter long positions
//If c1 then
Buy N CONTRACT at renkoMax + boxSize stop
//EndIf

// Conditions to enter short positions
//If c2 then
Sellshort N CONTRACT at renkoMin - boxSize stop
//EndIf
If I have tick by tick warnings, I just decrease the number of units till I have it working.
PaulParticipant
Master
Thinking about this version. Maybe it be possible separate boxes for long & short and add those to ml valuex/y?