debug mode for Prorealtime

Forums ProRealTime English forum ProRealTime platform support debug mode for Prorealtime

Viewing 15 posts - 1 through 15 (of 16 total)
  • #212280

    hi

    Is there a debug mode for example where we can see all the variables that have been created candle by candle or something like that because I’m still struggling with his candle by candle programming and without being able to access a database where the variables are stored,

    or maybe you have some links with tips to counteract this problem 🙂

    Best Reguards,
    ZeroCafeine

    #212286

    You started to work with the graphing. What is wrong with that ?
    (the debug mode you ask for should have been there, but appears not to be – maybe Nicolas can tell why or where it’s hidden (in V12))

    #212290

    see all the variables that have been created

    I do it by using GRAPH function and then zooming in on a trade / a few bars.

    I set up Indicators using the variable value in my strategy and display these Indicators individually under the Price chart and Positions and GRAPH output.

    ‘Cursor Details’ mode is very useful for this analysis work as it shows actual values for each bar and variable values etc.

    I don’t do it often as I find it laborious and very time-consuming.

    PeterSt is something of an expert in this fine art! He has spent 1,000’s of hours analysing trade entries and exits etc.

    2 users thanked author for this post.
    #212297

    Thank you, GraHal.

    Zero, here you have an example. The screenshot below  only shows one set of Graphing variables. The screenshot is quite large, so open it in a new browser window to see it all. Especially for you this is Forex.

    Get inspired by the above. 🙂
    And by the below ?


    2 users thanked author for this post.
    #212313

    A debug window is planned, I have seen some drafts, but I don’t know when it’s gonna be released.

    1 user thanked author for this post.
    #212339

    You started to work with the graphing. What is wrong with that ?

    Could you please be more clear? My problem is with the programming, I’ve already programmed in PHP, CSS, SQL, AJAX ..etc before, it’s an object oriented programming and we always have a database in which we can store the information we need and ask for it and fetch it on a table when we need it,

    But in this type of programming, the fact that you can’t see the variables that you’ve created before and that are stored or not, I’m having a bit of trouble, I think it’s because I’m getting old 😅

    #212340

    tks you, I will try to understand your screenshot with this Graph function and how to use it properly

    #212354

    Could you please be more clear? My problem is with the programming, I’ve already programmed in PHP, CSS, SQL, AJAX ..etc before, it’s an object oriented programming and we always have a database in which we can store the information we need and ask for it and fetch it on a table when we need it, But in this type of programming, the fact that you can’t see the variables that you’ve created before and that are stored or not, I’m having a bit of trouble, I think it’s because I’m getting old 😅


    Hahaha , no … you are too young. If you would have been too old you would have known procedural** languages, like PRT is.
    **): The kind of opposite of object-oriented languages, which latter became mainstream since the 90’s somewhere, but existed a few decades earlier already. Anyway, you would be 50 years old or so, which is by far not too old yet to learn a few more things.

    But you are right, programming in this “per bar” environment is something one needs to adapt to. And as a matter of fact it is so different that I applied a few first steps to incorporate the principle of “per bar” in the ERP environment (Enterprise Resource Planning – those huge software packages). Think of total net revenue per hour or per minute and such. If the software is sufficiently real-time, this can be done (think like all activities done by scanning (scanners)). I created this included real “candles”.


    Per bar

    The most essential thing to understand is that your program code (the complete code) is called by the higher level PRT server software, once per bar (= candle). In more detail this is : once per bar indeed (as per the definition of the chart) but also once per the set TimeFrame in the program code. Thus, bar is 1 minute, but TimeFrame for a piece of code can be 5 minutes, and that piece of code is only executed once per 5 minutes.

    Well, that is all.
    Sort of.

    The by far major lacking feature in the PRT language is not a debugger, but a means to make it structured. Thus make routines you finish and which work for once and for all (an object in the OO languages) and be done with them and not be bothered by them ever more. Note : this only gets profound really, when you start your xth Strategy and copy from something else, change appropriate pieces and discover that your changes should also be applied in the source you copied from. This is totally unmanageable  and with that undoable. The editor is a piece of sh*t from ancient history and the single reason that nothing serious can be made ever, within the PRT language. But, this combines with the need for “structured” means, because without this latter, the code becomes too large to oversee. Combine this with the lack of a decent search means and there you get lost + annoyed.
    N.b.: Yes, I use another editor to overcome this crucial issue.

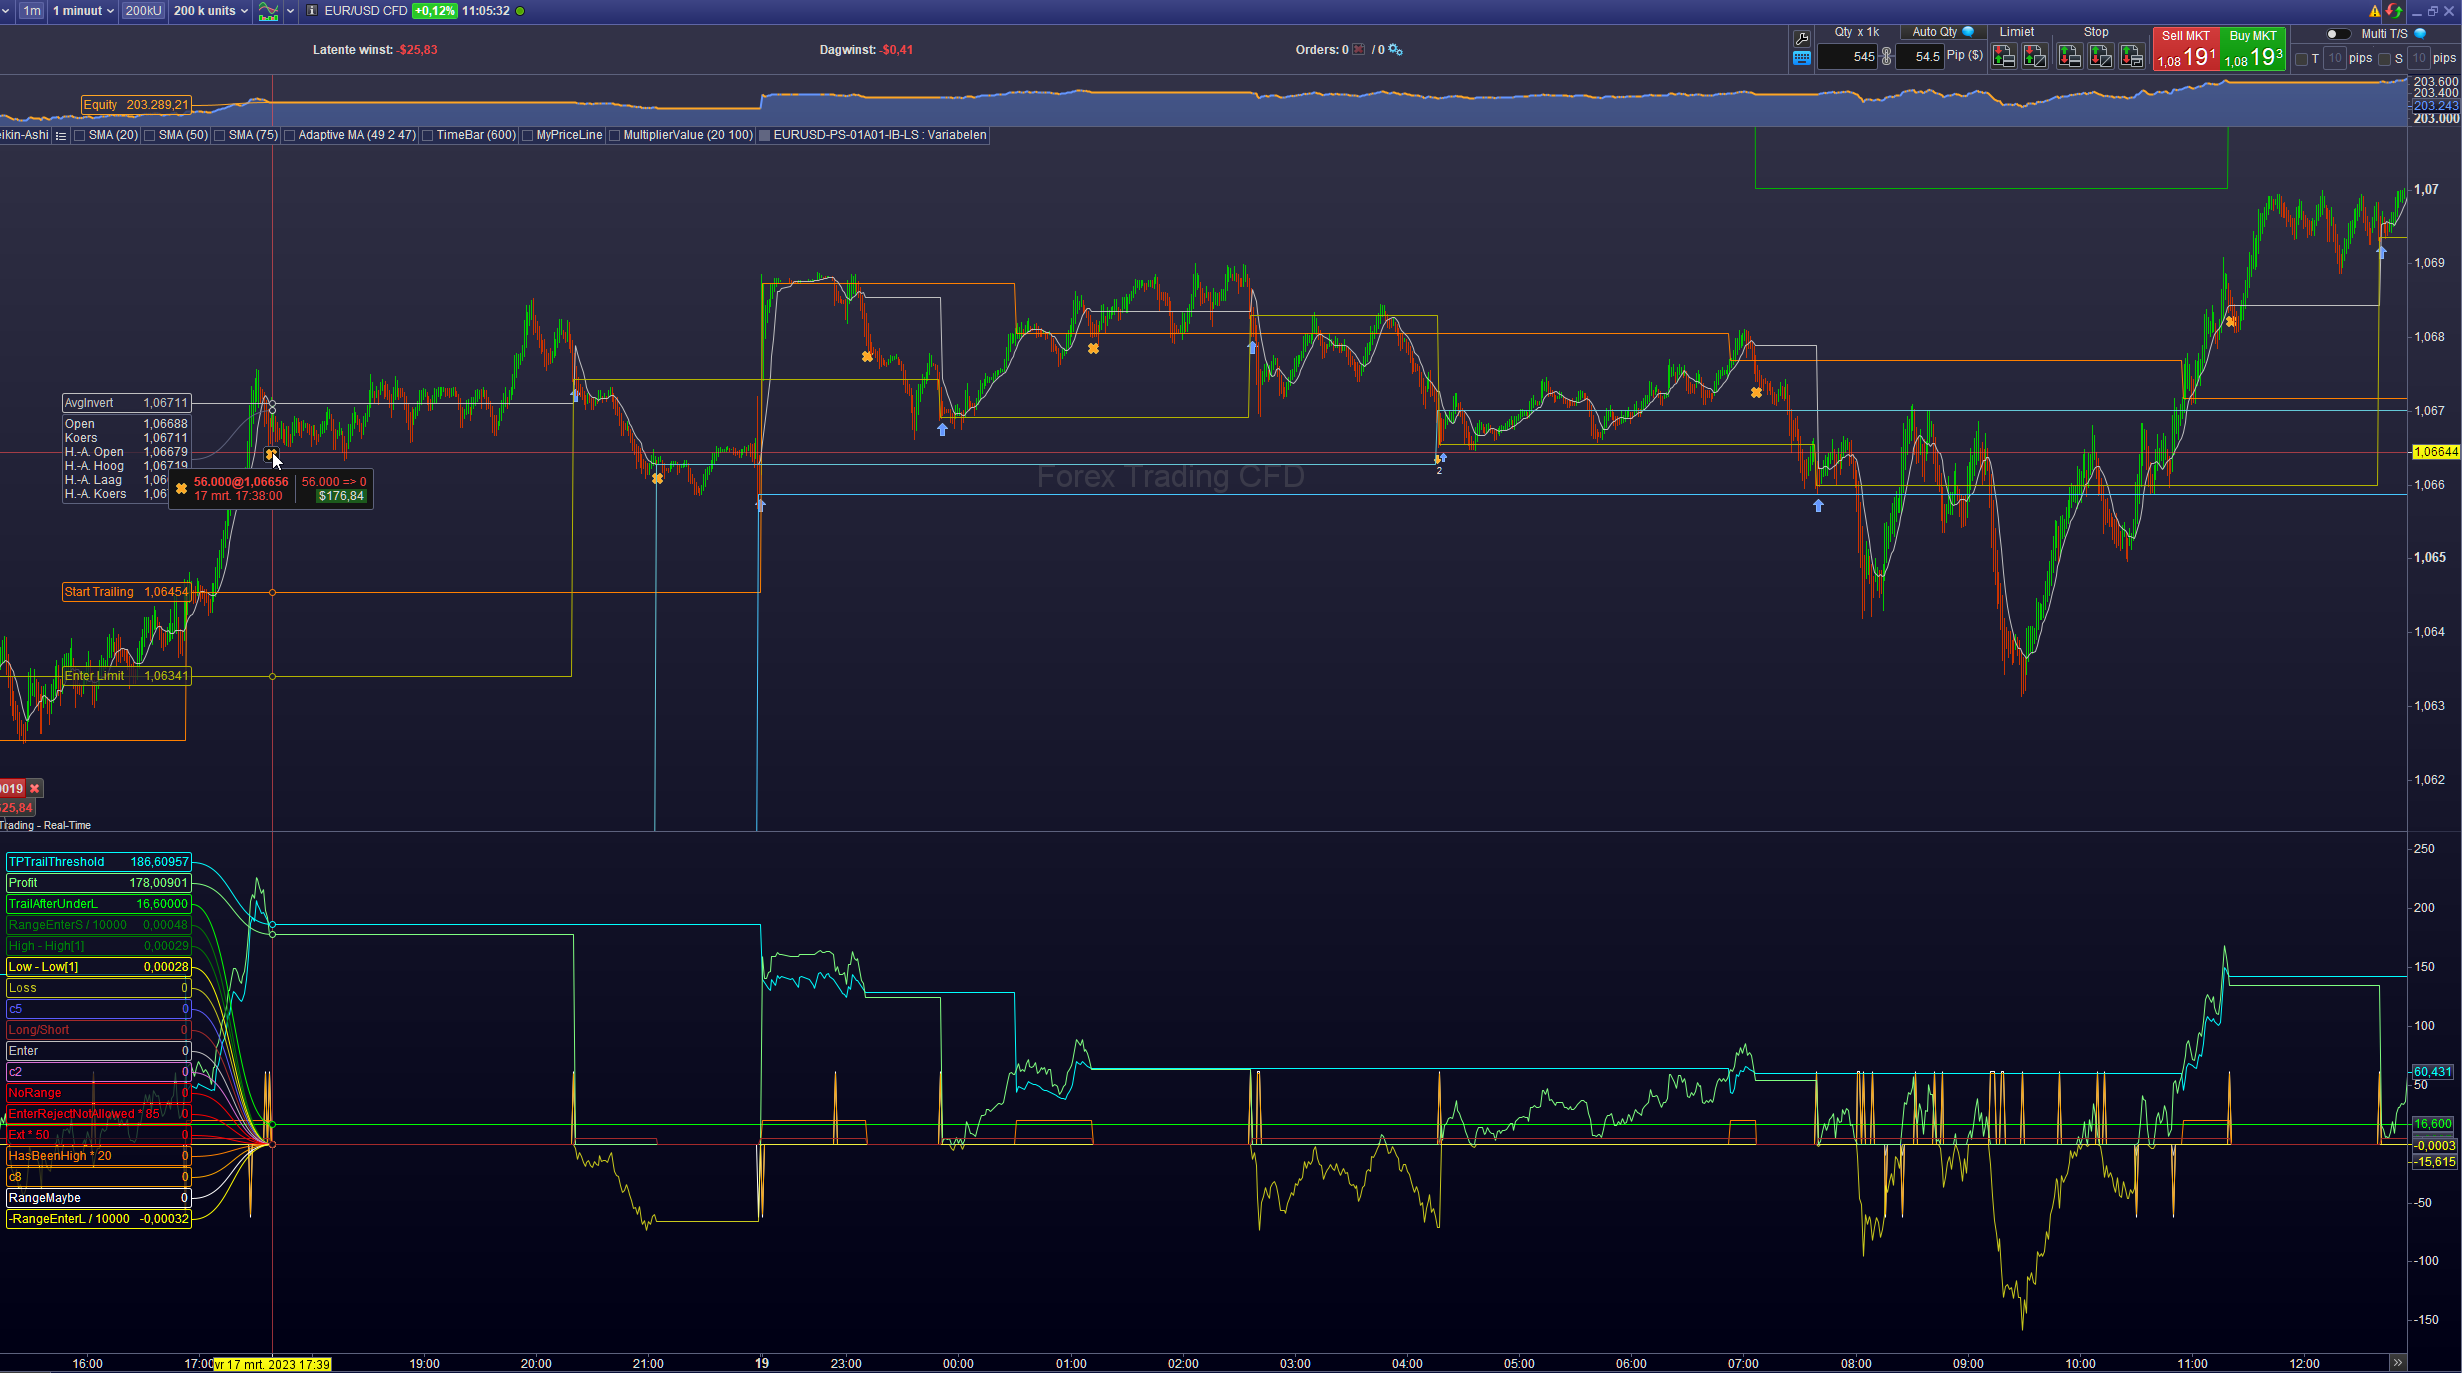
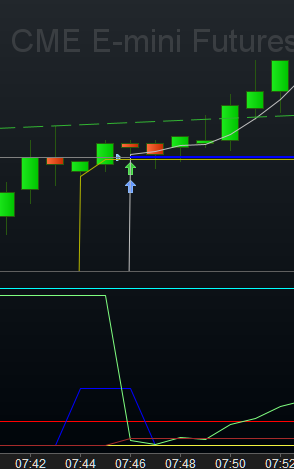
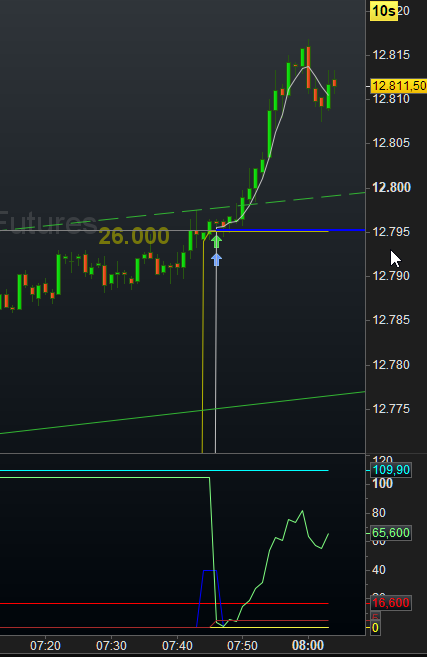
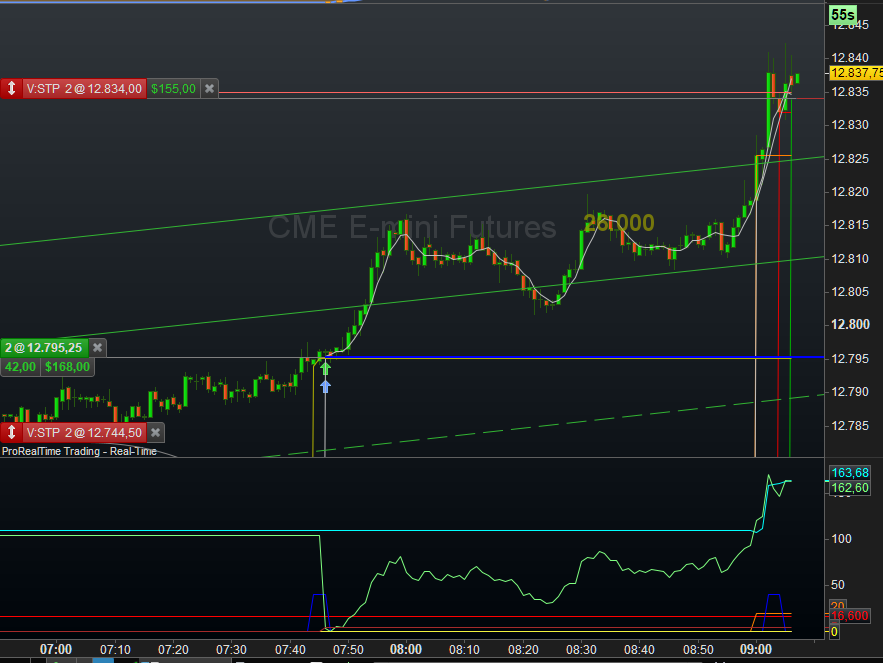
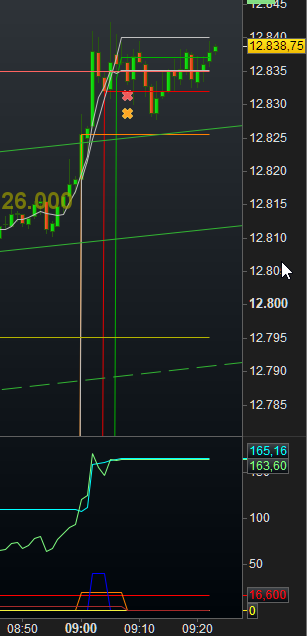
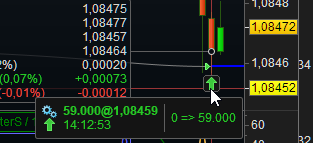
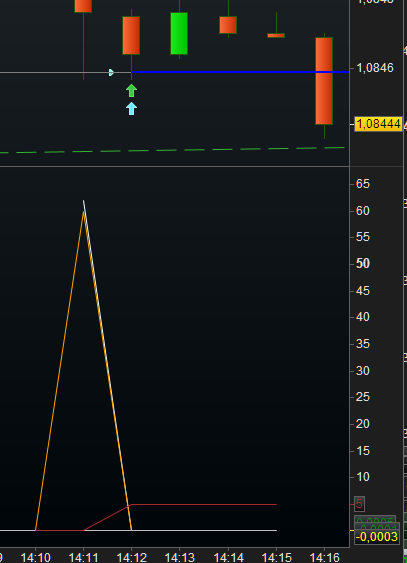
    So your code is called per bar, which means : at the end/close of the previous bar or shall I say “in” the current bar. Yes, that is better to understand. So your code executes in the currently building bar and is applied when the next bar opens. Thus, place a Market order in your code, and this order is handed to the broker when the next bar opens. Assumed the order will be filled, it is thus filled when this next bar opens, and you can see this per the little triangle which will be positioned at the opening price of the bar (when readily filled). For such a triangle,  see the 1st screenshot below (which is not about a market order), where you see the blue triangle for the forward(back)test, and the green one invisible right under it because the real time (live) green one falls on quite the same (price) position (it sits under the blue one). In the 2nd screenshot I zoomed out a little and you see my graphing going along with reality, BUT this is updated once per (1 minute) bar only. This is a good thing (once per 1 minute = once per bar in this case) because this is exactly when the variables we set (given a value). Thus this shows exactly what is happening. The green line in this case (also see the earlier large screenshot) shows the profit. Not that I need to see the profit, but if I make a trailing system, I must be able to see that working as intended. So again see the earlier large screenshot and the blue trailing line. Without that, making a trailing system is impossible. Oh, we could copy from Nicolas or Roberto’s code examples, but you would not be able to see whether it ever works or not. Hence the one million questions in this forum because people can’t understand what is happening.

    Ah, that was your problem.

    The blue little peak in the bottom pane, shows in this case the three bars the system has to Enter which goes by Limit order. Well, you see that this worked out, but the blue peak could have been there without “position” because the order was not filled (read : and/or the set price was not reached).

    Debug data (you ask for) us virtually not something I personally ever use. This is because it is too static or else – for this environment !- would depict too much hassle to step through all what’s to be observed. Mind you, this is per this one bar where things went wrong in your (my) opinion and it would take a 100 years to sort tout things. I have no time for that. Not here and not in my other lives. However, I use log files all over the place. They continuously run along and when something seems amiss, I observe the log files, which of course are date/time denoted. Yes, that is crucial, and no, within PRT this is not possible.

    Back to the graphing – with that you can do all. Well, for a happy few that is, because 100% of people minus myself, would attest that reality will not show the same as forward(back)test does. Indeed it takes a lot to get this right and maybe my codes are 1000s of lines because of this only. But it really can be done, see the screenshots for the example. But funny : once you have this under control and arrived there because of the explicit goal to do *that*, you’ll have your backtesting working as decent as reality will be. Think a bit about that.

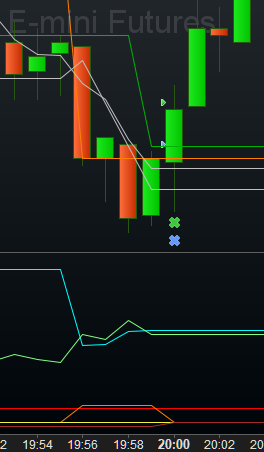
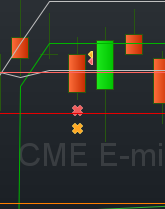
    Advise for now : don’t do anything else but get acquainted with this graphing. Create a Limit order and draw a line at the price you do that (the I think yellow-ish line in the large screenshot). Next, check whether indeed the limit order was filled (just per backtest) and whether the line went right through the heart of the little triangle. OK, see the 3rd screenshot below, where I show the green line, which is a (pending) Stop order. You see it going right through the heart of the triangle indeed. But you also see that the green triangle is at another place. Here, within that again one minute bar, reality was a little different from(my) theory, which is related to no real market being present for backtest. Please notice : this 3rd screenshot is from backtest and not from forward test. This should not matter much, but depending on what PRT does with historical data, it may matter slightly. In general though, for 1 minute bars any backtest will fall over historical reality. Meaning : if I show the past via backtest, the live occurrences are there just the same and they almost always match the backtest (again). … I am not sure whether I explained this clearly, but this is about first doing everything in Live (or Demo) and then with the same code you apply a backtest upon the history Live ran over. Now all should still match.
    When you have this all set (then 100% minus 2 people will attest that they can do it) you can start making your strategies. Unless you can not program/code as such. But you can …

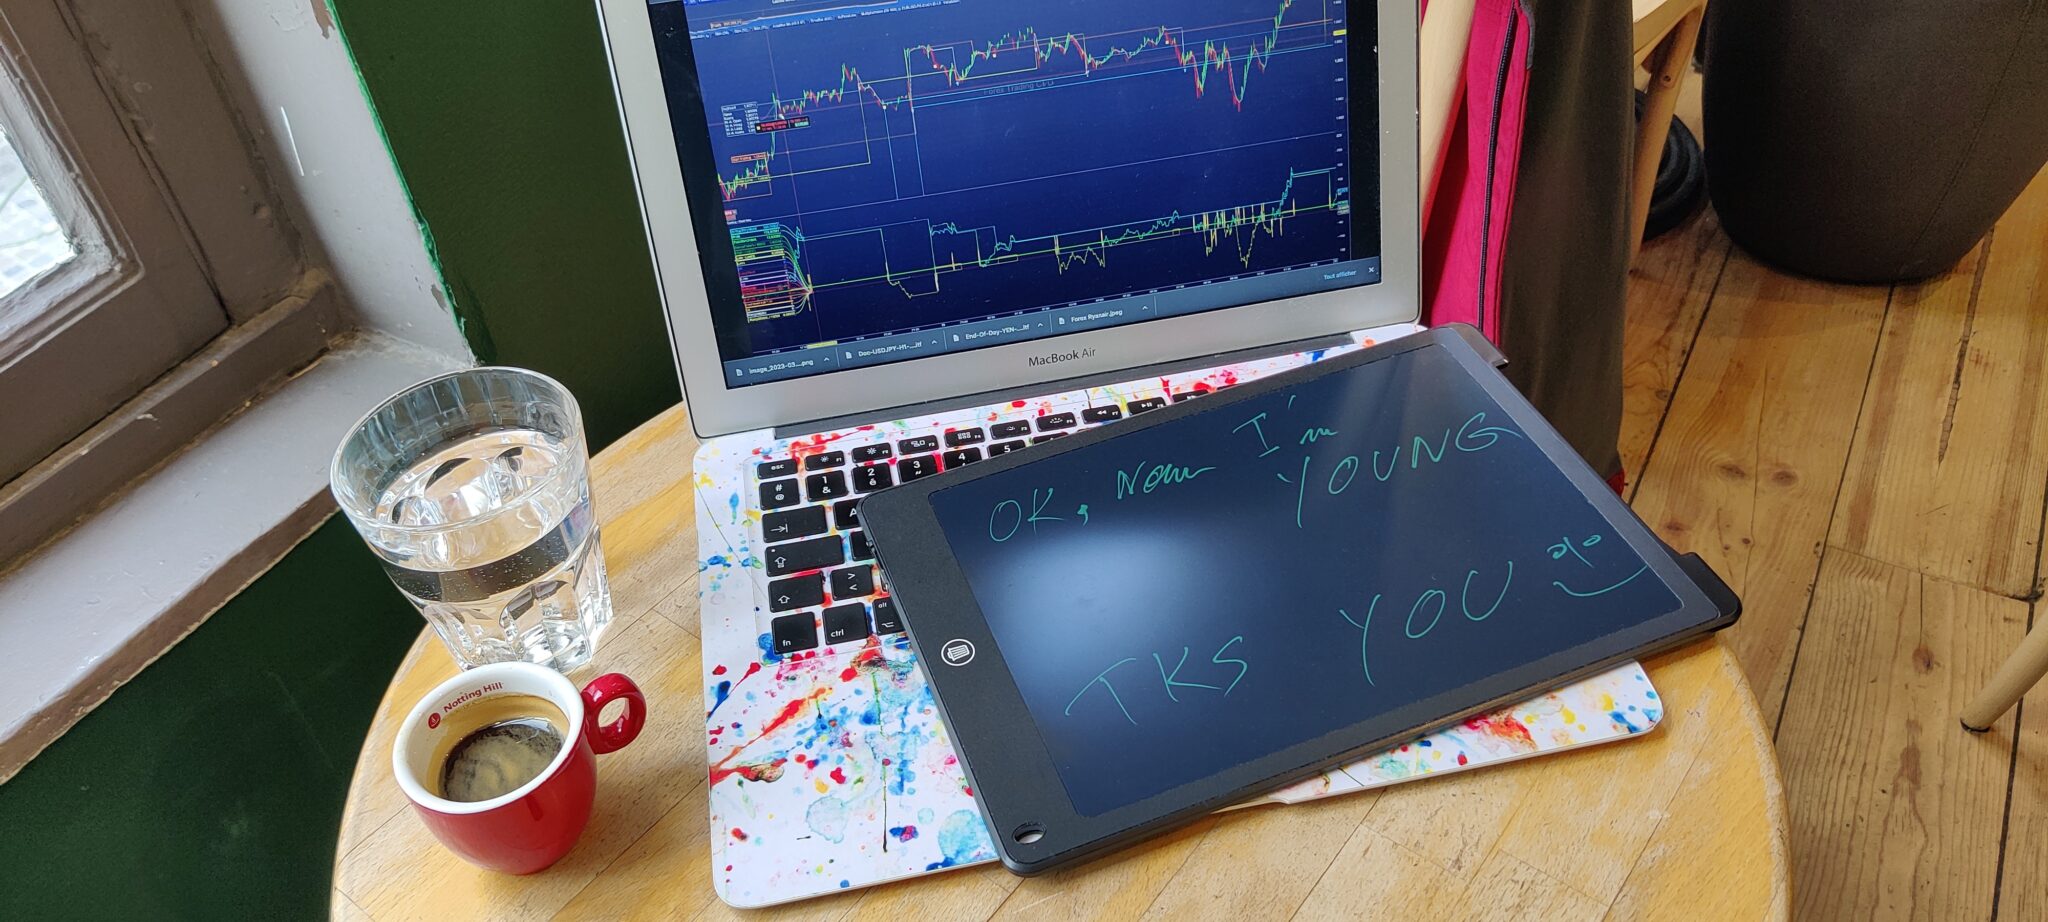
    Meanwhile my little code started the trailing phase. See 4th screenshot. Now is this fun or is it !


    1 user thanked author for this post.
    #212359

    PS:

    #212377

    Ok, Now I’m young,

    TKS you 😊

    I will read and try to understand 🙂

    #212391

    LOL – that makes my day. 🙂 🙂

    Maybe don’t put your tablet on your keyboard because all sorts of unexpected orders may occur. Next you startle so much that the coffee plus the water go into your keyboard and the macbook goes blank, the orders still there. But OK, you will be left with the smiley on your tablet feeling young forever with less money (or not !).

    2 users thanked author for this post.
    #212404

    Tks you for your long message ☺️

    #212406

    sorry for my bad english but I think you can understand,

    I totaly agree with you about what you said, and yes also you give me some idea and some understanding and also more question

    I think the most of code is executed in the current bar, they calculate all and get all history and they wait for the last close candle for complete the math with the last close value, in other way to explain my idea is : how it’s possible (maybe yes) to do all this math in the moment of closng the candle for to be read for the next candle in a short time, sometime you know the information you need it’s on a big history, so if the programm have to goback to get all information and calculate in the Time, it’s maybe possible with my small code but how to do it witha big and long code, the idea again or question is : can we mesure the time of the programm take for give the result, the answers I think is No, in PHP you can mesure the time of execution on one script or one page for exemple

    about my question for debuging, you are right, we don’t need just a debuging, but I think you understand me, we need a complete solution, and about the OO, I’m not sure but I think it’s possible to call some function and get result as a small class, it’s sure it’s not the best because the documention it’s not very clear, but for me it’s will be maybe helpful, I don’t know, because I also saw it’s very good to call fonction for get a best time execution,

    about you idea of 2 tiangle, I don’t realy undertsand what is the difference now, maybe after 2 or 3 days I will 😅

    about draw graphic in the candle price frame, maybe you help me here, I saw @JC_Bywan he answers me already, tks to him

    Also I’m from Lille nord of france, and I saw you are from luxembourg, so not far and maybe you speack french, I know in your country it’s a big mess in the school with all the different langues you have to know 😅, if you have time a week end I can go to meet you and drink a coffee, I will maybe stay one nigth in hostel, it’s just 300km

    #212427

    All the Luxembourg flags you see come from Holland. 🙂
    So that is a little further away. One thing : we drink a lot of coffee. 🙂

    The triangle denotes the exact price the order was filled with. There can even be several triangles (all Live ones) when the order filled at several prices. I currently don’t have a live example of that.

    I later (for you) added the Backtest, which shows in the 2nd screenshot. It is not very clear maybe, but the blue triangle now (exactly) overlaps the green one.
    For you – and everybody – the triangle is important, because it will tell you whether you did things correctly in the program. If your graph (not shown here) doesn’t go right through that triangle, you may be at the wrong side of the price (like a Pending Stop above the price). In that case, your graph will be where you put it (like on the desired close price) but the triangle will be on top of the next bar (opening); it boa acted as a Market order.
    Etc. …


    #212434

    how it’s possible (maybe yes) to do all this math in the moment of closng the candle for to be read for the next candle in a short time, sometime you know the information you need it’s on a big history, so if the programm have to goback to get all information and calculate in the Time, it’s maybe possible with my small code but how to do it witha big and long code,

    The amount of history to “calculate” is up to you, and is for example done by means of the Average function. Thus, if you want the average from 100 bars (like 100 x 1 minute) then this requires 100 determinations of the price, plus some mathematical hoopla to calculate the average.
    For a well written C program and appropriate in-memory database this takes maybe 0.0000000001 second (I just typed a few zeroes, but think a few cpu cycles at 4GHz, per bar involved).
    The point of course is that when you backtest 1 million bars, this has to be done 1 million times for 1 iteration of the backtest (one combination of optimization variables). So all together that will take long(er), but this is not what you were talking about.

    Yes, I can see that the execution of the program (remember, this happens for each bar) takes longer with more lines of code, but it is merely the longer math involved which plays the key role. Thus for example, I see many examples passing by with beautiful loops to work out things, and this is exactly what should not be done. Think like this :

    • Bar ends and program is called.
    • Program executes and takes 10ms to do all.
    • Now possible orders are given to the broker; that too needs maybe 20ms (just guessing something).
    • When all is done, people can sell what you wanted to buy.

    When the above takes 60ms all together, nothing is a problem. One thing though : if my program and all takes 55ms because my program executes in 5ms and yours in 10ms, I will have the better price.
    Is this important ? nah, not so much. However, when I have a limit order in a silent market it will be crucial, because I will have my order filled and you not at all.

    Meanwhile it is not only the broker requiring some time, it is the travel time over the internet from PRT in Paris to e.g. IBKR in the USA, and the PRT servers themselves also need time, especially when you and me execute our programs at the same time. And 100000 trades put in their manual orders in the PRT system.


    in PHP you can mesure the time of execution on one script or one page for exemple

    No that is not possible. It would interest me, but I will be able to live without it. Something else is that I would like to graph something from the top of the program and further down the line again – the same variable. But sadly that can’t happen. And this sometimes is crucial for debugging.
    I wonder whether the real debugger will bring changes to that, as it would require stepping through your program code (line for line). I don’t think it will do that and instead will show end of bar data only – the same like the graphing works. Maybe I am too negative. 😉

Viewing 15 posts - 1 through 15 (of 16 total)

Create your free account now and post your request to benefit from the help of the community
Register or Login