Price Index 6 months

Price Index 6 months

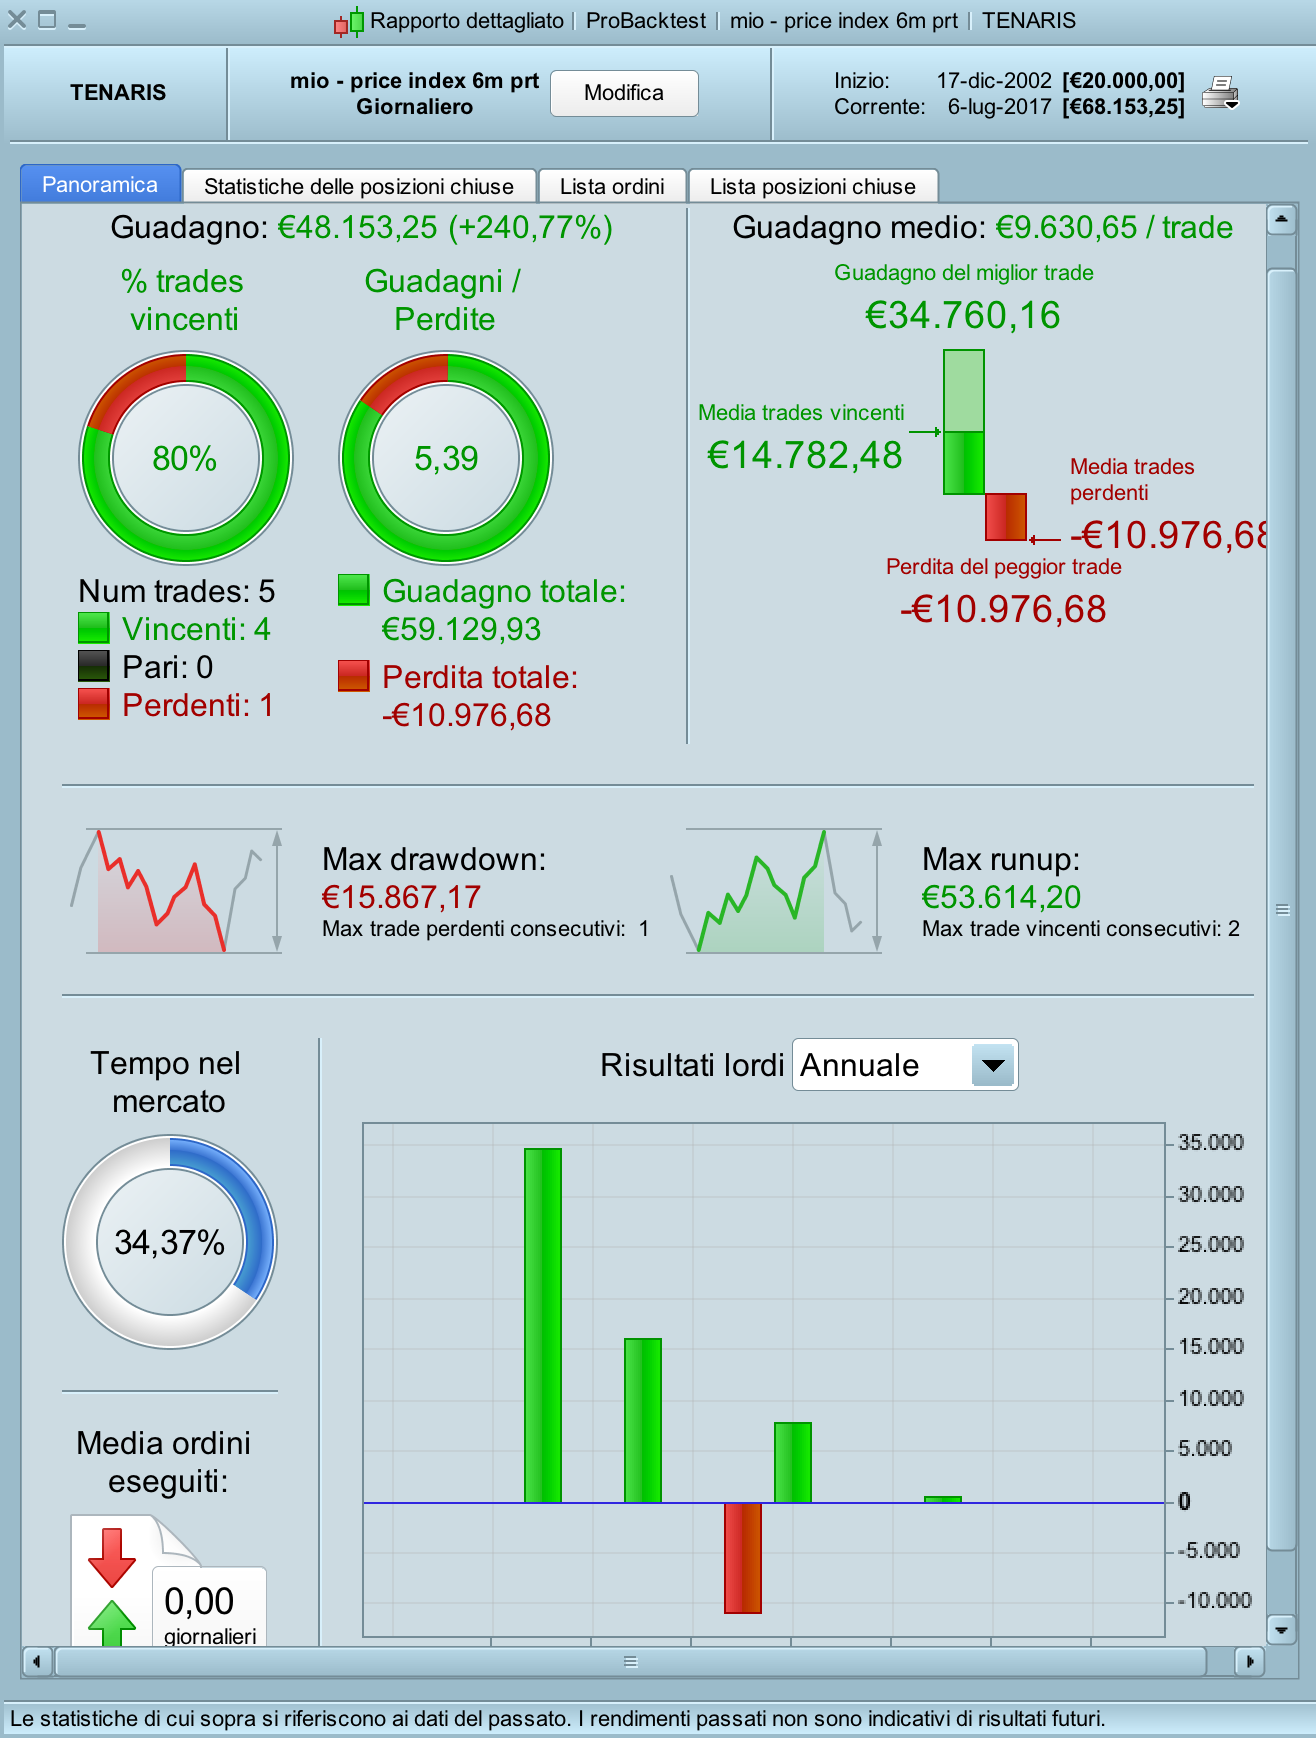
I wrote this strategy hoping to start some discussion on value trading vs. day trading and also to give a different option to people with little time available.

I adapted a buy-and-hold strategy based on the price index 6 months with an long-only-entry. When the close of the day crosses above 144% to the price registered 6 months ago we go long and we hold the stock for 1 year (apron 254 bars).

As I said it’s an adaptation made for automatic trading!! With Italian stocks the results are very good but might be MUCH better if you used Price to book (P/B) and  Earning yields (EY) to confirm the entry. Running this strategy manually with the use of P/B and EY12 months, and using a portfolio, returned an average of 55% a year in the last 10 years (Only one year I didn’t beat the market).

Blue sky!!!

Share this

Risk disclosure:

No information on this site is investment advice or a solicitation to buy or sell any financial instrument. Past performance is not indicative of future results. Trading may expose you to risk of loss greater than your deposits and is only suitable for experienced investors who have sufficient financial means to bear such risk.

ProRealTime ITF files and other attachments : How to import ITF files into ProRealTime platform?

PRC is also on YouTube, subscribe to our channel for exclusive content and tutorials

  1. Nicolas • 07/07/2017 #

    Very interesting but why 144%? What about the drawdown of the portfolio? The one from this single stock is already huge! 😉 

  2. Kenneth Kvistad • 07/07/2017 #

    I have never been wondering about long trades or made any due to overnight costs, butdo you think it still can.be affordable for such long trades as months/years?
     

  3. gabri • 07/07/2017 #

    Nicolas,
    144% was just an adaptation to make the automatic trading. Any number between 140% and 150% is fine. You should take the 20-40 stocks with the highest 6 months Price Index and search their fundamentals to pick the right one. Drawdown are not really a factor when you buy and hold value stocks.
    This was actually a real trade I made but I bought only in September 2004 since P/B was 1.4 (expensive but not too bad for the market of that moment) and the other fundamentals were promising. What I wanted to prove is that there are bizilions of trend indicators on the various trading platforms but the real big wave worth surfing is the one started by the institutional investors and they buy GOOD companies for CHEAP. Price index (for momentum) and fundamentals are the only data they use. 
    Having a portfolio made with stocks selected with fundamentals leads to really high performances (they almost always beat the market), even better the one of this single stock.
    G

  4. gabri • 07/07/2017 #

    Kenneth,
    I buy stocks, hence a part of a business. For stocks there are not overnight fees. You find overnight fees for CFD and derivatives. On top of that I go LONG only. With my bank I pay approx 3.5 Euros everytime I buy and the same amount when I sell. It’s totally worth for me.
    G

  5. Kenneth Kvistad • 07/07/2017 #

    Ah okay. You can make automated trading with stocks as well 🙂 ?
    I dident know that

  6. gabri • 07/07/2017 #

    Kenneth,
    I manually trade only but I decided to code this strategy to show that there is more than intraday trading and this “more” might lead to substantial gains with less work and stress (on the stress I am not so sure 🙂 )
    G

  7. luxrun • 07/07/2017 #

    Hi Gabri,
    I realized screener with the specifications of your trading system. Do you give me feedback on its reliability? This is the code:
    // Price Index 6 months
    thr=44 // entry thresholdref=close[130]*(1+thr/100) // price entry levelcond1=(close CROSSES OVER ref)
    SCREENER[cond1] (Variation AS “% Var barra prec”)
     

  8. gabri • 07/07/2017 #

    Luxrum,
    I would personally  just make it like this:
    thr=44 // entry threshold
    ref=close[130]*(1+thr/100) // price entry level
    cond1=(close > ref)

    SCREENER [cond1] (ref AS \"Price index\")
    so you can see ONLY the stocks that meet the condition and they will be ordered by the amount of gain in the last 6 months. You want to pick the top 20-30 stocks in the list so the amount of gain is important. Like I already mentioned 44 is not a fixed umber. If you’d rather use a yearly return you can lower the threshold to 30-ish. The setting are very personal.
    G

  9. gabri • 07/07/2017 #

    Also, don’t forget to make sure you are buying stocks with low Price to Book ratio.
    G

  10. gabri • 07/07/2017 #

    Luxrun,
    I wrote the previous answer in a rush. Try this code:
    thr=44 // entry threshold
    ref=close[130]*(1+thr/100) // price entry level
    cond1=(close > ref)
    pi6m=100*(close-close[130])/close[130]
    SCREENER [cond1] (pi6m AS \"Price index\")
    Now you will see the stocks that meet the requirement and they will be ordered based on their gains. Sorry for the wrong code of before.
    G

  11. luxrun • 07/07/2017 #

    Thanks Gabri for your screener rework. I\'m working on producing the indicator to get the graphic signal on the chart. It seems to me important to understand when it signals in the six months considered by the trading system. Luxrun

  12. gabri • 07/07/2017 #

    Luxrun,
    non ho o capito di cosa hai bisogno?
     

    • luxrun • 07/07/2017 #

      Nulla di particolare! Scusa il mio inglese tradotto da google. Dicevo solo che sto provando a costruire l’indicatore che mi mostra a video quando scatta il segnale long, nei sei mesi che il trading system, prende in considerazione. Non serve a molto, ma forse aiuta visivamente. Grazie Luxrun

  13. gabri • 07/07/2017 #

    Luxrun,
    no problem per l’inglese. Ti posso fornire due soluzioni. La prima disegna la linea del 44% e quella del prezzo:
    a=close[130]

    linea1=(1+44/100)*a

    return linea1 style (dottedline,1) as \"44%\",close coloured (205,0,0) as \"Close\"
    La seconda ti disegna il ritorno degli ultimi 6 mesi e quando passa il 44% ti segnala la zona positiva:
    a=100*(close-close[130])/close[130]

    return a,44
     

  14. luxrun • 07/07/2017 #

    Benissimo, grazie, molto gentile e disponibile! Lo provo subito.  Io avevo scritto questo codice (ma programmo poco e male…), per l’indicatore:
    // Price Index 6 months indicator
    thr=44 // entry thresholdref=close[130]*(1+thr/100) // price entry level
    // conditions to verify entry longc1 = (close CROSSES OVER ref) IF c1 THEN
    cross = 1
    ENDIF
    return cross as “CROSS”

    • gabri • 07/07/2017 #

      Il tuo codice va benissimo, continua cosi’!! dovresti solo aggiungere una linea per fare in modo che cross non rimanga sempre uguale a uno:
      c1 = (close CROSSES OVER ref)

      IF c1 THEN
      cross = 1
      else
      cross=0
      ENDIF

      return cross as “CROSS”
      in questo modo ti da dei picchi quando avviene il cross over (e solo quel giorno). Oppure puoi fare cosi’:
       

  15. gabri • 07/07/2017 #

    c1 = (close CROSSES OVER ref)
    c2 = (close CROSSES under ref)
    IF c1 THEN
    cross = 1
    ENDIF
    IF c2 THEN
    cross = 0
    ENDIF

    return cross as “CROSS”
    In modo che cross rimanga uno fino a che il valore di gain e’ superiore alla soglia.
     

  16. luxrun • 07/07/2017 #

    Grazie, Gabri, per il tuo supporto e aiuto. Ti sono veramente grato! Continuerò a seguire il tuo lavoro! L 

  17. Alain Federmann • 07/07/2017 #

    Hi Garbri,

    Thanks for your share. This is a very interesting strategy.
    Does anybody know an indicator using P/B ratio to get sharpest results ?

    • gabri • 07/07/2017 #

      Alain,
      there is no way to get p/b data on PRT. Unfortunately you have to get this values from the balance sheet of the company you are planning to buy. What I do is just running a screener based on price index and check the P/B of the first 20-30 companies on internet.

  18. Alain Federmann • 07/07/2017 #

    Ok, thanks.
    That is what I thought.
    Pretty weird and such a shame a powerfull tool as PRT can not use few fundamental analysis statistics.

  19. gabri • 07/07/2017 #

    Ho knows, maybe in the future they will 🙂

  20. Miguel1980 • 07/07/2017 #

    Hello gabri ,

    well, with the results you mention, even with half those results, it does seem a very promising strategy. I totally agree on the fact that fundamentals can make or break strategies in the long run. In my opinion, using only TA or Price Action concepts is, to some extent, like playing casino: you can win, but is very hard to beat the market clearly and consistently.

    You say you use the P/B and EY metrics. No problem with the first but I have some doubts about the second, just, if I’m not wrong, the inverse of the overused P/E ratio, which in my mind doesn’t seem to be the finest of the tools when we think of forecasting the future price evolution of a stock. Looking forward to know your opinion/experience about it.

    As a guide on how your strategy works, could you run a screening for us interested, preferibly on an US market (Italy would be OK too, if you prefer so), and then explain which stock/stocks you would choose and why? When you have the time and just the once, don’t worry!

    Thanks for now.

  21. gabri • 07/07/2017 #

    Hello Miguel,
    The reason why I switched from trading to investing because I didn’t like to play casino anymore 🙂 You are right, EY is pretty much the inverse of P/E ratio and for many P/E is not a valid reference number but used properly raises awareness on what is going on. I suggest you to read the work of Shiller (a nobel price) and his use of a 10-year-PE to predict markets. I do not use only P/B and EY but I personally check all the balance sheet of a company and, if good, I try to buy at a low PE or PB. Unfortunately I cannot run any backtest because I cannot make a code to find cheap and good companies on PRT and also because you need to backtest a portfolio. Every single stock will lose at some point. Using this system will allow the portfolio to win.

  22. Miguel1980 • 07/07/2017 #

    Hi gabri,
    I was not asking you to run any backtest but a PRT screener on any market to find 20/30 stocks currently with the best (best according to your strategy) PI 6m index, and then to share some thoughts about which one to pick up, based on their P/B, EY or whatever. Simply following the thread of the post.
    But personal strategies are just that, personal, aren’t they?, so I won’t insist :- )
    Thanks for your time.

  23. gabri • 07/07/2017 #

    Miguel, copy. I just came back from vacation, I will pass you some data soon.

  24. gabri • 07/07/2017 #

    Miguel,
    I will give you some stocks. I would buy (I probably will) Serneke group AB. I will wait for the following to have a good PI 6m: gelek group, awilco drilling, arteria sa.

avatar
Register or

Likes

avatar avatar avatar avatar avatar avatar avatar avatar avatar avatar
Related users ' posts
Jan
5 years ago
Kovit Hi guys, please could someone help with a bit of Ichimoku code that will improve performance...
Kovit lol I should be more exact with my wording, more accurately I was looking for an indicator t...
jm121212 how can we change the default settings?
nfulcher Please could someone explain how the following code is calculated:- iDI = TEMA[3](DI[DI2]...
oakenstream Jan, I find sometimes that the priceexit variable is never set. It seems to happen when the ...
Matt66612 I do not understand the first time I launch the backtest I got the same result as you. but ...
darbes Hi How does it go on live ? JC
antonio73 Balmora74, io vedo che funziona anche su timeframe ad 1 minuto con piccole ottimizzazioni, t...
Juananantoniorodriguez hola buenas, a este sistema automático, Cómo se le podría poner un stoploss de beneficio sim...
Exalaxe Hey, i just noticed you optimized this strategy. Could i see your new version, please?
Andrea.1981 sorry i add my code but it not enter why i dont know
Andrea.1981 this is code simply stop , and you can see another version for stop / Codice principale...
AntoGH how did you backtest it ?
PastaPesto @AntoGH , I dont know if you are asking me, but my backtest was made in an IS of 4 years bet...
Ridder @PastaPesto Do you still running this and how is the results? Thanks
avatar
unkown ;-) sfido chiunque a riuscirci!
avatar
unkown infatti basta leggere i post degli altri....
nicola papangelo ciao Francesco vorrei contattarti su facebook o in privato. Grazie
Francesco78 @nicola onestamente non ricordo se lo avessi scelto anchored or ananchored.
debs83 Is this strategy standing for DAX please?
Nicolas Title says that it is for Hang Seng
juanj @Holy Grail, glad you like it. Would you perhaps mind sharing your results here: https://www...
CaptainCaveman I am reluctant to say this buy I was a member of Dr Elder trading group for a while . The fa...
micquan The design is too complex and the performance is low.
Janfi Hello, I'm new to ProRealCode and I do not understand the following summation[n](indicator...
Kaci It seems he's just checking that the previous MACD is < 0 for maximum one period ? I'...
Daniel Martin Hi do you know how have and entry after the second cross? There is crosses below 0 and cross...
Maik2404 wie kann ich den Code bekommen Paul?
jens_kittner Works with US Crude at 1h as well!
Jean-Claude REGIS Je préconise de regarder les graphiques H1 et M15 pour visualiser la tendance de fond et d'...
Maik2404 es sind leider nur long Positionen und keine Short zu erkennen.
Maik2404 Vytautas: es bleibt aber nur bei long Auslösungen
ullle73 this one is not a winner, have backtested it on almost all pairs, does not have an edge
Paul the last update can be found in topic Strategy DayOpen Straddle for DAX on page 14.
bertrandpinoy l instruction GRAPH pose problème sur PRT... pas vous? cordialement
Nicolas Supprimer simplement les lignes avec GRAPH pour passer en ProOrder, trading live.
Nicolas Thanks for the update David!
sublime06 quelle parametre utilisé vous pour obtenir ces resultat ? merci
ullle73 you still use tihs one David?
Juan Salas Hi FULVIO09, Nice piece of work. It seems to work very well. Does only work for INDEXES??...
Johann Hi @FULVI09, I understand the instructions however I'm not too sure how to determine the "p...
Player8520 Hello, It doesn't work with me either. However, I changed AA to 180 on line 15, added th...
TraderFelix
6 years ago
Bebbo Thank you for your contribution. I have tested your system on some instruments and I like i...
bertrandpinoy bonjour j ai tente l installation mais PRT m indique que ce code ne peut etre utilisé qu en ...
Nicolas en effet, il faut utiliser l'éditeur de code ProBacktest, il ne s'agit pas d'un indicateur m...
odin i use it on daily Chart only. i use it on stock market for long only startegies. i´m no fan ...
noisette Hi Odin, Thank you for the code. I made sone test with M1 timeframe and results have to be ...
Onega Sorry, a quick question I cannot see on forum please ?...Using ProScreener, how can we get t...
Xusto Hello, Fully Agree, I will update it with your advice. Btw Can would you like share you co...
Niklas johansson hägglund do you now if it's possible to use this strategy with this code in tradingview also?
Alexander9 This code for metastock ?, can for amibroker . Thanks
Leo Does it opens pending orders?... maybe they were not trigger.
Mattzi Dont know, all i can see is that it opened an order yesterday in backtest but not live. Th...
Jean-Christophe Hello Leo, when running the strategy from 29/12/2015 to 31/08/2018 on ProRealTime Premium, I...
Petersson Kristian Hi when I do back test I get 0 results, what do I do wrong? Trade Well Chris
JohnScher Yes i did before, see library/strategys/repulse and dpo https://www.prorealcode.com/proreal...
JohnScher Don't know what you're doing wrong. Import ITF and observe time zone settings. This should...

Top