

Advanced Trend Trader
About 6 months ago I had some time to look into some of the more advanced technical indicators created by John F. Ehlers. For those of you who do not know who he is, he worked as an electrical engineer at one of the largest aerospace companies in the industry before retiring as a senior engineering fellow. He specializes in technical analysis and is also the founder of Maximum Entropy Spectrum Analysis. You can read more about him here: http://www.mesasoftware.com/about_mesa_ehlers.htm
Using the vast code base of MetaTrader I started experimenting with some of his indicators trying to create a robust trend trading strategy that aims to get us onboard new trends as early as possible but at the same time keeping us out of potentially weak or flat trends that will end up going nowhere. In the end, I combined 3 of Ehlers’s indicators with one of Dr Alexander Elder. Then to top it off I combined it with the Ichimoku Cloud with which I have become very accustomed to.
In order to automate this strategy, we first had to translate these indicators to ProRealCode. With the assistance of Nicolas, we managed to do so. See the forum topic here: https://www.prorealcode.com/topic/need-help-to-automate-these-mql5-indicators/page/2/
The strategy rules are as follow:
-
Only take trades in the direction of the color of the Elder Ribbon
-
Validate the strength of the Elder Ribbon using the Ehlers Inverse Fisher Transform. Color must match the direction of the trade. i.e. green for long. Additionally, a sell signal above the zero line will be stronger than one below it and vice versa.
-
Check trend momentum using Ehlers Inverse Fisher Transform of RSI. We do not want to take longs if the indicator is overbought (i.e. green). The opposite would apply for short positions
-
Check trend strength using Ehlers Fractal Dimension. Used in borderline cases to help make a decision (i.e. rule 6) on whether to wait for Tenkan-Sen pullback and/or if price breaks through the 200MA and we have to make a call on whether the re-test will hold or not.
-
If we are below the cloud (and also above Tenkan-Sen and Kijun-Sen) and conditions 1-4 are validated take a long position and use a close below Tenkan-Sen as a stop (up until rule 6 becomes valid). The opposite would apply for short positions. The exception to this rule would be if we are below the 200MA and below or in the cloud (and also above Tenkan-Sen and Kijun-Sen) and condition 1-2 is validated but we have a strong close above the Bollinger Band with a Bollinger W-Bottom structure taken out, take a long position and use the 200MA as target. Use a close below Tenkan-Sen as a stop. The opposite would apply for short positions
-
If we are above the cloud (and also above Tenkan-Sen and Kijun-Sen) and conditions 1-4 are validated take a long position if we are above the 200MA and the Ichimoku leading cloud points up. If not look to rule 7.
-
If we are in or above the cloud (and also above Tenkan-Sen and Kijun-Sen) and conditions 1-4 are validated take a long position as soon as we have a close below Tenkan-Sen (if rule 1-3 is still valid and Kijun-Sen is at least a couple of points below us). After a pullback to below Tenkan-Sen, rule 2 can be overruled by a strong rejection from either the Elder Ribbon or Kijun-Sen if the close are above the cloud. The opposite would apply for short positions
-
If we are in a long position and we have close below Kijun-Sen and Ehlers Inverse Fisher Transform is red, exit the trade and wait for re-confirmation of rule 7. The opposite would apply for short positions
-
If in a long position, remain in the position as long as the Elder ribbon remains blue and the Ehlers Inverse Fisher Transform of RSI is not green. If the Ehlers Inverse Fisher Transform of RSI turns green and the Ehlers Inverse Fisher Transform turns red, then exit at the first close below Tenkan-Sen. The opposite would apply for short positions
-
Only make one trade per trend i.e per Elder Ribbon color change
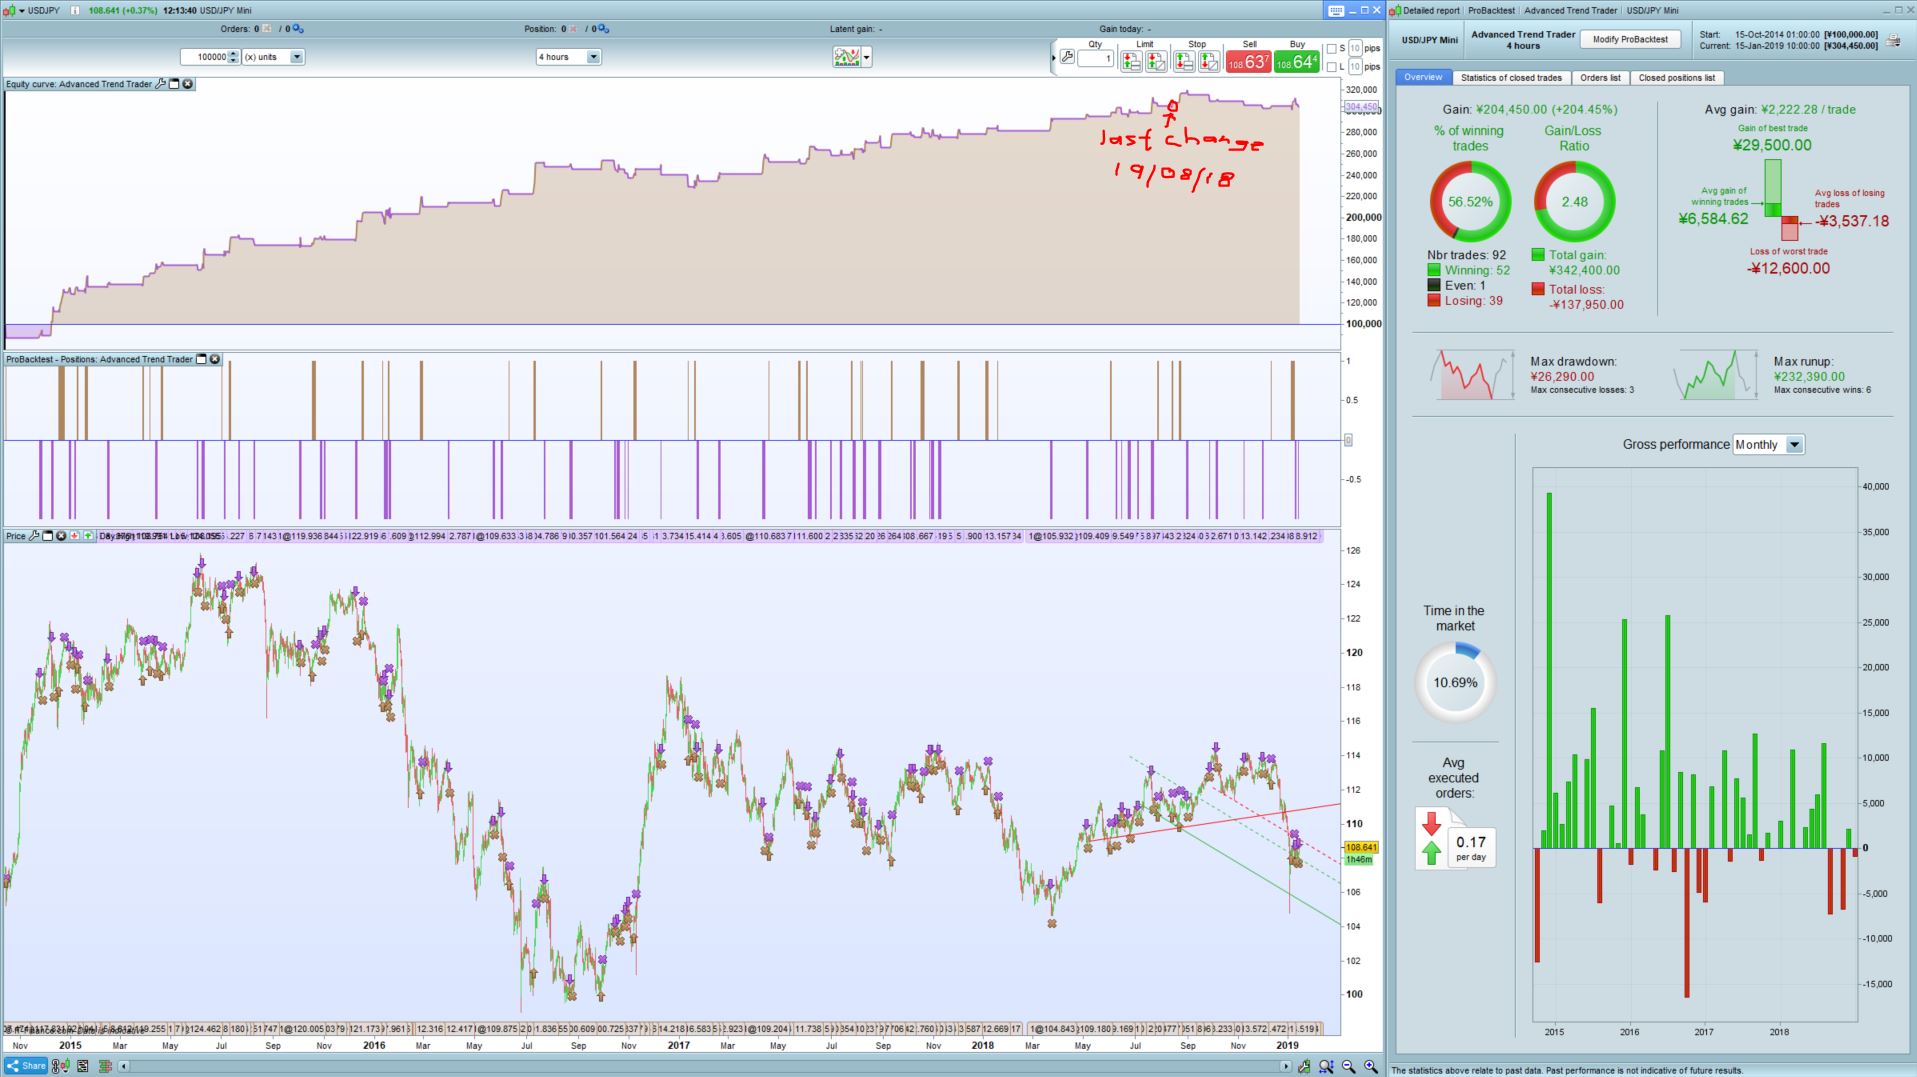
Keep in mind that this is a trend trading strategy so the aim is to catch big trends and stay on board for as long as possible, and larger time-frames better afford us this opportunity.
The below code is adapted for USDJPY, but rather download and import the attached ITF file because you would need to have the three indicators installed to use this strategy:
P.S. I have also had success with the strategy on the following markets:
- 4H US Crude with a spread of 5 and DigitFactor (Line 20) set to 4
- 2H EURUSD with a spread of 0.6 and DigitFactor (Line 20) set to 8
//-------------------------------------------------------------------------
// Main code : Advanced Trend Trader
//-------------------------------------------------------------------------
//Author: Juan Jacobs
//Market: USDJPY
//Timeframe: 4H
//Spread: 0.8

//Version 2.0
//Last Updated: 19-Aug-2018

//Disclaimer: Take note that as with any trading strategy, there is an inherent risk when trading in financial instruments.
//            The author shall not be held liable for any loss, so please ensure you manage your risk responsibly
//            Results cannot be guaranteed as past performance is not indicative of future results.

Defparam cumulateorders = False

possize = 1

DigitFactor = 8 //should be optimed between 1 and 10 to cater for different market types i.e. forex or indexes
PointFactor = EXP(DigitFactor*LOG(10))*0.0001

//Components

MA200 = Average[200,0](close)
BollUp = BollingerUp[20](close)
BollDown = BollingerDown[20](close)

//TEST
alpha = 0.09
Price=MedianPrice
iTrend=(alpha-square(alpha)/4)*Price+0.5*square(alpha)*Price[1]-(alpha-0.8*square(alpha))*Price[2]+2*(1-alpha)*iTrend[1]-square(1-alpha)*iTrend[2]
if barindex<7 then
 iTrend=(Price+2*Price[1]+Price[2])/4
endif
Trigger=2*iTrend-iTrend[2]

FastEMA = Trigger//Average[6,1](close)// can be optimized between 6 and 8 Trigger//
SlowEMA = iTrend//Average[13,1](close)//

TS = (highest[9](high)+lowest[9](low))/2 //Tenkan-Sen
KS = (highest[26](high)+lowest[26](low))/2 //Kijun-Sen
SA = (TS+KS)/2 //Senkou-Span A (projected 26 periods forward)
SB = (highest[52](high)+lowest[52](low))/2 //Senkou-Span B (projected 26 periods forward)

//IFTRSI1, LevelUp1, LevelDown1, LevelMid1 = CALL "Ehlers Even Better Sinewave"[50, 0.6, 0.6]
LevelUp1, LevelDown1, LevelMid1, IFTRSI1 = CALL "PRC_InverseFisherTrans_RSI_1"[11, 1, 9, 50, 100, 0](close)

IFTRSI2, LevelUp2, LevelDown2, LevelMid2 = CALL "Ehlers Even Better Sinewave"[50, -0.5, 0.5]
//LevelUp2, LevelDown2, LevelMid2, IFTRSI2 = CALL "PRC_InverseFisherTrans_RSI_2"[23, 0, 9, 50, 80, 20](close)

FractalDim, ignored, ignored, FractalLevel = CALL "Ehlers Hurst Coefficient"[30, 0.1, 0.9]
//FractalDim, FractalLevel = CALL "PRC_Ehlers_FDI"[30, 1.4](close)

LimitTrendTrades = 1 //Limits number of trades per trend change

If (FastEMA[1] < SlowEMA[1] and FastEMA > SlowEMA) or ((FastEMA[1] > SlowEMA[1] and FastEMA < SlowEMA)) or (FastEMA[2] < SlowEMA[2] and FastEMA[1] = SlowEMA[1] and FastEMA > SlowEMA) or ((FastEMA[2] > SlowEMA[2] and FastEMA[1] = SlowEMA[1] and FastEMA < SlowEMA)) Then
 TrendTrades = 0
 StrongTrend = 0
 TSPB = 1 //TenkanSen pullback Required by Default
 If (FastEMA > SlowEMA and IFTRSI1 > IFTRSI1[1] and IFTRSI1 < LevelMid1 and IFTRSI2 <= LevelDown2) or (FastEMA < SlowEMA and IFTRSI1 < IFTRSI1[1] and IFTRSI1 > LevelMid1 and IFTRSI2 >= LevelUp2) Then
  StrongTrend = 1
 EndIf
EndIf

If onmarket[1] = 0 and onmarket = 1 Then
 LE = 0
 SE = 0
 TrendTrades = TrendTrades + 1
EndIf

EMARangeLim = 0
For i = 1 to 20 Do
 If Round(FastEMA[i]*PointFactor) = round(SlowEMA[i]*PointFactor) Then
  EMARangeLim = EMARangeLim + 1
 EndIf
Next

//Rules

If onmarket = 0 and FastEMA > SlowEMA and TrendTrades < LimitTrendTrades and EMARangeLim < 1 Then //Up Trend

 SEC = 0 //Special Exit Conditions Indicator

 If close < MA200 and close < max(SA[26],SB[26]) and close < TS and close < KS and IFTRSI1 > IFTRSI1[1] and BollUp > highest[50](close)[1] Then
  Buy possize contract at BollUp stop//market
  SEC = 2
 ElsIf StrongTrend = 1 and IFTRSI1 > IFTRSI1[1] and IFTRSI1 < LevelMid1 and IFTRSI2 <= LevelDown2 Then //Perfect Long Indicator Setup
  If close > MA200 and close > max(SA[26],SB[26]) and SA > SB and SA > SA[26] and close > KS and close < KS and FractalDim >= FractalLevel and abs(open-close) < abs(open[1]-close[1])*5 Then
   Buy possize contract at market
  ElsIf close < min(SA[26],SB[26]) and close > TS and close > KS Then
    Buy possize contract at market
    If close > MA200 Then
     SEC = 1
    Else
     SEC = 2
    EndIf
   EndIf
  ElsIf IFTRSI1 > IFTRSI1[1] and (IFTRSI1 > LevelMid1 or IFTRSI2 > LevelDown2 or FractalDim < FractalLevel) Then //Weak Long Signal
   If TSPB = 1 and close < TS Then
    TSPB = 0
   EndIf

   If TSPB = 0 and (IFTRSI1 < LevelMid1 or IFTRSI2 < LevelDown2 or FractalDim > FractalLevel) and IFTRSI2 < LevelUp2 and low - max((min(open,close)-low),(high-max(open,close))) > KS Then
    Buy possize contract at market
   EndIf
  EndIf

 ElsIf onmarket = 0 and FastEMA < SlowEMA and TrendTrades < LimitTrendTrades and EMARangeLim < 1 Then //Downtrend

  SEC = 0 //Special Exit Conditions Indicator

 If close > MA200 and close > min(SA[26],SB[26]) and close < TS and close < KS and IFTRSI1 < IFTRSI1[1] and BollDown < lowest[50](close)[1] Then
  Sellshort possize contract at BollDown Stop// market
  SEC = 2
 ElsIf StrongTrend = 1 and IFTRSI1 < IFTRSI1[1] and IFTRSI1 > LevelMid1 and IFTRSI2 >= LevelUp2 Then //Perfect Short Indicator Setup
  If close < MA200 and close < min(SA[26],SB[26]) and SA < SB and SA < SA[26] and close < KS and FractalDim <= FractalLevel and abs(open-close) < abs(open[1]-close[1])*5 Then
   Sellshort possize contract at market
  ElsIf close > max(SA[26],SB[26]) and close < TS and close < KS Then
   Sellshort possize contract at market
   If close < MA200 Then
    SEC = 1
   Else
    SEC = 2
   EndIf
  EndIf
 ElsIf IFTRSI1 < IFTRSI1[1] and (IFTRSI1 < LevelMid1 or IFTRSI2 < LevelUp2 or FractalDim > FractalLevel) Then //Weak Short Signal
  If TSPB = 1 and close > TS Then
   TSPB = 0
  EndIf

  If TSPB = 0 and (IFTRSI1 > LevelMid1 or IFTRSI2 > LevelUp2 or FractalDim < FractalLevel) and IFTRSI2 > LevelDown2 and high + max((high - max(open,close)),(min(open,close)-low)) < KS Then
   Sellshort possize contract at market
  EndIf
 EndIf
EndIf

//Conditional Exits

If longonmarket and SEC = 1 and close < TS and (close < min(SA[26],SB[26]) or (close > min(SA[26],SB[26]) and (IFTRSI1 < IFTRSI1[1] or IFTRSI2 > LevelMid2))) Then
 Sell at market
ElsIf longonmarket and SEC = 2 and (close < TS or high >= MA200) Then
 Sell at market
ElsIf shortonmarket and SEC = 1 and close > TS and (close > max(SA[26],SB[26]) or (close < max(SA[26],SB[26]) and (IFTRSI1 > IFTRSI1[1] or IFTRSI2 < LevelMid2))) Then
 Exitshort at market
ElsIf shortonmarket and SEC = 2 and (close > TS or high <= MA200) Then
 Exitshort at market
EndIf

If longonmarket and LE = 0 and IFTRSI2 > LevelUp2 and IFTRSI1 < IFTRSI1[1] and (close < TS or close <= max(highest[2](open)[1],highest[2](close)[1])) Then
 Sell at market
ElsIf longonmarket and LE = 0 and IFTRSI2 > LevelUp2 Then
 LE = 1
ElsIf longonmarket and LE = 1 and IFTRSI2 < LevelUp2 Then
 LE = 0
ElsIf longonmarket and LE = 1 and IFTRSI1 < IFTRSI1[1] and (close < TS or close <= max(highest[2](open)[1],highest[2](close)[1])) Then
 Sell at market
ElsIf longonmarket and LE = 1 and IFTRSI1 < IFTRSI1[1] Then
 LE = 2
//ElsIf longonmarket and LE = 2 and IFTRSI1 > IFTRSI1[1] and close > TS Then
//LE = 1
ElsIf longonmarket and LE = 2 and (close < TS or close <= max(highest[2](open)[1],highest[2](close)[1]) or FractalDim < FractalLevel) Then
 Sell at market
ElsIf shortonmarket and SE = 0 and IFTRSI2 < LevelDown2 and IFTRSI1 > IFTRSI1[1] and (close > TS or close >= min(lowest[2](open)[1],lowest[2](close)[1])) Then
 Exitshort at market
ElsIf shortonmarket and SE = 0 and IFTRSI2 < LevelDown2 Then
 SE = 1
ElsIf shortonmarket and SE = 1 and IFTRSI2 > LevelDown2 Then
 SE = 0
ElsIf shortonmarket and SE = 1 and IFTRSI1 > IFTRSI1[1] and (close > TS or close >= min(lowest[2](open)[1],lowest[2](close)[1]) or FractalDim > FractalLevel) Then
 Exitshort at market
ElsIf shortonmarket and SE = 1 and IFTRSI1 > IFTRSI1[1] Then
 SE = 2
//ElsIf shortonmarket and SE = 2 and IFTRSI1 < IFTRSI1[1] and close < TS Then
//SE = 1
ElsIf shortonmarket and SE = 2 and (close > TS or close >= min(lowest[2](open)[1],lowest[2](close)[1]) or FractalDim > FractalLevel) Then
 Exitshort at market
EndIf

//Immediate Exits
If longonmarket and ((close < KS and IFTRSI1 < IFTRSI1[1] and IFTRSI1 > LevelDown1) or (LE >= 1 and IFTRSI1 < IFTRSI1[1] and close < TS and IFTRSI1 > LevelDown1 and FractalDim < FractalLevel)) Then
 Sell at market
ElsIf shortonmarket and ((close > KS and IFTRSI1 > IFTRSI1[1] and IFTRSI1 < LevelUp1) or (SE >= 1 and IFTRSI1 > IFTRSI1[1] and close > TS and IFTRSI1 < LevelUp1 and FractalDim > FractalLevel)) Then
 Exitshort at market
EndIf

//Graph LE coloured(0,0,255) as "LE"
//Graph SE coloured(255,0,0) as "SE"
//Graph SEC as "SEC"
//Graph TSPB as "TSPB"