Wide Range Body and Hidden Gap bars (WRBHG)

v10.3
Wide Range Body and Hidden Gap bars (WRBHG)

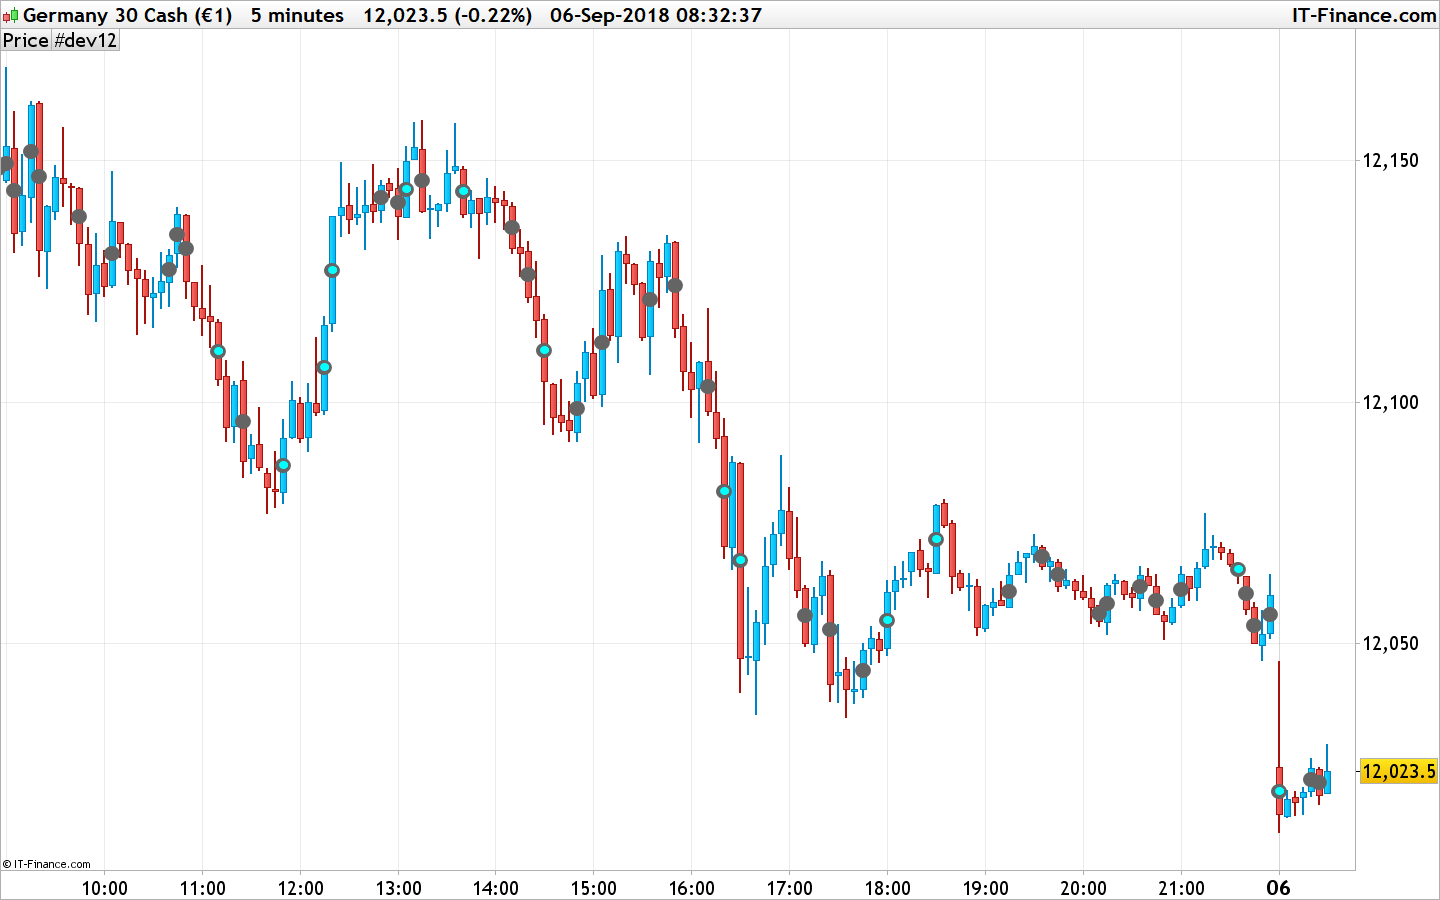
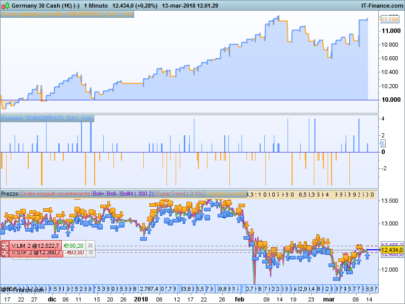
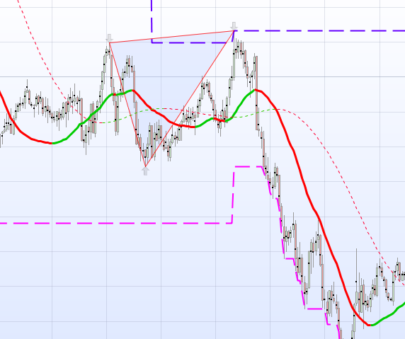
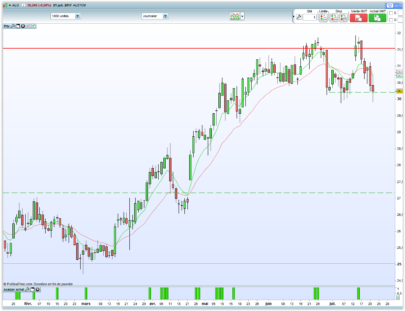
This simple indicator identifies Wide Range Body (WRB) and Hidden Gap (HG) bars.

WRB patterns are displayed as a black dots in the middle of the candlestick’s body.

HG patterns are plotted as light blue dots.

Sometimes patterns are detected at the same time and the dots are plotted in the same candlestick body.

Indicator converted from pinescript version by a request in the Spanish forum.


Share this

Risk disclosure:

No information on this site is investment advice or a solicitation to buy or sell any financial instrument. Past performance is not indicative of future results. Trading may expose you to risk of loss greater than your deposits and is only suitable for experienced investors who have sufficient financial means to bear such risk.

ProRealTime ITF files and other attachments : How to import ITF files into ProRealTime platform?

PRC is also on YouTube, subscribe to our channel for exclusive content and tutorials

  1. Stenozar • 09/06/2018 #

    Hi Nicolas, sorry for my ignorance, but what’s the use of this indicator?

    • Nicolas • 09/06/2018 #

      These 2 patterns are used in price action trading.

  2. luxrun • 09/06/2018 #

    Thanks Nicolas, I really like this graphical help on the price that identifies the WRB and Hidden Gaps. I found various educational materials on the web and one of the most interesting seemed to me this. Here is the link: http://www.thestrategylab.com/WRBAnalysis.htm

  3. ckat55 • 09/06/2018 #

    Thank you Nicolas, is there any way that an alert can be set for when the dot appears?

    • Nicolas • 09/06/2018 #

      yes, change the last line with:
      RETURN wrb,qh
      and set an alarm with the alert tool for each time one of these 2 values are changing.

  4. ckat55 • 09/06/2018 #

    Thank you Nicolas, I will try it.

avatar
Register or

Likes

avatar avatar avatar avatar avatar
Related users ' posts
Bard I was talking to a Machine Learning coder today who's algos have apparently managed to get 7...
FULVIO09 Attualmente non c'è sufficiente volatilità : la condizione "C0 = AverageTrueRange[1500](Clos...
vlongobardo67 Ma io intendevo in backtest ! Scusa non l’ho menzionato.
ciniselloftse salve fulvio .il trading sistem e sempre profittevole?
Bard Hi Violet, Thanks so much for making this screener. Bulkowski's work is thorough. I though...
Gregg Hi all, is there anyone who is using this pattern? It's been 3 days I'm trying it and I'm ...
Violet Hi Gregg, TP and SL? There are no variables by those names. The signal appears/disapp...
Marcus Quartus Aurius Thanks great job !
GraHal Please forgive the daft question, but why is 3-bars-trailing-stop-williams-3.itf included a...
Kris75 Hi, Seems great but what would be the code for a stock ? Thanks, Chirs
oakenstream Paul, what is the best way in your opinion to know if I have over optimized?
Dadoo Incredible workLeo. Thankyou to share you time and knowledge
tommygtb what does the criteria mean in the box on the screen is it the time frame the screener sear...
Saberi2023 Hello dear Can you please write it also in java script?
JohnScher indicators i did fond, no problem, but a basic code to trade maybe RSI divergence didn´t fou...
Daniel3987 Please how do I add the prc candle strength to my mt5 on an iPhone
Nicolas You can't, this indicator is made to be used with prorealtime trading platform.
parthapersonal Great job Leo. Dear Zen83, how do you, "return them into the very last line"?
steve_ Hi! This thread is quite old, but let’s try… I’m new with Prorealcode and I’ve just di...
steve_ Hi! I've created a topic in french (translatable with Google function) here : https://www.p...
777dks hi this doesnot seem to work on forex, any ideas? thanks.
4example excellent, thank you
avatar
Anonymous Sorry I mean vertical red / green line
avatar
Anonymous Found: just remove "T coloured(r,g,b) as "Top", Bo coloured(r,g,b) as "Bottom"... after return
darbes Hi I tried to use indicator in a strategy code. But backtesting is asking to define Signalb...
avatar
Anonymous Thanks for sharing! On the other hand can we remove the vertical gray lines?
ShaunG Appreciated! Thanks 100%
tonbijl good afternoon when i enter the code i get an error message Syntax error
bertrandpinoy BONJOUR PAUL impossible de tenter le trading automatique, PRT me dis que l instruction "GRAP...
Paul Bonjour, supprimez les lignes avec un "graph"
bertrandpinoy merci. vous l utiliser actuellment sur quel instrument vous? et quel timeframe? Merci
rispardin no entiendo como funciana este indicador, por favor alguien podria explicar como utilizarlo???
AVT No se trata de un solo indicador, pero cada linea muestra otra información, de abajo hacia ...
IV Mcm Your indicator is interesting, I evaluated its relevance with the squeeze to detect the phas...
dzim0032 J'avais oublié de mettre un commentaire pour la vente du scalper dont les règles sont justes...
andreag76 Thank you Francesco78 !
juanj What happened after August 21?
jpgcreatestrading Hi Manel, i have found this same issue, some strategies (but not all) that are written with ...
avatar
bjoern With the same parameters? For me the results are negative
avatar
bjoern Oh ok, with the initial posted parameters it is positive
victormork yes! It's not like you want to put it on live but when I for example take the version I have...
Doctrading Hello, Higher timeframes are better. I suggest D1 or H4.Best regards,
Pinkybouh hello, I propose to add another conditions: ie: haussier: close > open and close >...
TheHovisTrader I'd be interested in the actual profit of this - in the example the stop range is at least 2...

Top