







double top and double bottom detector - M&W patterns
Hi all,
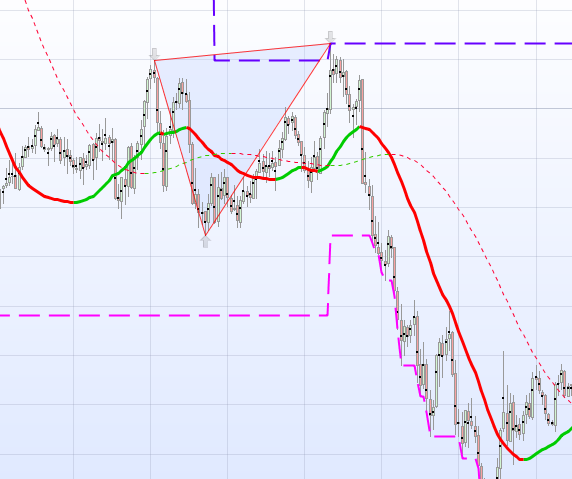
I create an algorithm that detects local minimums and local maximums in the proximity were two crossing moving average are located.
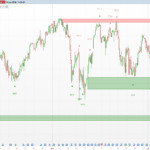
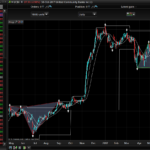
Base on this information, then simple mathematics is use for detect and draw a triangle where a double top is located.
Please check it, improve the algorithm and share your luck!
//LOCALS MINIMUMS AND MAXIMUMS USING LEO MOVING AVERAGE
//Autor: LEO

//VARIABLES TO BE OPTIMIZED

//PERIOD=20    //Period for analysis
//Kdouble=0.2 //Factor for defining what is double top or bottom

//-----------

//Leo Moving Average, formula: LMA= WMA+(WMA-SMA)
LMA=2*weightedaverage[period](close)-average[period](close)

//Smoothed curve of Leo Moving Average
IF BARINDEX > period THEN
 smoothLMA=weightedaverage[period](LMA)
ELSE
 smoothLMA=undefined
ENDIF

// << Storage of minimums and maximums >>
once mintemp=low
once posmintemp=1
once maxtemp=high
once posmaxtemp=1

IF BARINDEX>2 THEN
 // the value 0.75 is to ensure that the donchian channel is faster than the curves analysis (this value to be checked)
 IF low < lowest[round(0.75*period)](low[1]) THEN
  mintemp=low //minimum temporal
  posmintemp=BARINDEX //postition of minimum temporal
 ENDIF
 IF high > highest[round(0.75*period)](high[1]) then
  maxtemp=high //maximum temporal
  posmaxtemp=BARINDEX //position maximum temporal
 ENDIF
ENDIF

//  << Detecting and locating a local minimums >>
//  Where the LMA is crossing the smoothed LMA, there is a maximum or minimum nearby
//  If there is a new local min/max, the preivus one is stored in de varible B... (before)
once LEVMIN=low
once POSLEVMIN=1
once LEVMAX=high
once POSLEVMAX=1
once bullcross=0
once bearcross=0

IF BARINDEX > PERIOD THEN //For avoid computer errors
 bullcross=LMA crosses over smoothLMA
 bearcross=LMA crosses under smoothLMA
ENDIF


IF bullcross THEN
 BLEVMIN=LEVMIN        //previus local minimum is saved
 BPOSLEVMIN=POSLEVMIN
 LEVMIN=mintemp
 POSLEVMIN=posmintemp
 support=LEVMIN
 DRAWARROWUP(POSLEVMIN,LEVMIN) coloured(0,0,0,30)
ENDIF

// --> Detecting and locating a local maximum
IF bearcross THEN
 BLEVMAX=LEVMAX       //previus local maximum is saved
 BPOSLEVMAX=POSLEVMAX
 LEVMAX=maxtemp
 POSLEVMAX=posmaxtemp
 resistance=LEVMAX
 DRAWARROWDOWN(POSLEVMAX,LEVMAX) coloured(0,0,0,30)
ENDIF

support=min(low,support)
resistance=max(high,resistance)


// << DETECTING DOUBLE TOP OR BOTTOMS  >>

once WidthDoubleTop = high-low
once WidthDoubleBottom = high-low

//--> Double bottoms

//looking for the top between two local minimums
IF bullcross THEN
 doublebottomtop=high[BARINDEX-POSLEVMIN+1] // we start looking for the top in between two local minimums
 POSdoublebottomtop=BARINDEX-POSLEVMIN+1
 FOR i = (BARINDEX-POSLEVMIN+1) to (BARINDEX-BPOSLEVMIN-1) DO
  IF high[i] > doublebottomtop THEN
   doublebottomtop=high[i]
   POSdoublebottomtop=BARINDEX-i
  ENDIF
 NEXT
 WidthDoubleBottom = doublebottomtop-(BLEVMIN+LEVMIN)/2 // (top betwen local minimums) - (average of the las two local minimums)
 IF abs(BLEVMIN-LEVMIN) < Kdouble*WidthDoubleBottom THEN
 //       <<<<<<<  HERE WE HAVE A DOUBLE BOTTOM FOR TRADING  >>>>>
  DRAWTRIANGLE(POSLEVMIN,LEVMIN,POSdoublebottomtop,doublebottomtop,BPOSLEVMIN,BLEVMIN) COLOURED(0,255,0,200)
 ENDIF
ENDIF

//--> Double tops

//looking for the bottom between two local maximums
IF bearcross THEN
 doubletopbottom=low[BARINDEX-POSLEVMAX+1]
 POSdoubletopbottom=BARINDEX-POSLEVMAX+1
 FOR i = (BARINDEX-POSLEVMAX+1) to (BARINDEX-BPOSLEVMAX-1) DO
  IF low[i] < doubletopbottom THEN
   doubletopbottom=low[i]
   POSdoubletopbottom=BARINDEX-i
  ENDIF
 NEXT
 WidthDoubleTop=(BLEVMAX+LEVMAX)/2 -doubletopbottom
 IF abs(BLEVMAX-LEVMAX) < Kdouble*WidthDoubleTop THEN
 //       <<<<<<<  HERE WE HAVE A DOUBLE TOP FOR TRADING  >>>>>
 DRAWTRIANGLE(POSdoubletopbottom,doubletopbottom,POSLEVMAX,LEVMAX,BPOSLEVMAX,BLEVMAX) COLOURED(255,0,0,200)
 ENDIF
ENDIF

RETURN LMA AS "Leo Moving Average", support as "support", resistance as "resistance", smoothLMA as "smooth LMA" //, lowest[round(0.75*period)](low[1]), highest[round(0.75*period)](high[1])
Comments
You must be logged in to post a comment.

Hi! This thread is quite old, but let’s try… I’m new with Prorealcode and I’ve just disvovered “Double top and double bottom” indicator. It seems to be a very nice piece of code, nice work Leo ! But I have a question about the associated screener. Would it be possible to sreen only recent bottoms ? For exemple, bottoms that appeared in the last x days ? (x as a parameter) Thanks !

Great job Leo. Dear Zen83, how do you, "return them into the very last line"?

Hi Leo, how to set up an audible alert to be notified of a doubletop or doublebottom detection ? Thanks for your answer

Many thanks Leo for your masterpiece indicator, I took the liberty of plugging into it Fibonnacci levels at the very end insert difrs=(resistance-support) F236=resistance -difrs*0.236 F382=resistance -difrs*0.382 F50=resistance-difrs*0.5 F618=resistance-difrs*0.618 F764=resistance-difrs*0.764 and return them into the very last line ... very amazing results



bonjour je ne parvient pas a l installer sur PRT. erreur de syntaxe... et vous il fonctionne?


Hi Leo, Amazing indicators! Can you please advise if there is a way to utilize your indicator in a automated trading strategy. Can you suggest a code for an automated sell order or buy order when the arrows appear on your indicator. Cheers Nick.



How do you get the indicator on the chart and not in a frame below? Sorry new to this software

Hi Leo. You code is very interesting (Indi+Screener). To use it in my trading i think i will maybe modify it to match the way i trade. I have a very simple question : arrows to spot the local maximums and local minimums are real time ? I mean they appear in real time where they are spotted or they appear few candles after ? Thanks

Bonjour, Merci à Léo! Le code est trop ardu pour mes connaissance, pourrait-on avoir un screener à partit du code de cet indicateur ? Un screener qui indique le passage de LMA de positif en négatif confirmé sur 3 barres (soit signal en zéro confirmation en 1 et 2, Achat ou vente en 3). Merci aux bonnes volontés. Cordialement

Please Leo, let us know when screener be approved!! ;) many thanks!!



great job! I will try to test it to see if I can find a nice robust strategy around it.
Hi! I've created a topic in french (translatable with Google function) here : https://www.prorealcode.com/topic/transformer-un-iindicateur-complexe-en-screener/ I've developped a prototype of screener using Leo's indicator. Please check it and give your opinion. Thanks! Steve.