




More from ProRealCode
ProRealCode - Trading & Coding with ProRealTime™
The ProRealTime™ community on the web! Officially sharing ProRealTime knowledge to Worldwide users since 2015!



3 Weeks Consolidation Screener on Daily Chart
May 3, 2018, 8:29 AM
Screeners
4 Comments
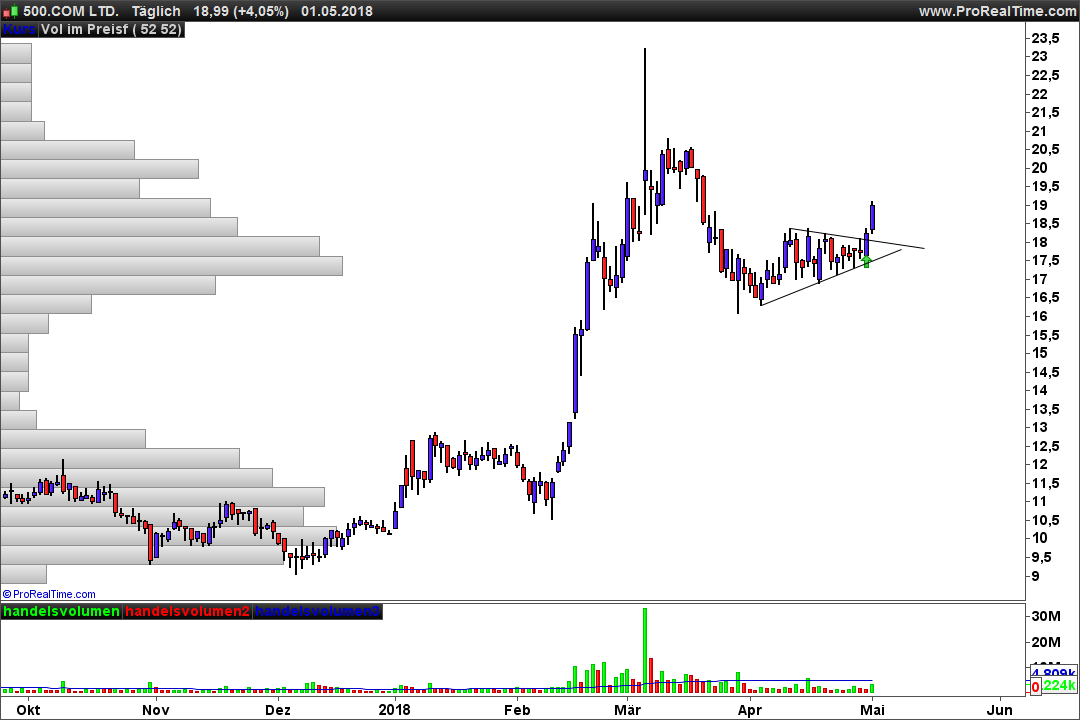
The Chart looks for a 3 Week Consolidation.
The high 3 weeks ago is > two weeks ago and so on. Vice versa with the lows.
So when you look on daily chart a nice Triangle Pattern should be found.
Not every candidate looks good but with a little routine and your eye, you can find some nice triangles in every market in some minutes and place you alert for order.
TIMEFRAME(weekly)
c3 = Average[40](close*volume) > 3000000
c1 = high[2] >= high[1] and high[1] >= high
c2 = low[2] <= low[1] and low[1] <= low


SCREENER[c1 and c2 and c3 ](volume*close as "traded volume")
Download
Filename:
3-weeks-consolidation-pattern.itf
Downloads:
605
Veteran
secundary school-education to banker staff-multiple host part time - economist partime like: reading-thinking biases and chess.
Author’s Profile
Similar code
Bullish/Bearish Harami ScreenerScreeners

Recent Wolf WavesScreeners
Actual WOLFE WAVE in buy zoneScreeners
Chartist Figures detectorScreeners



Loading...
c3 = Average[40](close*volume) > 3000000 Hi to everyone. I need some help with this code. Does this mean traded volume of 3000000 stocks (number of stocks traded >3000000) or does this mean 3000000 volume of stock currency? Best Thanks and greets.