1. Introduction
The Volume Accelerated Directional Energy Ratio is an advanced technical indicator (developed by RedKtrader) that merges price direction with volume-derived energy. Its purpose is to clearly and visually represent the intensity of directional price movement, weighted by volume behavior, helping traders identify imbalances and potential entry or exit points.
2. Indicator Fundamentals
This indicator is based on the concept of normalized directional energy: a measure that considers both the relative price change and the strength behind it, as dictated by volume.
Unlike traditional indicators such as RSI or MACD, which focus solely on price, this one adds a critical layer of information through volume, enabling traders to distinguish between strong and weak moves.
Additionally, it includes a sentiment histogram that reflects whether buying or selling pressure is accelerating or fading.
3. Calculations and Components
Key components of the indicator include:
- Adjusted Volume (vola): Calculated in three modes based on the
vcalcparameter:- 0 = no volume usage
- 1 = relative volume (normalized within its recent range)
- 2 = raw volume
- Normalized Direction (rsr): Derived from the ratio of price change (
close - close[1]) to the average range. - Directional Energy (c): Product of normalized direction and adjusted volume.
- Positive and Negative Components (cplus, cminus): Separation of energy into bullish and bearish pressure.
- Demand and Supply Lines (adp, asp): Smoothed energy components.
- Net Energy (anps): Smoothed difference between demand and supply, this is the main line of the indicator.
- Sentiment (vsenti): A histogram representing acceleration or deceleration of energy imbalance.
4. Indicator Settings
This indicator includes several configurable parameters for fine-tuning:
length: Lookback period for volume and averages (default: 10)deravg: Smoothing factor for net energy differential (default: 5)matype: Type of moving average (0: simple, 1: exponential, etc.)smooth: Final smoothing applied to the main line (default: 3)senti: Period for sentiment calculation (default: 20)vcalc: Volume calculation method (0: none, 1: relative, 2: full volume)showsenti: Display sentiment histogram (1: show, 0: hide)
These options allow the indicator to be used across different trading styles and timeframes.
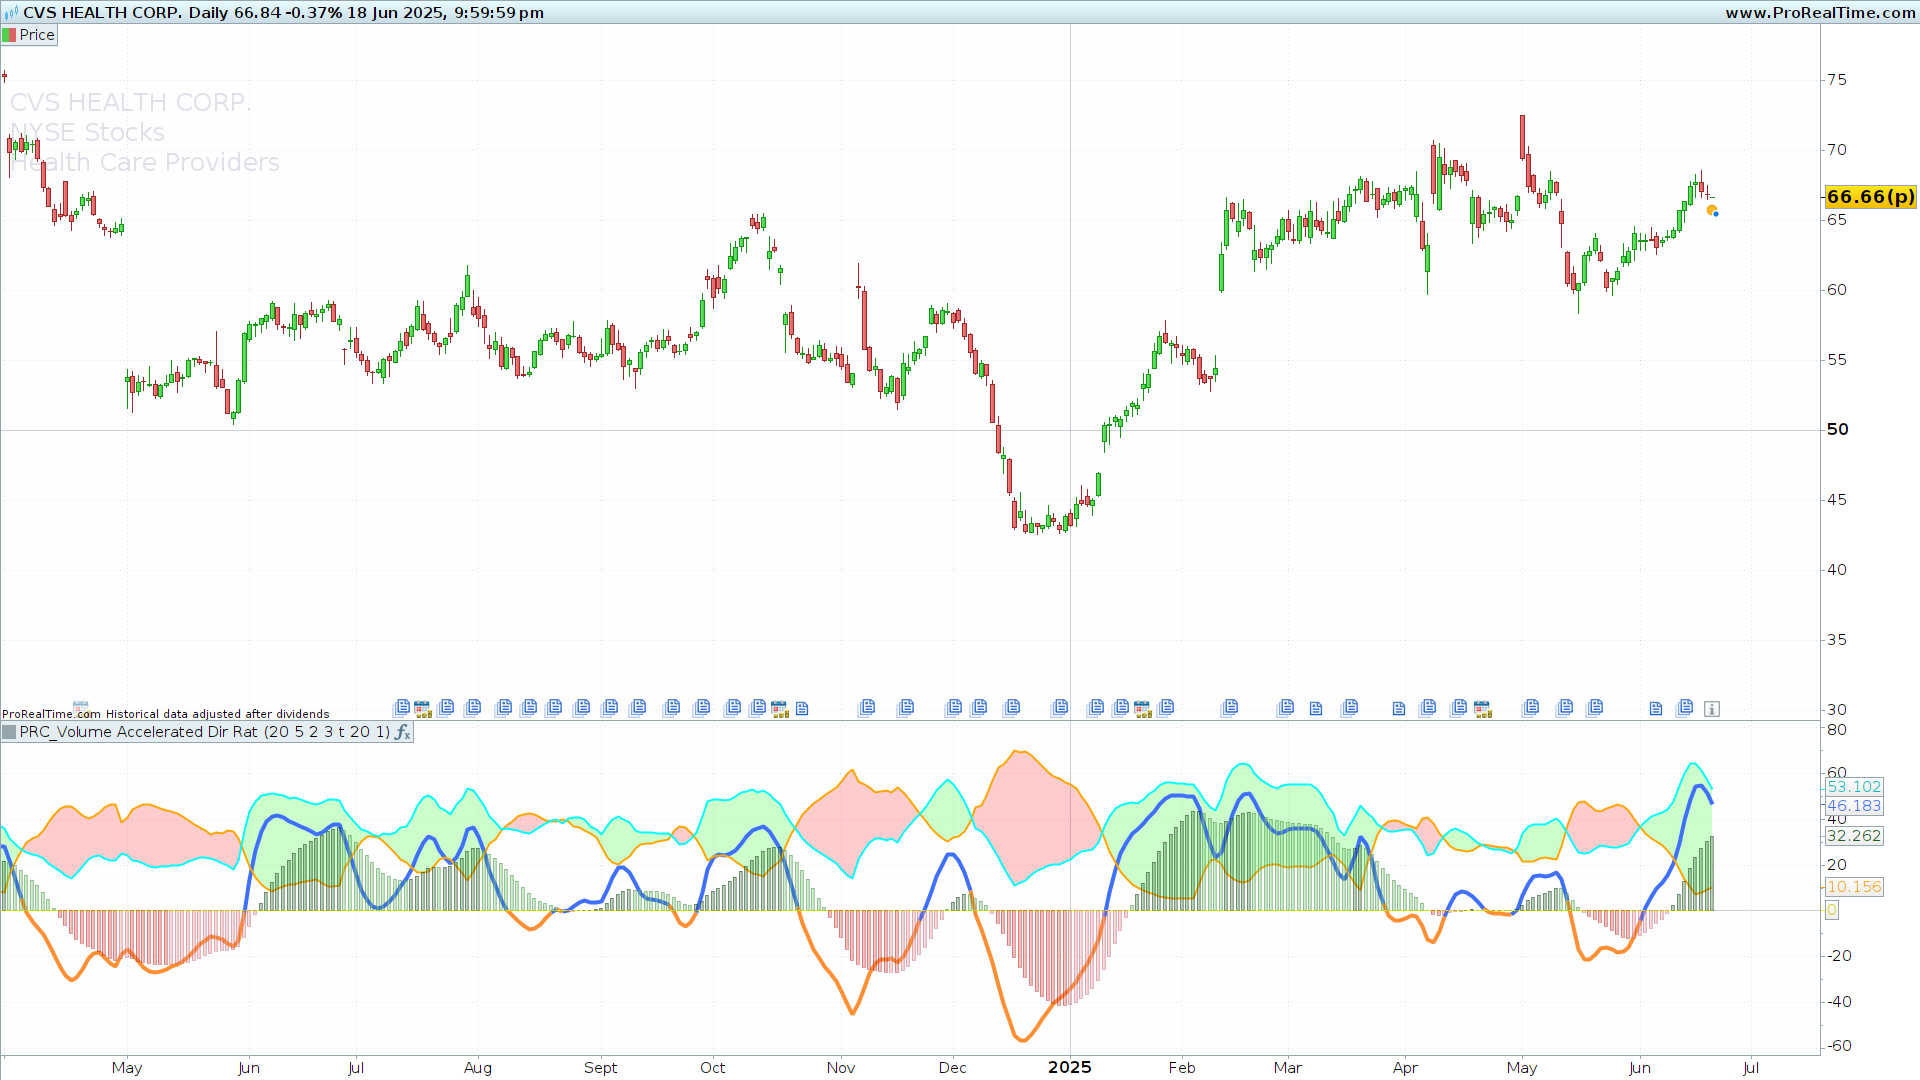
5. How to Read It
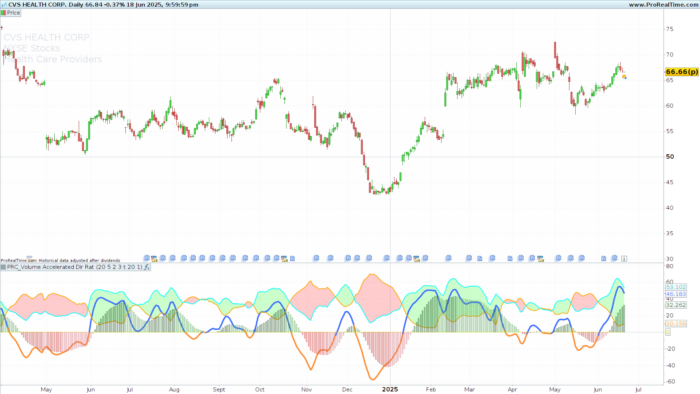
The indicator displays several visual components:
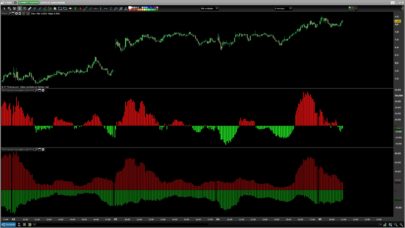
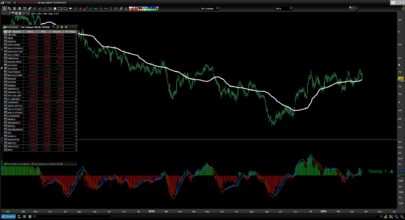
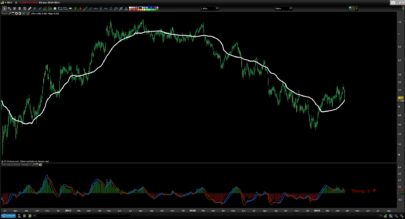
- Main Line (anps): Reflects net directional energy. Positive values imply dominance of demand, while negative ones indicate supply.
- Demand and Supply Lines (adp, asp): Displayed in aqua and orange for easy visual distinction.
- Colored Area between adp and asp: Highlights prevailing directional bias.
- Sentiment Histogram (vsenti): Provides an extra layer of insight into whether directional force is increasing or weakening. The color changes dynamically with momentum and direction.
Together, these signals can help identify exhaustion, trend acceleration, or early warnings of potential reversals.
6. Indicator Code
|
1 2 3 4 5 6 7 8 9 10 11 12 13 14 15 16 17 18 19 20 21 22 23 24 25 26 27 28 29 30 31 32 33 34 35 36 37 38 39 40 41 42 43 44 45 46 47 48 49 50 51 52 53 54 55 56 57 58 59 60 61 62 63 64 65 66 67 68 69 70 71 72 73 74 75 76 77 78 79 80 81 82 83 84 85 86 87 88 89 90 91 92 93 94 95 96 97 98 99 100 101 102 103 104 105 |
//--------------------------------------------// //PRC_Volume Accelerated Directional Energy Ratio //version = 0 //15.04.25 //Iván González @ www.prorealcode.com //Sharing ProRealTime knowledge //--------------------------------------------// // Inputs //--------------------------------------------// src=close length=10 deravg=5 matype=2 smooth=3 showsenti=1 senti=20 vcalc=1 //1=Relative, 2=full, 0=none //--------------------------------------------// // Calculations //--------------------------------------------// v=volume if vcalc=0 then vola=1 elsif vcalc=1 then vola=(v-lowest[length](v))/(highest[length](v)-lowest[length](v)) else vola=v endif r=(highest[2](high)-lowest[2](low))/2 sr=(src-src[1])/r rsr=max(min(sr,1),-1) c=rsr*vola cplus=max(c,0) cminus=-min(c,0) avgvola=average[length,matype](vola) dem=average[length,matype](cplus)/avgvola sup=average[length,matype](cminus)/avgvola adp=100*average[deravg,2](dem) asp=100*average[deravg,2](sup) anp=adp-asp anps=average[smooth,2](anp) sadp=100*average[senti,2](dem) sasp=100*average[senti,2](sup) vsenti=average[smooth,2](sadp-sasp) //--------------------------------------------// // Colors and plot //--------------------------------------------// if vsenti>=0 then if abs(vsenti)>=abs(vsenti[1]) then red=27 green=94 blue=32 alpha=100 else red=107 green=187 blue=106 alpha=100 endif else if abs(vsenti)>=abs(vsenti[1]) then red=220 green=76 blue=74 alpha=100 else red=239 green=142 blue=152 alpha=100 endif endif if showsenti then plotsenti=vsenti else plotsenti=undefined endif if asp>adp then r1=255 g1=0 b1=0 else r1=0 g1=255 b1=0 endif colorbetween(asp,adp,r1,g1,b1,50) if anps>0 then r3=64 g3=112 b3=255 else r3=255 g3=143 b3=53 endif //--------------------------------------------// return anps coloured(r3,g3,b3)style(line,4),asp coloured("orange")style(line,2),adp coloured("aqua")style(line,2),0 as "Zero" coloured("yellow"), plotsenti as "Sentiment" style(histogram)coloured(red,green,blue,alpha) |
Share this
No information on this site is investment advice or a solicitation to buy or sell any financial instrument. Past performance is not indicative of future results. Trading may expose you to risk of loss greater than your deposits and is only suitable for experienced investors who have sufficient financial means to bear such risk.
ProRealTime ITF files and other attachments :
Find other exclusive trading pro-tools on ![]()
PRC is also on YouTube, subscribe to our channel for exclusive content and tutorials