







myCandle-Infos-V1.2
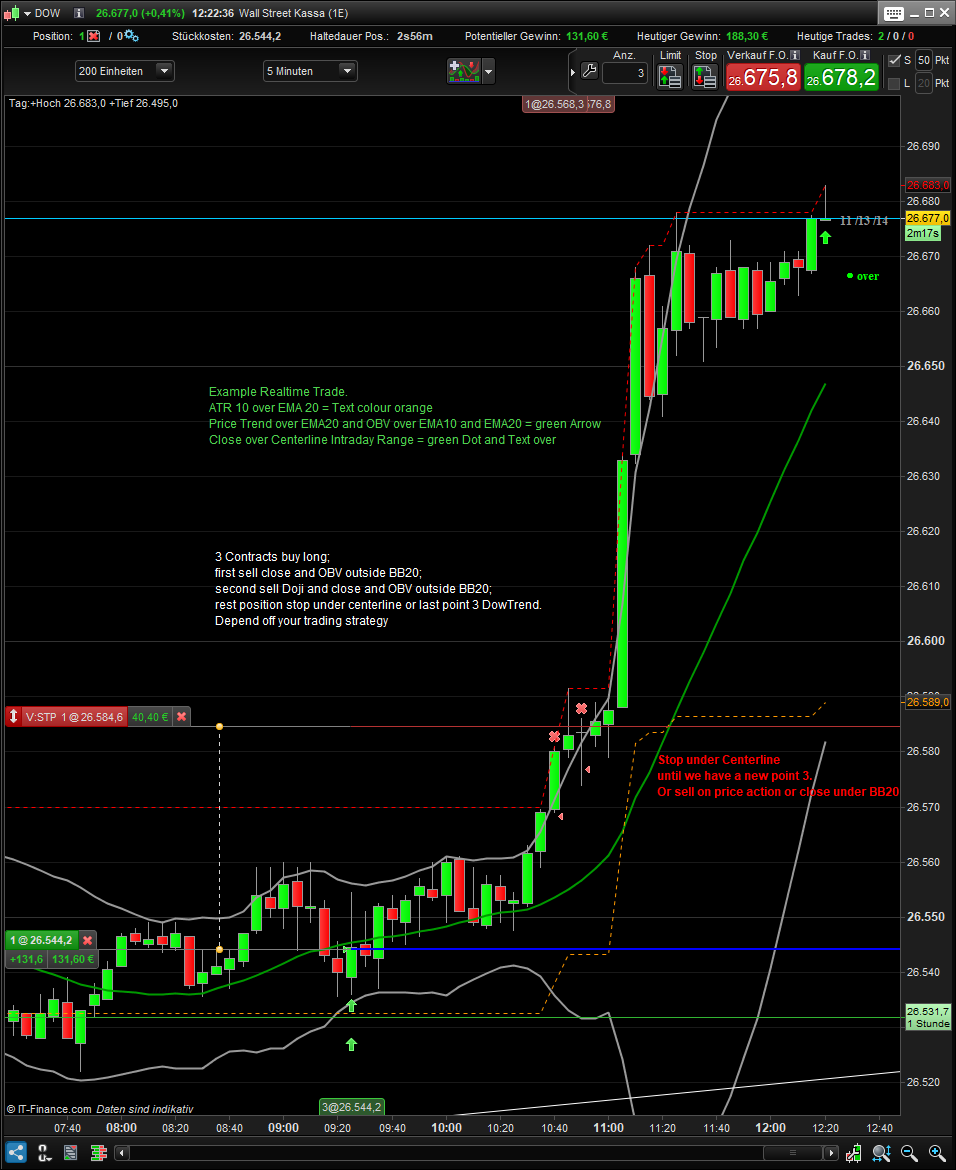
This is an updated version of myCandle-Infos
All Details now in the blue Info-Bubble.
I use this indicator as visual information about other indicators for intraday trading.
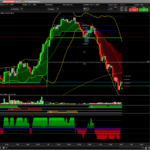
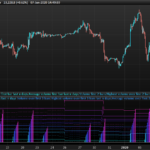
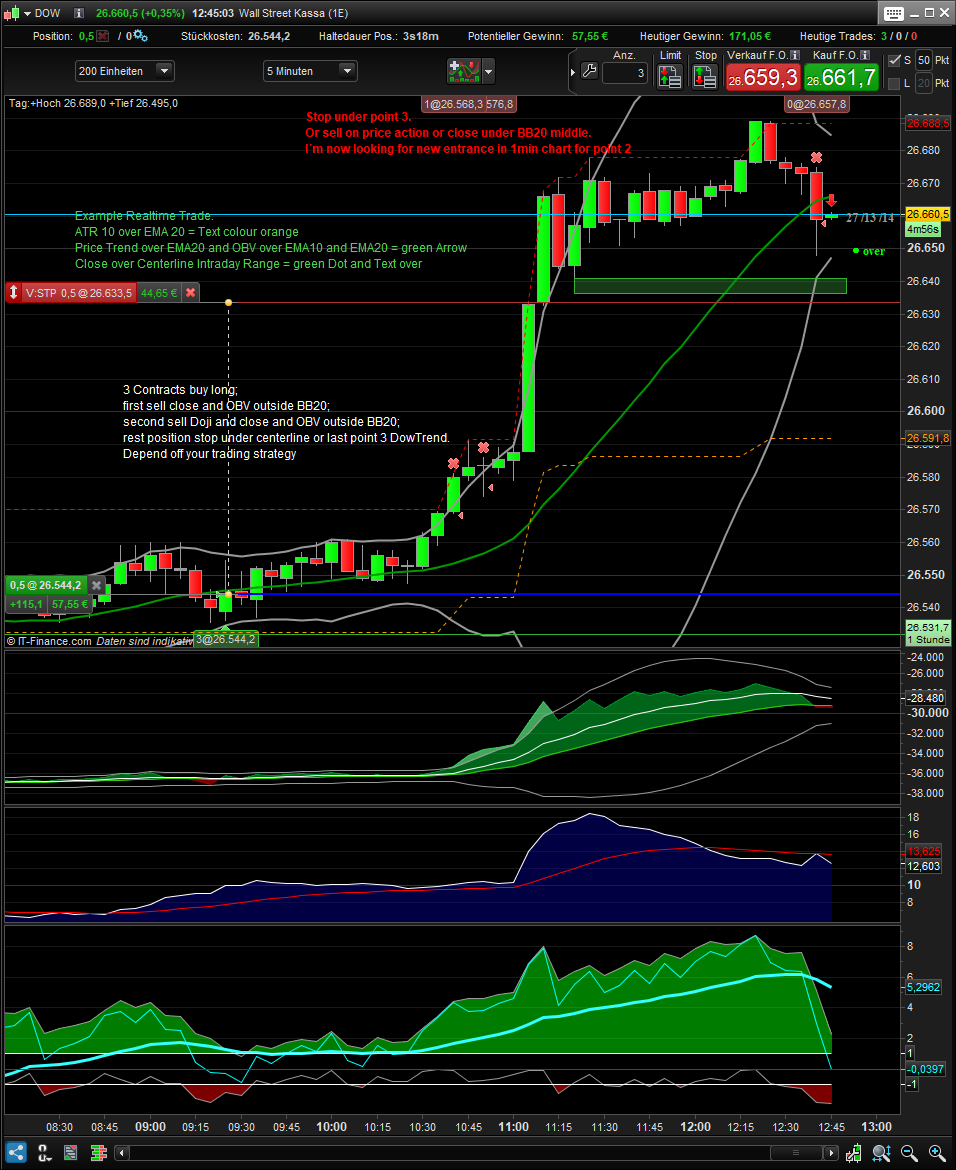
You can see the other indicators in the image “candle_with_indis”.
It gives me mor space for the chart!!!
For me the best configuration is:
I set all checkboxes of “myCandle-Infos-V1.2” on true.
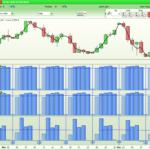
And under the chart i displayed the indicator for 1h, 4h, 1D from Nicolas Heikin Ashi of higher timeframes (hourly TF)
Look on the image “candle_with_HA-highTF”.
And the BB (Bollinger Bands with 20,2 Standard), NOT EMA.
As a supplement I show the VWAP.
Also very good information gives the OBV with BB20[ExponentialAverage] (see “candle_with_indis”), but it is includet in “myCandle-Infos-V1.2“
And last but not Opening Range Good combination for starting in the day oder US start. Displayed also the Close on fixed time. Update comes soon.
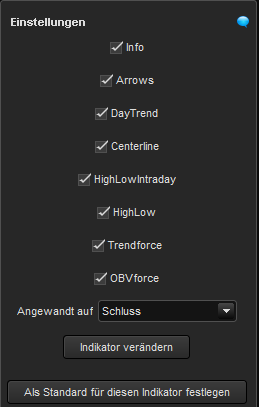
This are the Checkboxes and function of “myCandle-Infos-V1.2”:
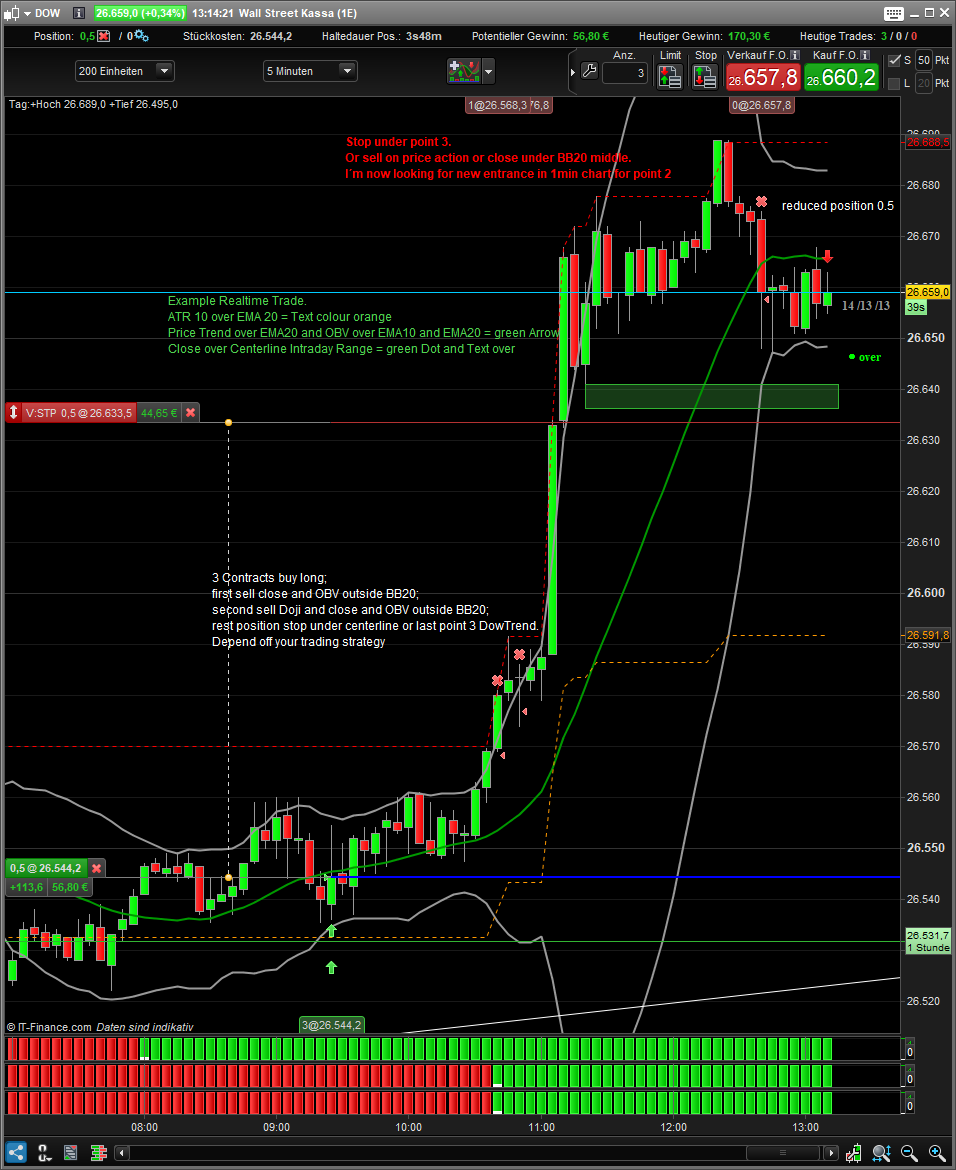
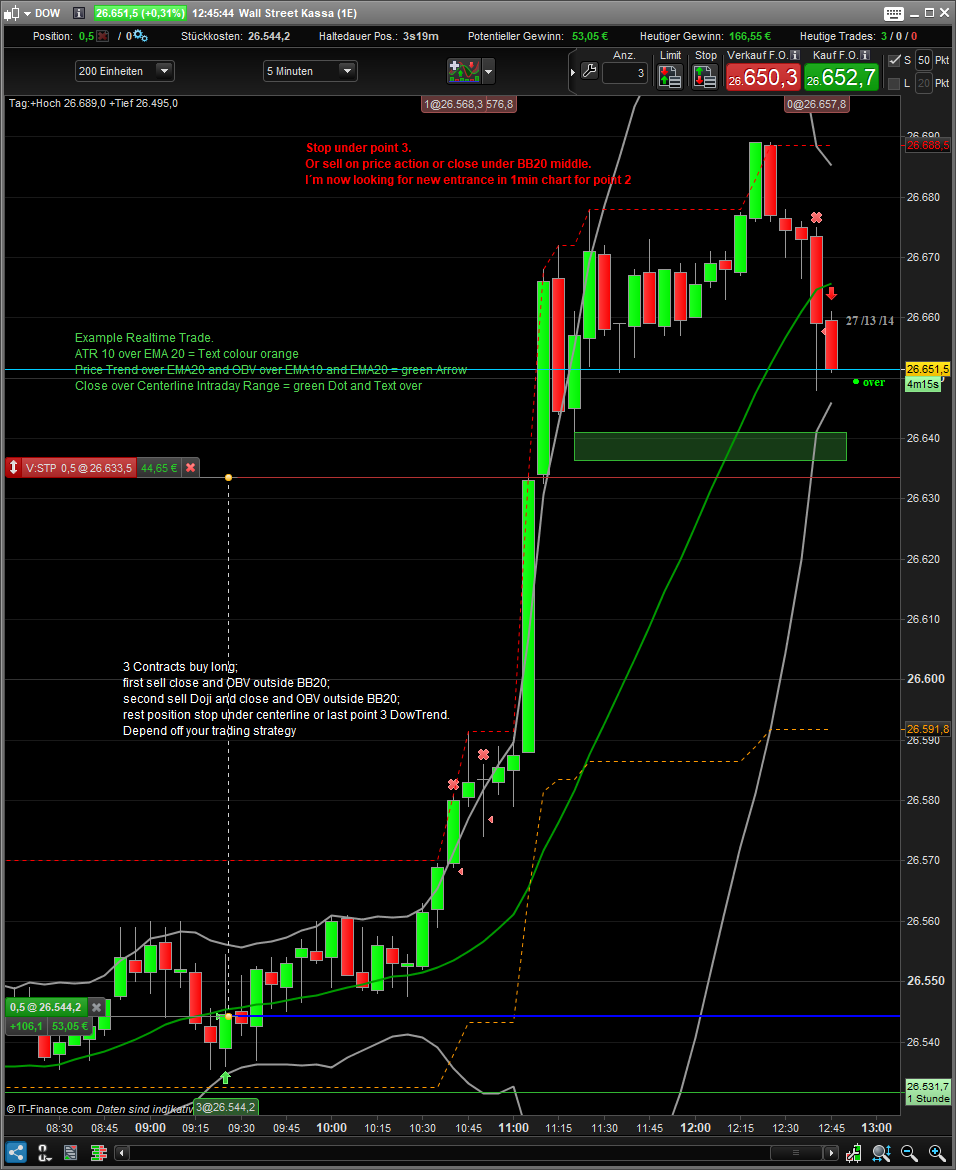
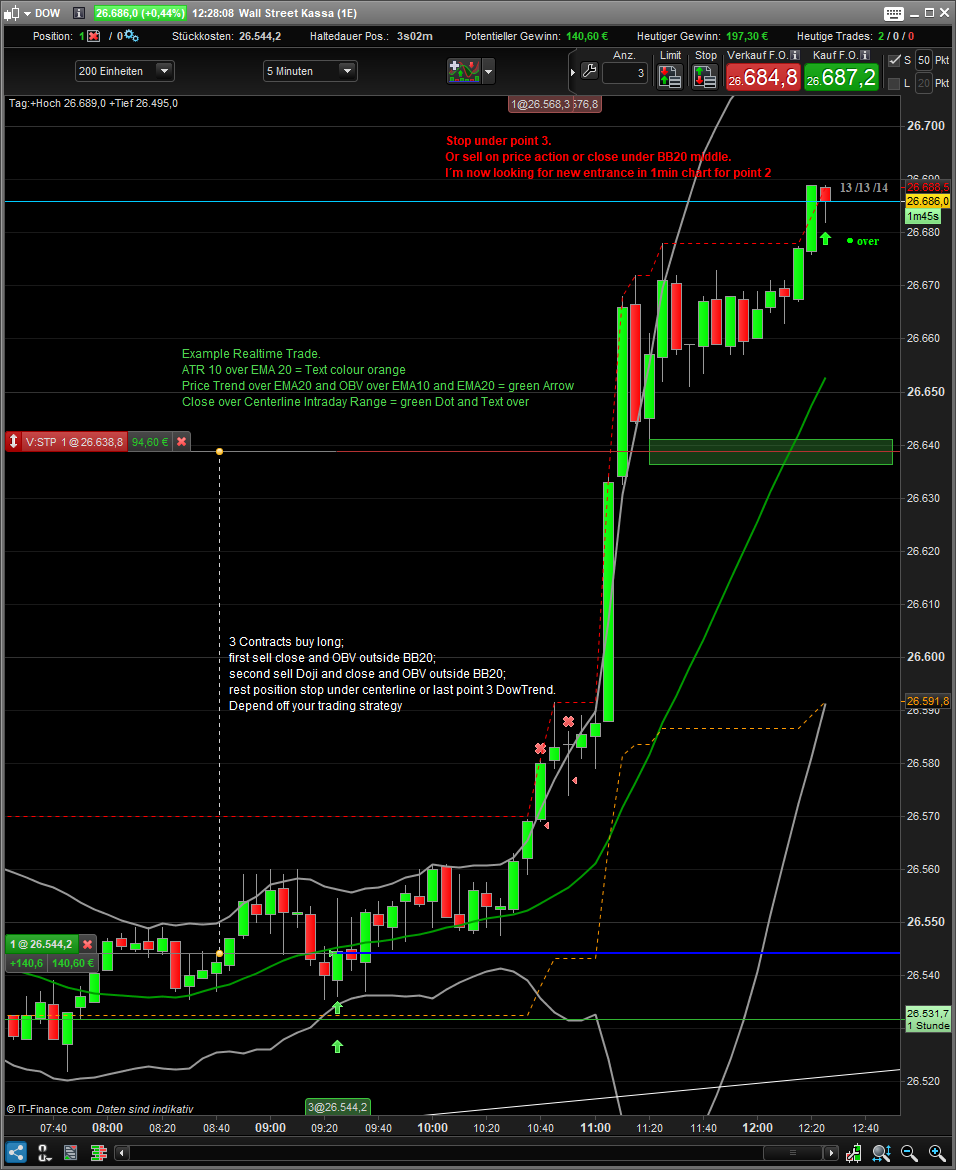
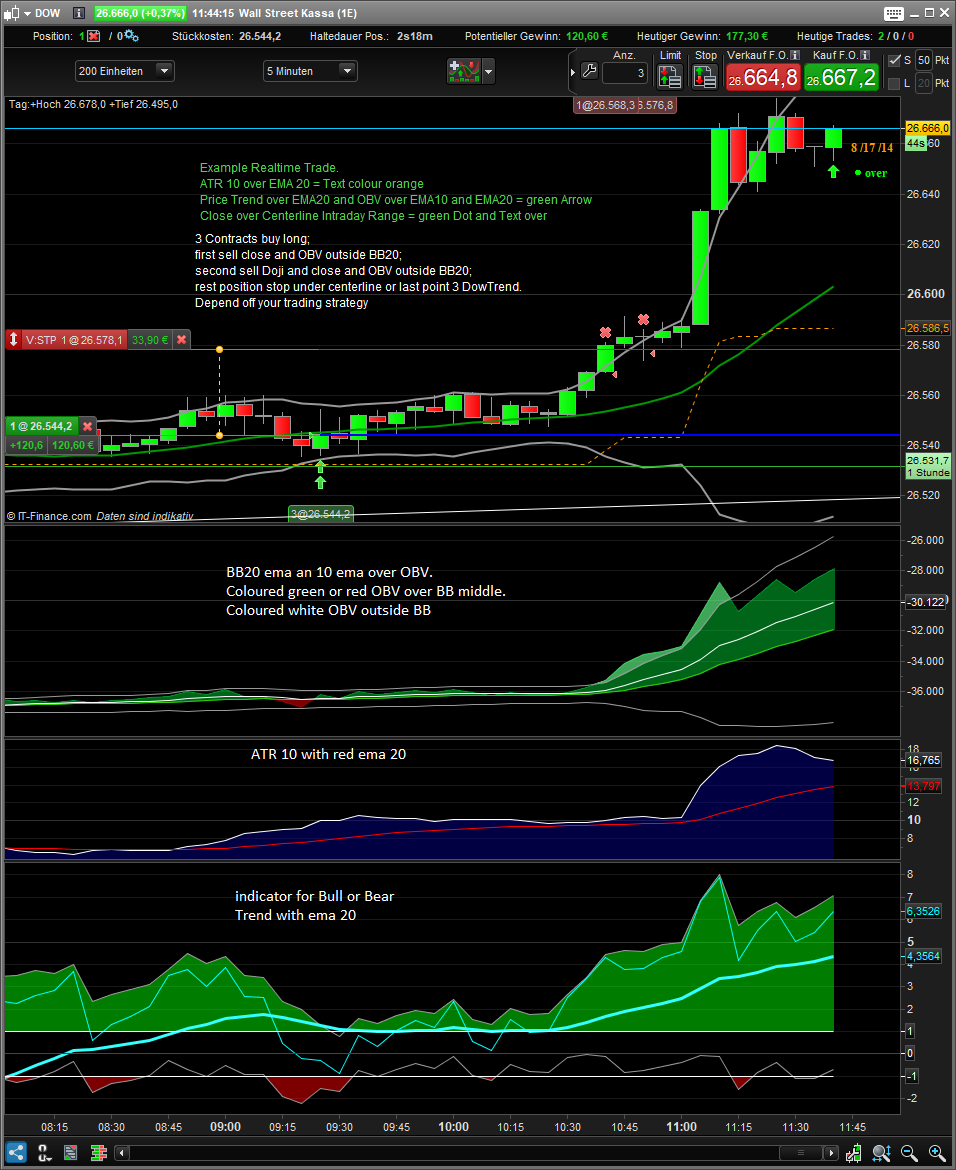
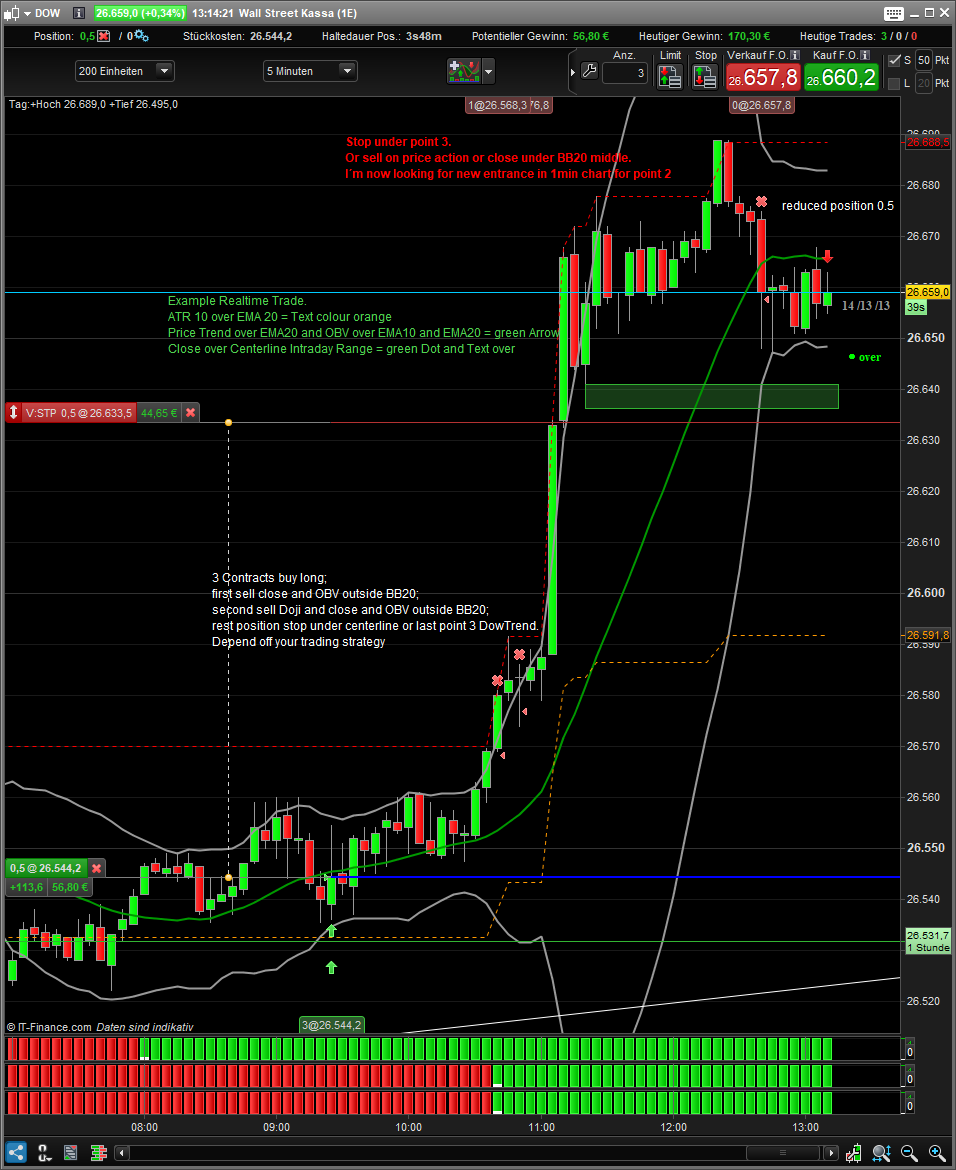
Info: Shows the range of previous candle, ATR 10 and EMA 20 of ATR10.
If ATR is greater than its average, the text will be displayed in orange =Better moves
Arrows: Shows Arrows in green and red color. When the Price Trend (calculation in code) over EMA20 and OBV (On Balance Volume) over EMA10 and EMA20 displayed green Arrow and revers. Depends on “Trendforce” and / or “OBVforce” activation checkbox.
Daytrend: Close over Centerline Intraday Range displayed green Dot and Text “over” and revers red Dot with Text “under”. The idea is when the price is over the middle intraday range then we have at the moment intraday a Bulltrend and revers.
Centerline: Show the middle of the range between Intraday high and low as a dotted line.
High/LowIntraday: Show the intraday highest high and lowest low as line. High as red dotted line like a resist and low as green dotted line like a support.
HighLow: Show the daily highest high and lowest low beginning on yesterday.
Trendforce: Trend strength is used to calculate the arrows. For this, “Arrows” must be also activated. Or also with “OBVforce”.
OBVforce: Volumen strength, based on OBV, is used to calculate the arrows. For this, “Arrows” must be also activated. Or also with “Trendforce”.
Example. You can deactivate for instrument whitout OBV/Volume Data. Forex, etc.
I hope you enjoy and have good successful trades.
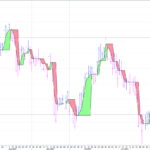
The images “candle-info6-7-8” shows a example of real money trading with this combination.
// myCandel-Infos-V1.2
// 18.06.2019 (Release 1.2)
// Thomas Geisler
// Sharing ProRealTime knowledge
// https://www.prorealcode.com/library/

defparam drawonlastbaronly=true // Zeichung nur am letzten Bar
//--init--
alpha = 255
lookback = 1
//Info = 1
// Arrows = 1
// DayTrend = 1
// Centerline = 1
// HighLowIntraday = 1
// HighLow = 1
//Trendforce = 0
// OBVforce = 0
//-- end--

//--Info--
// previous Candle Range[1] and ATR[10] and EMA-ATR[20]of ATR[1]
myRange = round(Range[1])
myATR = round(AverageTrueRange[10](close[0]))
myEATR = round(ExponentialAverage[20](AverageTrueRange[10](close[0])))
If Info = 1 then
if myATR < ExponentialAverage[20](myATR) then
DrawText("                           #myRange#/#myATR#/#myEATR#",barindex,open,Serif,Bold,12) coloured(153,153,153,alpha)
else
DrawText("                           #myRange#/#myATR#/#myEATR#",barindex,open,Serif,Bold,12) coloured(255,153,0,alpha)
endif
endif
//--end--

//--Dailys highest high and lowest Low--
if HighLow then
if openday <> openday[1] then
dayindex = dayindex + 1
dayhigh = 0
daylow = close
//dayopen = open
//dayclose = close

if dayindex > lookback then
for j = 1 to barindex
if dayindex[j] = dayindex - lookback then
mydayhigh = dayhigh[j]
mydaylow = daylow[j]
break
endif
next
endif
endif

dayhigh = max(dayhigh,high)
daylow = min(daylow,low)
endif

if dayindex < lookback or not highlow then
mydayhigh = undefined
mydaylow = undefined
endif

if dayindex < lookback or not Centerline then
mytdaycenter = undefined
endif
//--end--

//-- proof close over/under high or low of intraday range--
mytdayhigh=DHigh(0)
mytdaylow=DLow(0)
DM0 = (mytdayhigh-mytdaylow)/2+mytdaylow

If DayTrend = 1 then
if close > DM0 then
DrawText("                         • over",barindex,open-10,Serif,Bold,12) coloured(0,255,0,alpha)
else
DrawText("                         • under",barindex,open+10,Serif,Bold,12) coloured(255,0,0,alpha)
endif
endif
//--end--

//--Centerline, center of range between intraday high/low--
If CenterLine = 1 then
mytdaycenter = DM0
else
mytdaycenter = undefined
endif
//--end--

//--Show Intraday HighLow as dotted line--
If HighLowIntraday = 1 then
mytdayhigh = DHigh(0)
mytdaylow = DLow(0)
else
mytdayhigh = undefined
mytdaylow = undefined
endif
//--end--


//--Arrows--
//Trend bzw Trend force
if Arrows = 1 then
BullTrend = (Close - LOWEST[20](LOW)) / AVERAGETRUERANGE[10]
BearTrend = (HIGHEST[20](HIGH) - Close) / AVERAGETRUERANGE[10]
Trend = (BullTrend - BearTrend)
TrendEMA = ExponentialAverage[20](Trend)

// On Balance Volumen zur Bestimmung der Kaufkraft der Bewegung/Trend
myOBV = OBV
myOBVA1 = ExponentialAverage[20](myOBV)
myOBVA2 = ExponentialAverage[10](myOBV)

if Trendforce = 1 and OBVforce = 1 then
If Trend > TrendEMA and myOBV > myOBVA1 and myOBV > myOBVA2 then
DRAWARROWup(barindex,low-2) coloured(0,255,0,alpha)
elsif Trend < TrendEMA and myOBV < myOBVA1 and myOBV < myOBVA2 then
DRAWARROWdown(barindex,high+2)coloured(255,0,0,alpha)
endif
elsIf OBVforce = 1 and not Trendforce then
if myOBV > myOBVA1 and myOBV > myOBVA2 then
DRAWARROWup(barindex,low-2) coloured(0,255,0,alpha)
elsif myOBV < myOBVA1 and myOBV < myOBVA2 then
DRAWARROWdown(barindex,high+2)coloured(255,0,0,alpha)
endif
elsIf Trendforce = 1 and not OBVforce then
if Trend > TrendEMA then
DRAWARROWup(barindex,low-2) coloured(0,255,0,alpha)
elsif Trend < TrendEMA then
DRAWARROWdown(barindex,high+2)coloured(255,0,0,alpha)
endif
endif
endif
//--end--

Return mydayhigh COLOURED (255, 0, 0)style(line, 2) AS "High", mydaylow COLOURED (0, 255, 0)style(line, 2) AS "Low", mytdayhigh COLOURED (255, 0, 0)style(dottedline, 1) AS "Today High", mytdaylow COLOURED (0, 255, 0)style(dottedline, 1) AS "Today Low", mytdaycenter COLOURED (255,153,0,255)style(dottedline, 1)as "Today Centerline"


// End and make money
Comments
You must be logged in to post a comment.


Clean view, thanks for sharing


THANKS A A LOT FOR SHARING. I like your trade. I try to remproduce your board but i dont arrive to put ATR10 with EMA20 under my charte on PRT. Can i have some help ? thanks by advance

Hola, ..soy de España tu también no?...Me ha parecido buena la idea de trading del indicador, pero no llego a comprenderla. El sistema parece obeder a un sistema de ruptura de expansion basado en el ATR, muy similar a la idea de trading de Jeff Cooper, pero la parte del OBV y fuerza de la tendencia no llego a entenderla.
OBV con bandas de Bollinger me muestra el desarrollo del volumen relativo. La tendencia solo es interesante si el volumen también es compatible con la tendencia. La fuerza de la tendencia es una relación de caída y aumento de los precios. Si hay más precios al alza que precios a la baja, espero un futuro aumento en los precios. Ambos apoyan mi evaluación de la calificación de la tabla. Así como las otras opciones. Intento cambiar la tendencia diaria. Pero al final es nuestra experiencia ;-) Puede activar o desactivar ambas opciones (OBVforce y Trendforce). O apagar completamente con "Flechas". Soy una alemana que vive en Marbella. Traduje esta traducción del alemán al español con Google. Un saludo
Hola, ..soy de España tu también no? Me ha parecido buena idea de trading del indicador, pero no llego a comprenderla. El sistema parece ser un sistema de ruptura de expansión basado en el ATR, muy similar a la idea de comercio de Jeff Cooper, pero la parte de la fuerza de la tendencia no llega a un sentido.

Ciao! . I have seen the pictures that explain this metod but i don't understand when is moment to buy. and i don't understand what the three numbers in the graph are (in the pictura for ex 27/13/14. Grazie!!!!!!!