Volume Weighted Moving Average (VWMA)

Volume Weighted Moving Average (VWMA)

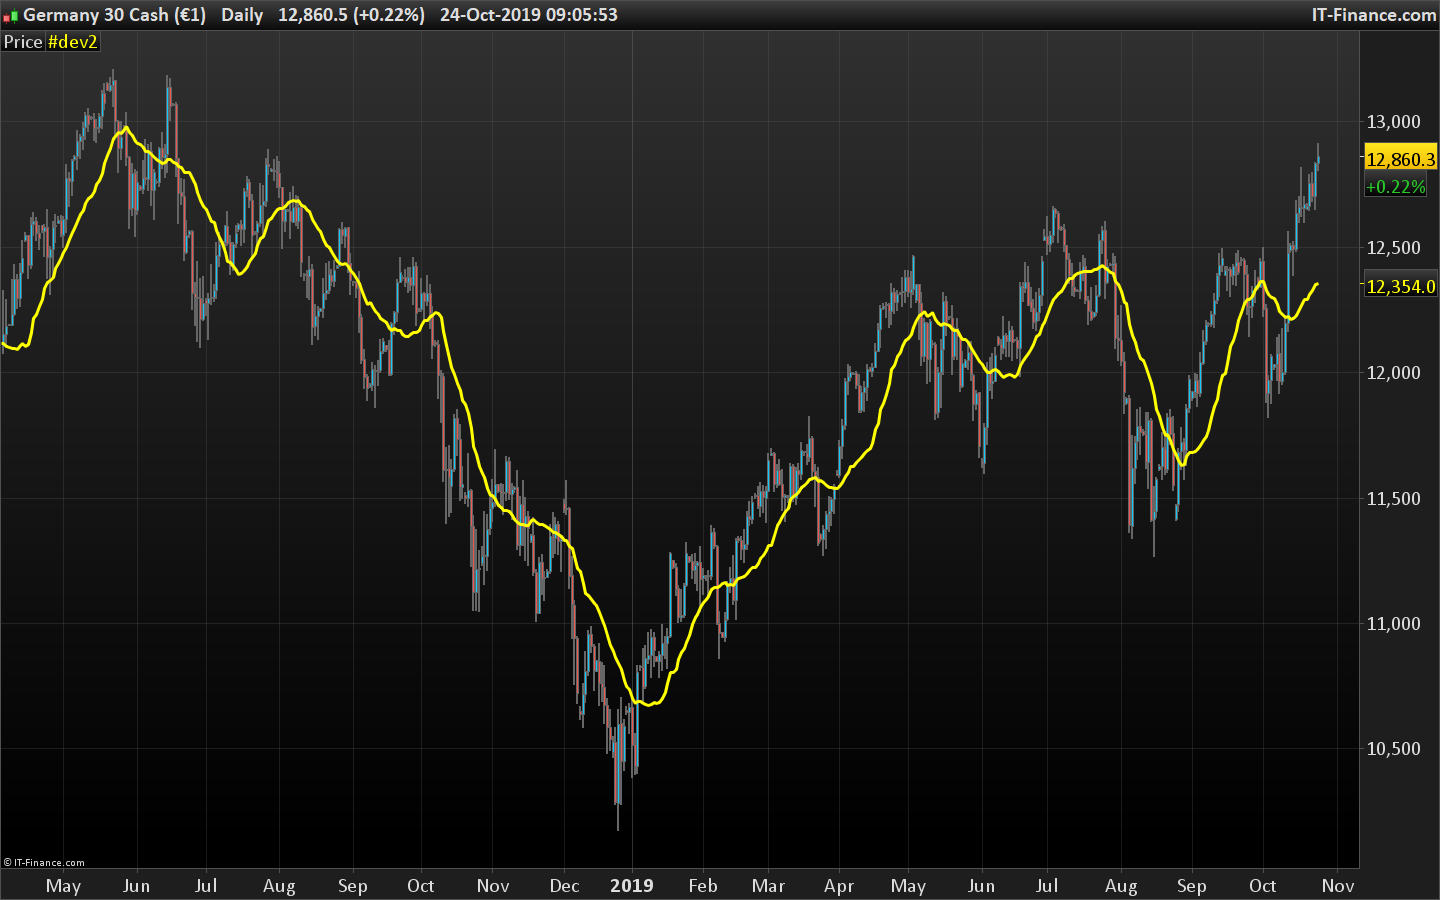
I know the Volume Weighted Moving Average indicator is available in PRT as an indicator but the code is not available for strategy building so I created the code.

Formula: 3-Day VWMA = (C1*V1 + C2*V2 + C3*V3) / (V1+ V2+ V3)

Where C is close and V is volume

Basic strategy as from “https://www.tradingsetupsreview.com/volume-weighted-moving-average-vwma/

To fully make use of the Volume Weighted Moving Average (VWMA), compare it with a SMA that does not include volume.

The SMA is a benchmark. This means that you should choose the same look-back period for both the SMA and the VWMA.  The only difference between the two moving averages is volume weighting.

What matters here is the gap between the VWMA and the SMA. Their difference shows the effect of volume weighting.

Generally, volume should increase along with the trend and decrease against it. Hence, generally, if the VWMA is above the SMA, it means that volume has been higher on up days. When the VWMA is below the SMA, it shows that down days had higher volume.

The Volume Weighted Moving Average has the ability to help discover emerging trends, identify existing ones and signal the end of a move.

What it does is to incorporate not only the last x periods of price into its calculation but also the average volume during those x periods. That means when the volume is stronger, the VWMA will follow price more closely, and when volume falls off, it will mimic a simple moving average. The VWMA does not make a difference between buying and selling volume, only the strength of volume itself, so it will simply get closer to the close of the day when volume increased on that day, no matter whether it is a bearish or a bullish close.

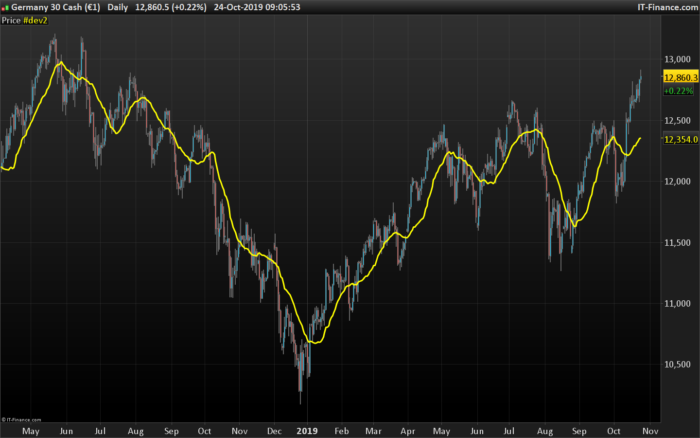
Important is – if the VWMA is above the SMA, we are moving in an uptrend, and when it is below, we do have bearish implications. Or even simpler, as long as the VWMA is between price and the SMA, we are trending in that direction.

Share this

Risk disclosure:

No information on this site is investment advice or a solicitation to buy or sell any financial instrument. Past performance is not indicative of future results. Trading may expose you to risk of loss greater than your deposits and is only suitable for experienced investors who have sufficient financial means to bear such risk.

ProRealTime ITF files and other attachments : How to import ITF files into ProRealTime platform?

PRC is also on YouTube, subscribe to our channel for exclusive content and tutorials
  1. Marie-Eve Vergoz • 10/24/2019 #

    Bonsoir –
    Voici l’erreur qui est signalée lorsque je souhaite utiliser cet indicateur : il est demandé de définir “lenght” – Pouvez-vous m’aider ? Merci infiniment

avatar
Register or

Likes

avatar avatar avatar avatar avatar avatar avatar avatar avatar avatar
Related users ' posts
Iván
2 months ago
Iván I personally like it in daily timeframe
oliTR Many thanks Ivan, I copy/paste your code to try it but could only get a constant stable unif...
Iván Hi, I've copied the code above and it works... what asset are you trying? $indices array ...
Ciccarelli Franco Sembra molto interessante e volevo dei chiarimenti se possibile :Le righe commentate vanno l...
KumoNoJuzza Thank you @philippe59139 !! We finally have the VAL / VAH to play with. Could you attach th...
jacquesgermain Bonjour non pas de soucis car src=customclose donc dans le menu configuration/propriété me...
geroniman Merci Jacques , indic tres utile. J'ai un indic à programmer avec du price action. es tu dis...
jacquesgermain ok pour regarder ...
JS
9 months ago
luxrun
9 months ago
Nicolas Il doit y avoir impérativement plus d'unités affichées que le paramètre "BarsLimit". Ceci ét...
steffen_burat Hello Nicolas, I have a cumulative histogram update problem, the indicator often updates ...
taklause Hello Nicolas, if I try to use your indicator in a trading system, the error on prc pops up ...
Nicolas
1 year ago
f1_maik Ein sehr schöner Indikator, vielen Dank. Wenn ich den Indikator importiere und starte hat d...
Nicolas das ist in der Tat normal, Sie müssen die Auf- und Abwärtsfarbe direkt im Parameterfenster d...
FXtonio Bonjour Nicolas, merci pour cette merveille, je l'utilise en compl2ment du "magical buy sell...
supertiti Bel outil si on ne se tape pas sur les doigts avec ! Comment ajoute-on une image avec le co...
magnus59 Hi Nicolas, thaks for your great work here, I need a scanner for the swedish OMX when ma...
Nicolas Yes, sure please open a new topic in the ProScreener forum section, thank you.
paullyons Hello! Thanks for post your indicators. I'd like you to let me know how to draw lines for ...
Rafa Hi Nicolas! I can´t install this indicator. it installs in a separate window not as an av...
Nicolas Add it on the price, see how: https://www.prorealcode.com/blog/video-tutorials/how-to-add-an...
Frankyslo1 No consigo instalarlo en el precio en PRL-version 10
Khaled As this section of the forum is in English, I'll reply in English. I'm using PRT v11, so I d...
sal157011 Don't understand where it says: "Volume Pressure Histogram: Columns plotted in positive are ...
Khaled Not sure to understand the question. However, the columns (Histogram) represent the variable...
Alai-n Cela fonctionne très bien !!! Super Merci
andreabarbuscia Ciao Nicolas, molto bello questo indicatore, l'ho apprezzato molto. Lo sto testando insieme...
Alai-n Je poste ici un lien afin de mieux appréhender le CVD-Cumulative Volume Delta : https://www....
Nicolas
2 years ago
DELBERT Bonsoir , Nicolas , j'ai transféré votre indicateur sur ma PRT 10,3 et j'ai un méssage d'ére...
Nicolas Vous pouvez essayer en remplacant la ligne avec: vwapsd = sqrt(average[lengthz](square(clo...
DELBERT Bonsoir , merci Nicolas , a bientôt .
Dest
2 years ago
DIDI Index
DIDI Index
0
Indicators
ChemaGeek Bonjour Nicolas, j'ai récemment découvert cet indicateur (Regularized Momentum 2017) et je l...
YvesRobert Bonjour, nouveau sur PRT (qq jours), j'essaie un peu de voir quel type d'indicateur me convi...

Top