TAC Volume MACD TIMING v1

v10.3
TAC Volume MACD TIMING v1

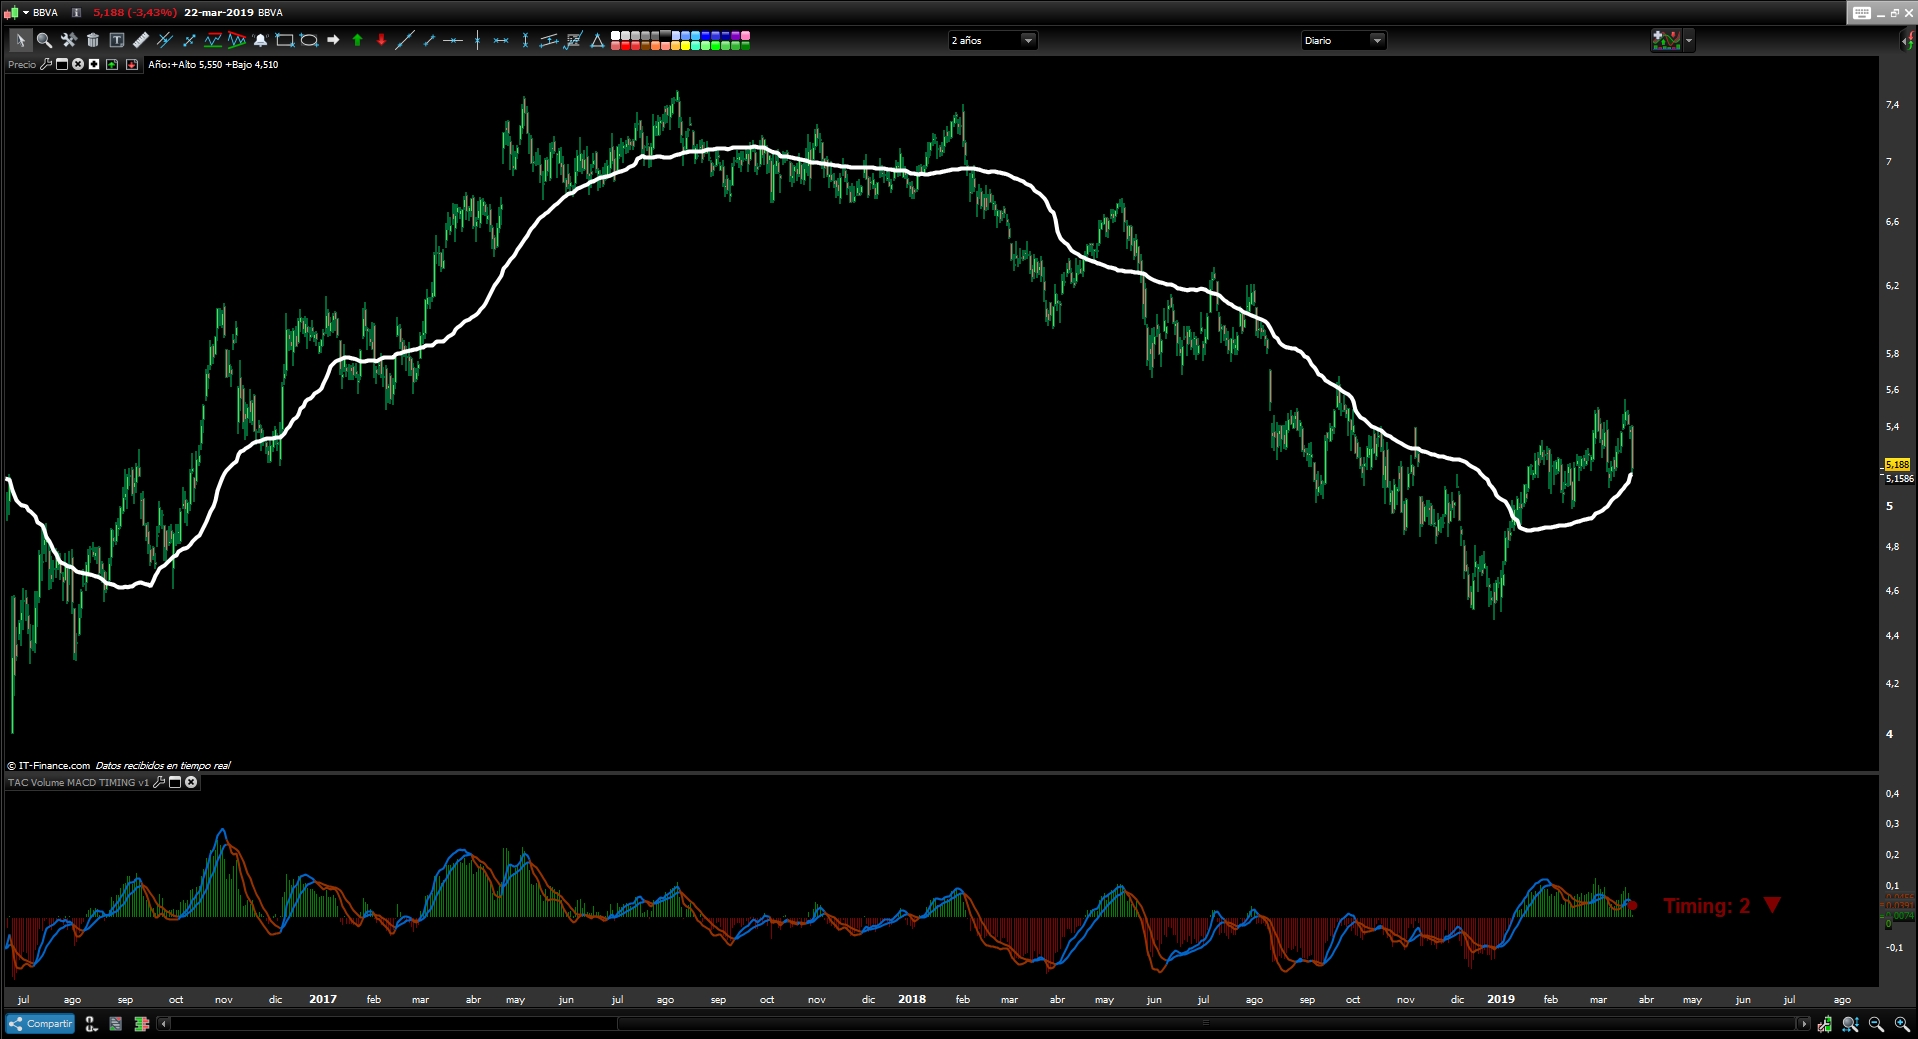
Multi-Indicator that combines several indicators to automate the movement of the price and trend based on the average of the entire volume distribution.

Wave: Average of the whole distribution of the volume in histogram form that measures the distance with the price, this provides in histogram mode the strength of the value based on the volume and marks the high point in the Histogram of the price reversal.

Timing: Recognizes all movements of the MACD indicator and lists them based on the trend obtained from the MACD and Wave indicators.

Bullish Trend

  • Timing 1: Bullish Momentum
  • Timing 2: Correction of Bullish Impulse
  • Timing 3: Possible Reversal of the “Bearish” trend, Pause Trading
  • Timing 4: Possible Reversal of the trend, Pause Trading

– The Timing 3 bullish trend will not work.

– The Timing 4 is a Timing of Pause, being this Timing the one that marks the bullish impulse in a market ceiling can be a trap. We have to wait for Timing 1 to confirm the continuation of the bullish momentum so as not to have a reversal of the movement and possible change of trend.

Bearish Trend

  • Timing -1: Bearish Momentum
  • Timing -2: Bullish Momentum of the Bearish trend
  • Timing -3: Possible Reversion of the trend, Pause Trading
  • Timing -4: Possible Continuation of the trend, Pause Trading

Documentation link

https://www.tiburonesdealetacorta.com/2019/03/tac-volume-macd-timing.html

Share this

Risk disclosure:

No information on this site is investment advice or a solicitation to buy or sell any financial instrument. Past performance is not indicative of future results. Trading may expose you to risk of loss greater than your deposits and is only suitable for experienced investors who have sufficient financial means to bear such risk.

ProRealTime ITF files and other attachments : How to import ITF files into ProRealTime platform?

PRC is also on YouTube, subscribe to our channel for exclusive content and tutorials

  1. Andyswede • 03/25/2019 #

    Splendid! Thanks:)

  2. swapping • 03/25/2019 #

    Nice job Bolsa 😉

  3. Juanjo • 03/25/2019 #

    Hola ¡¡¡ ..Muy buen trabajo, tengo una duda; en en codigo y visualmente, en ocasiones aparece : Timing: 3 – , ..esto es lo mismo, que Timing: -3?? Gracias por el indicador.

    • TAC Bolsa • 03/25/2019 #

      Gracias Juanjo, El Guion despues de número es pausa o indecisión de la tendencia y se da en los siguientes Timing,.

      Timing : 3 –
      Timing : -3 –
      Timing: 4 –
      Timing -4 –

  4. Juanjo • 03/25/2019 #

    Gracias. He hecho una modificación para q aparezca en el gráfico del precio

  5. Polnet • 03/25/2019 #

    Hay posibilidad de cambiar el Timing en el indicador, hay veces que se solapan con las medias

    • TAC Bolsa • 03/25/2019 #

      Seguramente es por copiar el código pon Espacios como te muestro.

      ” Timing:

      DRAWTEXT(” Timing: #TIMING# ▲”,barindex,hh1/sd,SansSerif,Bold,20)coloured(0,128,0)

  6. TAC Bolsa • 03/25/2019 #

    Ponle 30 Espacios entre la Comilla y el Timing:

    DRAWTEXT(“——————-Timing: #TIMING# ▲”,barindex,hh1/sd,SansSerif,Bold,20)coloured(0,128,0)

    reemplaza los guiones por espacios por lo que sea al copiar el texto le quita los espacios

  7. Polnet • 03/25/2019 #

    Solucionado, gracias

  8. Jan Wind • 03/25/2019 #

    Hallo Tac Bolsa,

    Thanks a lot for your coding above.
    As I am personally not very charmed of the MACD (delayed crossings), I adjusted the code and deleted the MACD calculation and simply replaced it for a weighted average.(see below)

    The average of the adjusted average volume seems to show good reversals of short term trends, if the average starts increasing from the lowest point, the probability of a succesful long position are reasonable. I am using it for 5 minutes trading, but also for trend watching on daily charts, and more timeframes inbetween.

    The Button ADD PRT Code does not function for me, so I copied my adustment below.
    ///////////////////////////////////////////////////////////////////////
    REM TAC Volume TEMA
    ////////////////////////////////////////////////////////////////////////
    iter = 60 //interations
    WA = 28 //wa of volume adjusted average

    zero=0 //null line in graph
    lv1=0
    lv2=0

    //Volume adjusted Average
    for i= 0 to iter do
    lv1=lv1+close[i]*Volume[i]
    lv2=lv2+Volume[i]
    next
    lv=lv1/lv2
    Wave = (close – lv)
    TWave = weightedaverage[WA](Wave)

    if Wave>=0 then // setting color red or green of histogram
    rm=0
    gm=128
    bm=0
    else
    rm=128
    gm=0
    bm=0
    endif
    if TWave>=TWave[1] then // setting color red or green of histogram
    ra=0
    ga=128
    ba=0
    else
    ra=128
    ga=0
    ba=0
    endif

    return Wave coloured (rm,gm,bm) style (histogram) as “Wave”, zero as “zero”, TWave coloured (ra,ga,ba) style(line,3) as “AvWave”

    • TAC Bolsa • 03/25/2019 #

      Thank you, Jan

      Any modification is good reference if it helps us win in the market.

  9. marcov66 • 03/25/2019 #

    Hi, it seems a very useful indicator. Unfortunately the link here for the full explanation does not work https://www.tiburonesdealetacorta.com/2019/03/tac-volume-macd-timing.html //// Thanks for sharing it again. Marco

  10. TACBOLSA • 03/25/2019 #

    Discontinued indicator. we are sorry.

    • Azzuerus • 71 days ago #

      Bonjour,
      je teste et j’utilise vos indicateurs depuis plusieurs années, et ils me sont devenus indispensables dans mes prises de décisions.
      Merci vraiment pour votre partage;
      Désireux de suivre de près la suite, est-il possible de m’autoriser à accéder à votre Blog ?
      Merci beaucoup.

avatar
Register or

Likes

avatar avatar avatar avatar avatar avatar avatar avatar avatar avatar avatar avatar avatar avatar avatar avatar

+2 more likes

Related users ' posts
Iván
2 months ago
Iván I personally like it in daily timeframe
oliTR Many thanks Ivan, I copy/paste your code to try it but could only get a constant stable unif...
Iván Hi, I've copied the code above and it works... what asset are you trying? $indices array ...
Ciccarelli Franco Sembra molto interessante e volevo dei chiarimenti se possibile :Le righe commentate vanno l...
KumoNoJuzza Thank you @philippe59139 !! We finally have the VAL / VAH to play with. Could you attach th...
Bateson
5 months ago
MACD Reloaded
MACD Reloaded
2
Indicators
NEOMKEY Nada nuevo
Carlose I love your version of the MACD, if you use it you can get a lot of use out of it, for me ma...
Matriciel Very nice job ! Is it possible to do the opposite because what interests me is to have the ...
YvesRobert Hi Matriciel, how can we do this, because stochastic is limited between 0 and 100 but price ...
Traderfox06 Dear zeiiermantrading, I really like your approach combining adaptive averages with MACD in...
jacquesgermain Hello IASD it's normal , when this occurs, uncheck RSI and MFI line and click then the MAC...
emiliobercial Thank you very much for sharing!
Carlose estoy de acuerdo con IASD Esta muy bien el MAD y el indicador en el precio no se ven bien...
JS
9 months ago
luxrun
9 months ago
Gianluca Amazing, thank You for your contribution!
Alex Spioglou Thank you for featuring my work, and I hope you found it useful. Mind the paper was publ...
Nicolas Il doit y avoir impérativement plus d'unités affichées que le paramètre "BarsLimit". Ceci ét...
steffen_burat Hello Nicolas, I have a cumulative histogram update problem, the indicator often updates ...
taklause Hello Nicolas, if I try to use your indicator in a trading system, the error on prc pops up ...
Rafa Hi Nicolas! I can´t install this indicator. it installs in a separate window not as an av...
Nicolas Add it on the price, see how: https://www.prorealcode.com/blog/video-tutorials/how-to-add-an...
Frankyslo1 No consigo instalarlo en el precio en PRL-version 10
Khaled As this section of the forum is in English, I'll reply in English. I'm using PRT v11, so I d...
sal157011 Don't understand where it says: "Volume Pressure Histogram: Columns plotted in positive are ...
Khaled Not sure to understand the question. However, the columns (Histogram) represent the variable...
Alai-n Cela fonctionne très bien !!! Super Merci
andreabarbuscia Ciao Nicolas, molto bello questo indicatore, l'ho apprezzato molto. Lo sto testando insieme...
Alai-n Je poste ici un lien afin de mieux appréhender le CVD-Cumulative Volume Delta : https://www....
Nicolas
2 years ago
DELBERT Bonsoir , Nicolas , j'ai transféré votre indicateur sur ma PRT 10,3 et j'ai un méssage d'ére...
Nicolas Vous pouvez essayer en remplacant la ligne avec: vwapsd = sqrt(average[lengthz](square(clo...
DELBERT Bonsoir , merci Nicolas , a bientôt .
ChemaGeek Bonjour Nicolas, j'ai récemment découvert cet indicateur (Regularized Momentum 2017) et je l...
YvesRobert Bonjour, nouveau sur PRT (qq jours), j'essaie un peu de voir quel type d'indicateur me convi...
poldoposta si potrebbe trovare una soluzione per sovrapporlo al prezzo?
robertogozzi Basta che tu clicchi sull'etichetta (tag) PREZZO del grafico (appena sotto l'angolo in alto ...
Ichimoku Reading I don't know in this case, I just downloaded it again and no problem for me. Try to downloa...
Ichimoku Reading What's the error that appears ?
Suzu Yuk Yes, it worked with 1Tick with 200 K . Thank you very much.
Daniele Maddaluno If you need to use it in PRT v11 take a look at this topic: https://www.prorealcode.com/top...
Monobrow Hi Daniele Thank you for the indicator, it looks very good. However, I have a problem so...
avatar
Anonymous Thanks very much for sharing, look forward to testing this idea out.

Top