







TAC Buy-Sell
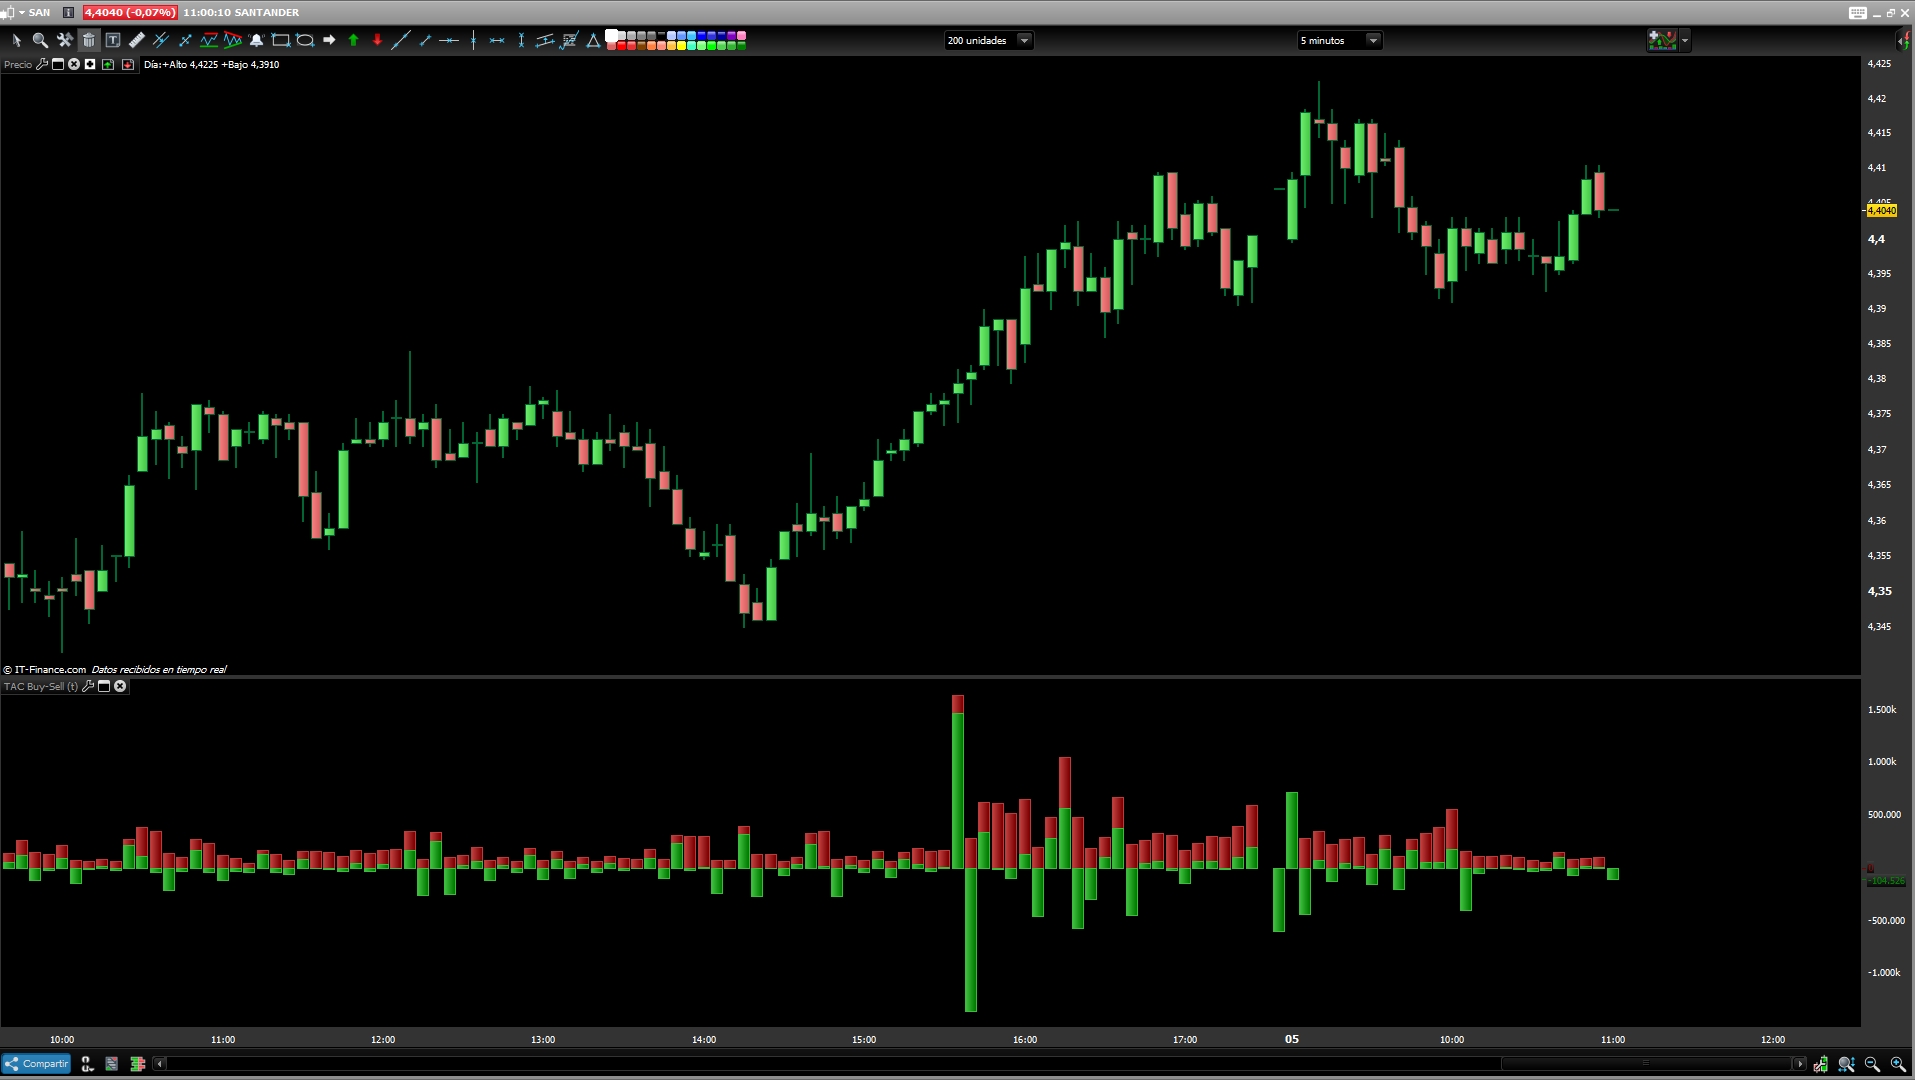
It is a professional tool to analyze the volumes of negotiation differentiating
purchases in the market and sales.
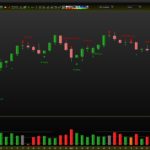
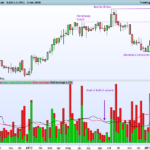
The formula is obtained by subtracting the ASK – BID = Delta Bar and dividing it into two components resulting in a histogram:
– Green bar: positive “aggressiveness of buyers”, BID.
– Red Bar: negative “aggressiveness of sellers”, ASK.
///////////////////////////////////////////////////////////////////////
REM TAC Buy-Sell
REM TAC Buy-Sell | indicator
REM 03.07.2014
REM TAC @ www.tiburonesdealetacorta.com
REM Sharing www.tiburonesdealetacorta.com
////////////////////////////////////////////////////////////////////////

If subasta=1 then
 b=close > low and volume > high
 ce=close < high and volume > low
 if b or ce then
  vols=volume
 else
  vols=0
 endif
endif
if subasta=0 then
 vols=volume
endif

VolSell=Vols+(high-low)/2
VolBuy=Vols-VolSell[1]

return VolSell coloured (128,0,0) style(histogram) as "SELL VOLUME",VolBuy coloured (0,128,0) style(histogram) as "BUY VOLUME"
Comments
You must be logged in to post a comment.

please can you help me to understand? i know i am wrong: Long Histogram = High Volume Short HIstogram = Low Volume GreenZone = Buyer volume RedZone = Seller volume Up Histogram = Delta Positive (buyer stronger than seller) Down Histogram = Delta Negative (seller stronger than buyer) but it is wrong according to the picture, because i see a lot of red up histogram

What is the value of the variable subasta?
Hi, It is a condition that is used to hide the auction in shares in 5 minutes or Tick as shown in the link. For futures or other instruments without auction you have to uncheck the auction option. https://1.bp.blogspot.com/-Xw7YMa2pym0/XJXY7f9hGfI/AAAAAAAACi4/obGUv6HwXX8UXbT3EFk4ZdGseIU8KkyzgCLcBGAs/s1600/BBVADIV.jpg
Hey TAC, Did you ever find a solution to this?