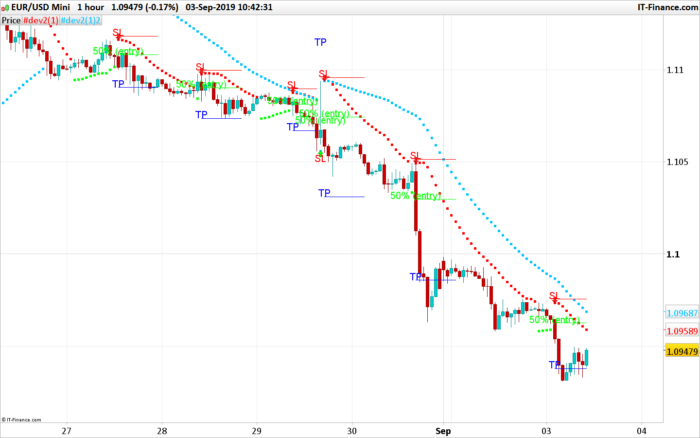
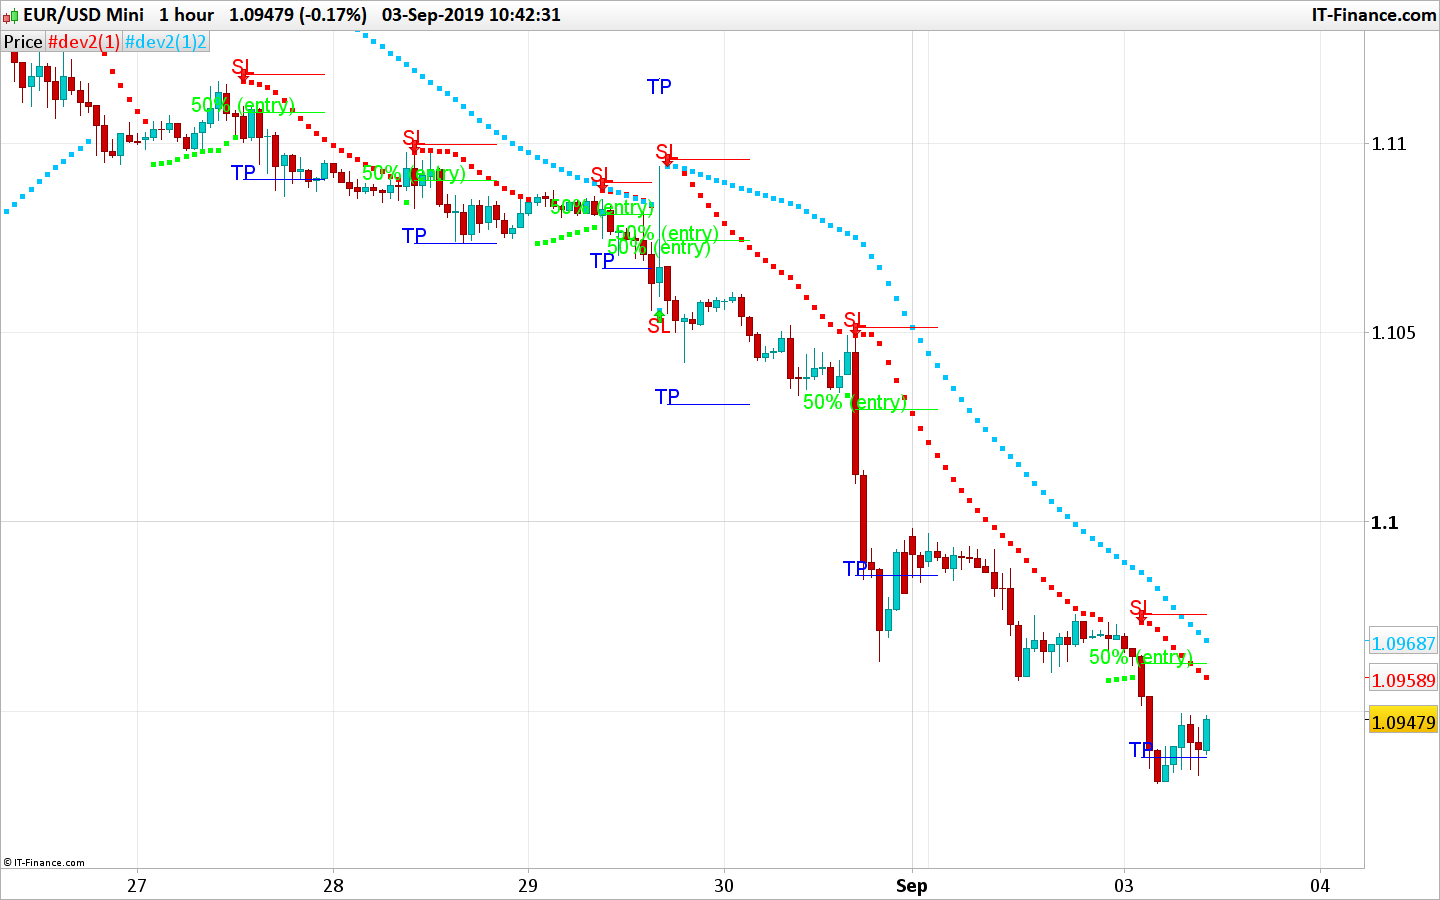
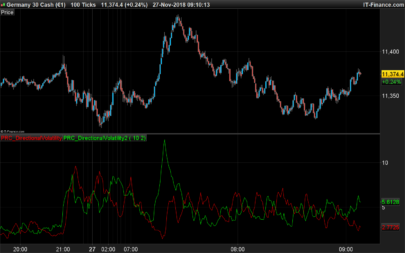
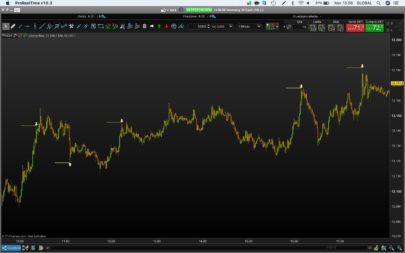
This scalping indicator was requested in the indicators’ forum, it contains 2 parabolic SAR of different settings and plot automatically entry, stoploss and target levels calculated with Fibonacci retracement.
The rules are:
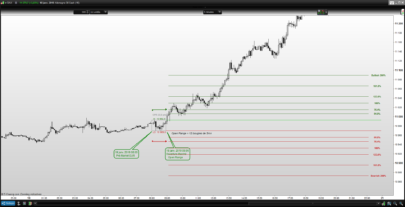
LONG
- When price breaks up through the 0.02 & 0.2 PSAR you draw a Fibonacci retracement
- from the closest last significant low (before pirce broke PSAR)
- to the high of the bar that broke the PSAR.
- This gives you your PROFIT TARGET at 161.8% Level
- and your ENTRY ar 50% level
- STOP = Last Signifcant low -2 Pips
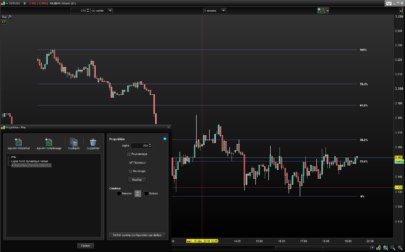
SHORT
- When price breaks down through the 0.02 & 0.2 PSAR you draw a Fibonacci retracement
- from the closest last significant high (before pirce broke PSAR)
- to the low of the bar that broke the PSAR.
- This gives you your PROFIT TARGET at 161.8% Level
- and your ENTRY ar 50% level
- STOP = Last Signifcant high +2 Pips
|
1 2 3 4 5 6 7 8 9 10 11 12 13 14 15 16 17 18 19 20 21 22 23 24 25 26 27 28 29 30 31 32 33 34 35 36 37 38 39 40 41 42 43 44 45 46 47 48 49 50 51 52 53 54 55 56 57 58 59 60 61 62 63 64 65 66 67 68 69 70 71 72 73 74 |
//PRC_Scalping with Parabolic SAR and Fibonacci | indicator //03.09.2019 //Nicolas @ www.prorealcode.com //Sharing ProRealTime knowledge // --- settings plotbar=10 //bars duration for plotting the fib zones // --- end of settings sarfast=SAR[0.02,0.02,0.2] sarslow=SAR[0.005,0.005,0.05] //colors if close>sarfast then //bullish trend r=0 g=255 else //bearish trend r=255 g=0 endif //highs and lows if close<sarfast then ll=min(ll,low) else hh=max(hh,high) endif if close>sarfast and close[1]<sarfast[1] then //new bullish signal fibo0=ll ll=sarslow //reset ll if close>sarslow then startbar=barindex irange=high-fibo0 entry = fibo0+(irange/2) itarget = fibo0+irange*1.618 istop = fibo0-2*pointsize drawarrowup(startbar,fibo0) coloured(0,255,0) drawtext("50% (entry)",barindex,entry-2*pointsize,dialog,standard,20) coloured(0,255,0) drawtext("SL",barindex,istop-2*pointsize,dialog,standard,20) coloured(255,0,0) drawtext("TP",barindex,itarget-2*pointsize,dialog,standard,20) coloured(0,0,255) endif endif if close<sarfast and close[1]>sarfast[1] then //new bearish signal fibo0=hh hh=0 //reset hh if close<sarslow then startbar=barindex irange=fibo0-low entry = fibo0-(irange/2) itarget = fibo0-irange*1.618 istop = fibo0+2*pointsize drawarrowdown(startbar,fibo0) coloured(255,0,0) drawtext("50% (entry)",barindex,entry+2*pointsize,dialog,standard,20) coloured(0,255,0) drawtext("SL",barindex,istop+2*pointsize,dialog,standard,20) coloured(255,0,0) drawtext("TP",barindex,itarget+2*pointsize,dialog,standard,20) coloured(0,0,255) endif endif //plot fib zones if barindex-startbar<=plotbar then if close>sarslow then //bullish trend drawsegment(startbar,istop,barindex,istop) coloured(255,0,0) //stoploss drawsegment(startbar,entry,barindex,entry) coloured(0,255,0) //entry at 50% fibo drawsegment(startbar,itarget,barindex,itarget) coloured(0,0,255) //target at 161.8% fibo endif if close<sarslow then //bearish trend drawsegment(startbar,istop,barindex,istop) coloured(255,0,0) //stoploss drawsegment(startbar,entry,barindex,entry) coloured(0,255,0) //entry at 50% fibo drawsegment(startbar,itarget,barindex,itarget) coloured(0,0,255) //target at 161.8% fibo endif endif return sarfast coloured(r,g,0) style(point,5),sarslow coloured(0,195,255) style(point,5) |
Share this
No information on this site is investment advice or a solicitation to buy or sell any financial instrument. Past performance is not indicative of future results. Trading may expose you to risk of loss greater than your deposits and is only suitable for experienced investors who have sufficient financial means to bear such risk.
ProRealTime ITF files and other attachments :
Find other exclusive trading pro-tools on ![]()
PRC is also on YouTube, subscribe to our channel for exclusive content and tutorials


Thanks, Nicolas, looking forward to experimenting with it.
well, the last part of the code could have been more simple, i just saw that i let some of the rough code in it.. but it does not impact the functionality.
How can i get the chart to where my price is? it always open in new window and i tried adding price but did not work
Add it on the price chart by using the wrench at the left upper side of the price chart.
Nicolas you are the best. Always!
Bonjour Nicolas,
Merci pour ce bel indicateur. Que donne t-il en backtest ?
Aucune idée, c’est une traduction fidèle d’une stratégie de trading manuel qui a été demandé dans le forum.
Tried converting this into a strategy but based on results not sure if I did it right. Especially the part where I need to refresh the stop orders based on the plotbar variable (in order to keep them valid)
Defparam cumulateorders = False
possize = 1
plotbar = 10 //no of bars to keep stop orders valid
buffer = 2*pointsize
sarfast=SAR[0.02,0.02,0.2]
sarslow=SAR[0.005,0.005,0.05]
FibTarget = 1.618
FibStop = 50 //Expressed as percentage
//highs and lows
if close sarfast and close[1] sarslow) or (barindex – startbar <= plotbar) then
startbar = barindex
irange = high – fibo0
entry = fibo0 + (irange/(100/FibStop))
itarget = fibo0 + irange*FibTarget
istop = fibo0 – buffer
Buy possize contract at entry-buffer stop
Set stop ploss (entry-buffer) – (istop-buffer)
Set target pprofit (itarget-buffer) – (entry-buffer)
endif
endif
if (close sarfast[1]) Then//new bearish signal
fibo0 = hh
hh = 0 //reset hh
if (close < sarslow) or (barindex – startbar <= plotbar) then
startbar = barindex
irange = fibo0 – low
entry = fibo0 – (irange/(100/FibStop))
itarget = fibo0 – irange*FibTarget
istop = fibo0 + buffer
Sellshort possize contract at entry+buffer stop
Set stop ploss (entry+buffer) + (istop+buffer)
Set target pprofit (entry+buffer) – (itarget+buffer)
endif
endif
hello juanj, can you send the code repair by your good care to try scalping please?
Format of the above code is broken, the greater than and smaller than signs have disappeared. I tried using the Add PRT code option but it doesn’t work for Library posts.
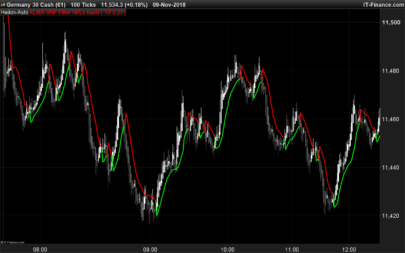
Bonjour Nicolas, merci pour ton aide précieuse. J aimerai avoir un indic sur le graphe avec des buy et sell dés que 2 hakenashi vert sont cassés à la baisse ( sell) ou 2 HA rouge sont cassés à la hausse( buy). Existe t’il ce code sur PRT? Géraud
Merci d’ouvrir un nouveau sujet sur le forum des indicateurs, on verra ce qu’on peut faire pour créer cet indicateur de signaux de trading.
required above mt4 indicators & mt4 template plz
we do not provide mt4 indicators on our website, you can download and use the above code on ProRealTime trading software: https://www.prorealtime.com/
Bonjour Nicolas, j’espère que vous allez bien.
Je vous remercie pour ce code, j’ai une petite question au niveau d’une variable.
À la ligne numéro 24 de votre code, vous déclarez la variable “ll” comme ceux-ci “ll=min(ll,low)”.
Cependant, je me demande à quoi elle est égale ? Car vous l’utilisez comme argument dans la fonction min(args, args) toujours à la ligne 24.
Car dans ma logique pour moi, elle est nulle car aucune valeur lui est attribué avant…
J’imagine qu’il y a un concept que je dois ignorer propre au langage PRT.
Pouvez m’éclairer svp ?
Je vous remercie d’avance pour votre réponse et je vous souhaite une bonne journée,
bien à vous, Tom’s – Leofi.
il est égale à la valeur minimale entre lui-même et Low
D’accord, je vous remercie pour votre réponse.
Bonne journée, bien à vous, Tom’s – Leofi.
what is the buy condition or sell condition for this
can you suggest a code k1=1 buy and k1=-2 sell at those levels as mentioned in the code? at the moment is there no indicator it says?
I would like to know at point 1 an alert or binary indicator so that I can place order
Bonjour Nicolas, merci pour ce code qui a l’air intéressant. Comment ajouter dans le code l’indication pour qu’il ne s’affiche que sur une plage horaire spécifique, par exemple de 9h a 22 h ?
De plus comment pourrions nous placer une alerte lorsque le signal Entry Apparait afin de ne pas être toujours en train de surveiller tous les graphes ? Merci encore pour tout le travail fourni
nicolas e possibile farlo diventare un sistema di treding e chi potrebbe farmelo