




More from ProRealCode
ProRealCode - Trading & Coding with ProRealTime™
The ProRealTime™ community on the web! Officially sharing ProRealTime knowledge to Worldwide users since 2015!



Swing Determinator Parabolic SAR
July 31, 2018, 10:54 AM
Indicators
4 Comments
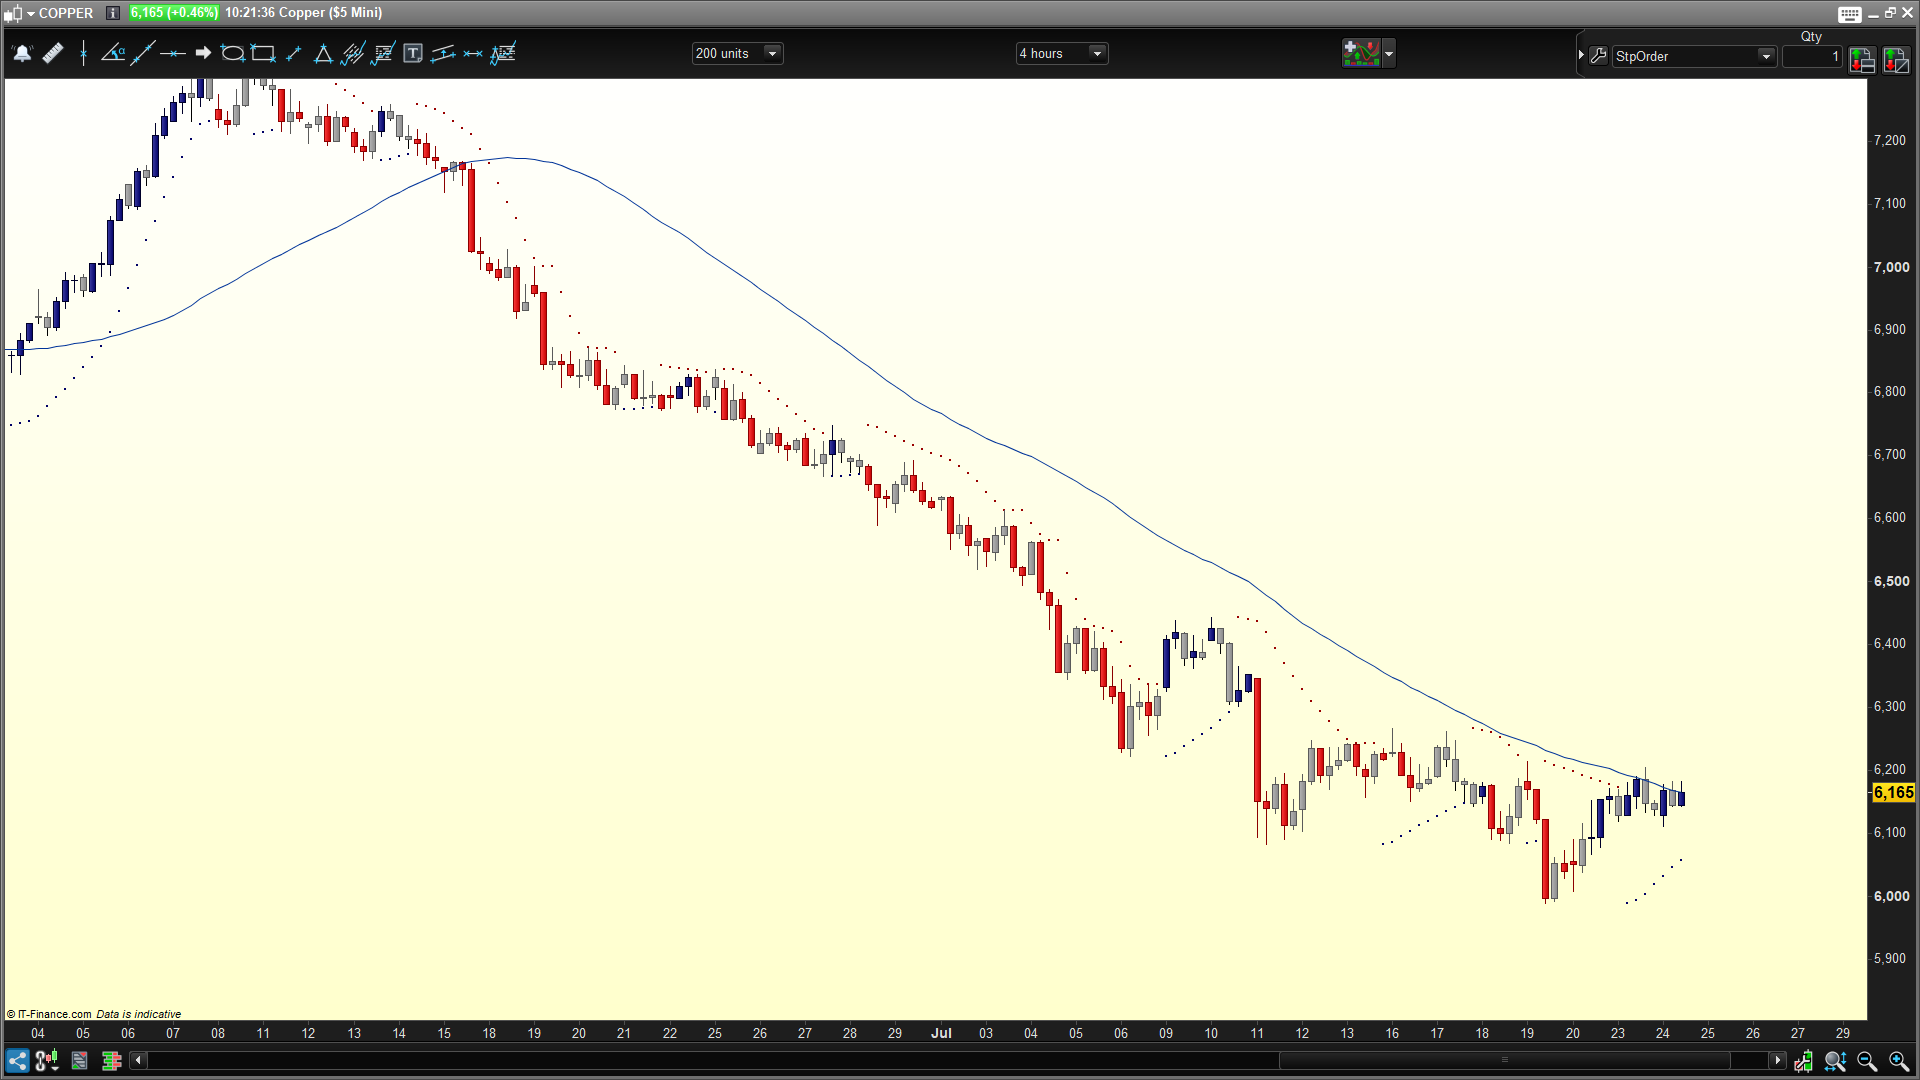
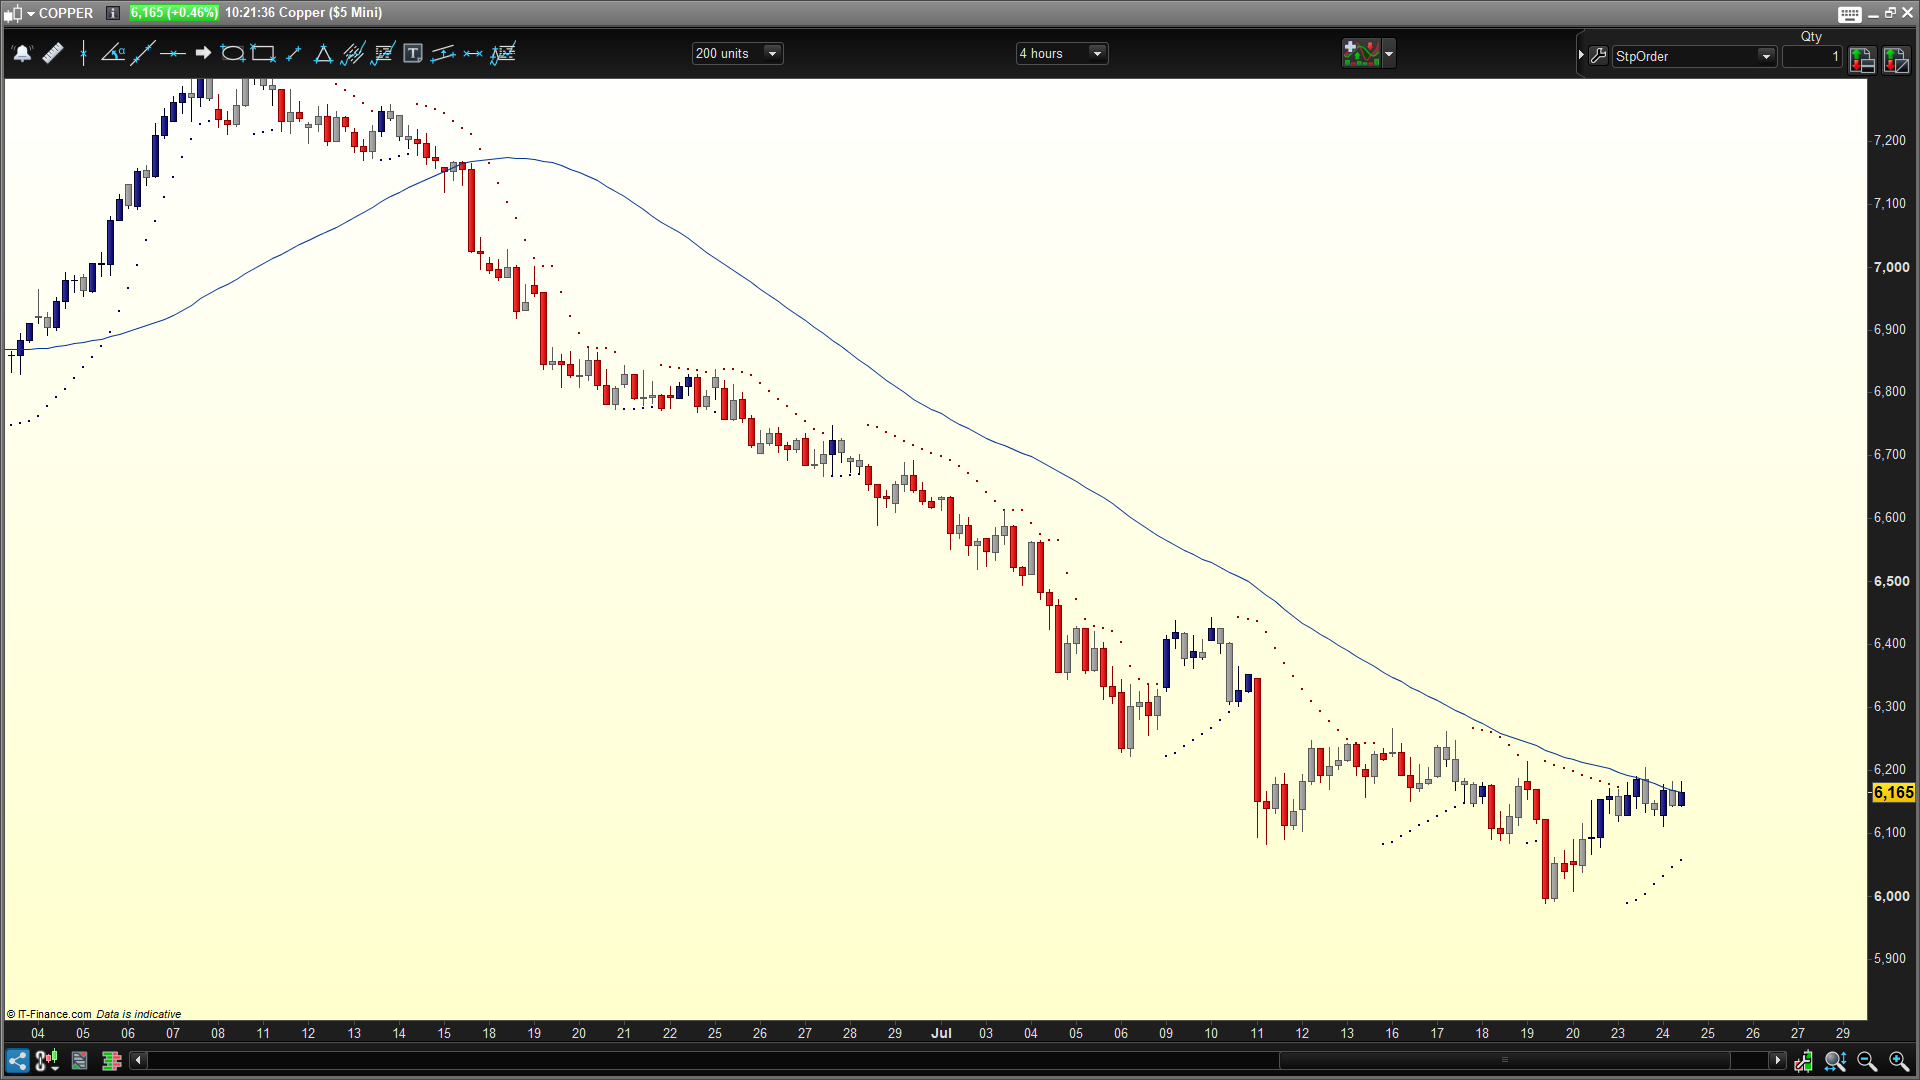
This Swing determiner is based on the Parabolic SAR indicator trend by Welles Wilder. The dots above or below the price evolve in a parabolic shape to the price and are used to exit a trade (the stoploss).
When a red (short) or blue (long) candle is formed after a swing of Parabolic SAR, an entry order can be placed after the close, in the direction of the color. After the entry the stoploss order is trailed on the dots of the Parabolic SAR. The exit is when the stoploss is hit.
The grey candles will be ignored as entry signal.
//Swing Determinator Parabolic SAR
//11-07-2018
//Marcel van Vliet

//--- parameters

// mmTYPE=1 (mm type)
// ---


bodyhigh = max(open,close)
bodylow = min(open,close)

if(open<=close and close > SAR) then
 LongWickUp = high
 LongCandleUp = bodyHigh
 LongWickDown = low
 LongCandleDown = bodyLow
elsif(open>=close and close > SAR) then
 LongWickUp = low
 LongCandleUp = bodyLow
 LongWickDown = high
 LongCandleDown = bodyHigh
elsif(open<=close and close < SAR) then
 ShortWickUp = high
 ShortCandleUp = bodyHigh
 ShortWickDown = low
 ShortCandleDown = bodyLow
elsif(open>=close and close < SAR) then
 ShortWickUp = high
 ShortCandleUp = bodyLow
 ShortWickDown = low
 ShortCandleDown = bodyHigh
endif

//bullish candlesticks
if close>SAR then
 DRAWCANDLE(LongCandleDown,LongWickUp,LongWickDown,LongCandleUp) coloured(0,0,102)
Endif

//Neutral candlesticks above the MA
If close>SAR and close<open then
 DRAWCANDLE(LongCandleDown,LongWickUp,LongWickDown,LongCandleUp) coloured(150,150,150)
Endif

//bearish candlesticks
if close<SAR then
 DRAWCANDLE(ShortCandleDown,ShortWickUp,ShortWickDown,ShortCandleUp) coloured(200,0,0)
Endif

//Neutral candlesticks under the MA
If close<SAR and close>open then
 DRAWCANDLE(ShortCandleDown,ShortWickUp,ShortWickDown,ShortCandleUp) coloured(150,150,150)
Endif


RETURN
Download
Filename:
Swing-Determinator-PSAR.itf
Downloads:
292
Download
Filename:
Copper.png
Downloads:
136
Veteran
Code artist, my biography is a blank page waiting to be scripted. Imagine a bio so awesome it hasn't been coded yet.
Author’s Profile
Similar code
Master Swing TradingIndicators
LastManStanding Swing indicatorIndicators
Williams’ Highs and LowsIndicators
HL-TrendIndicators
Williams Swing PointsScreeners
Bullish Swing setupScreeners


Loading...
I dont get the dots! What am i doing wrong? :)