







Scalping with Parabolic SAR and Fibonacci
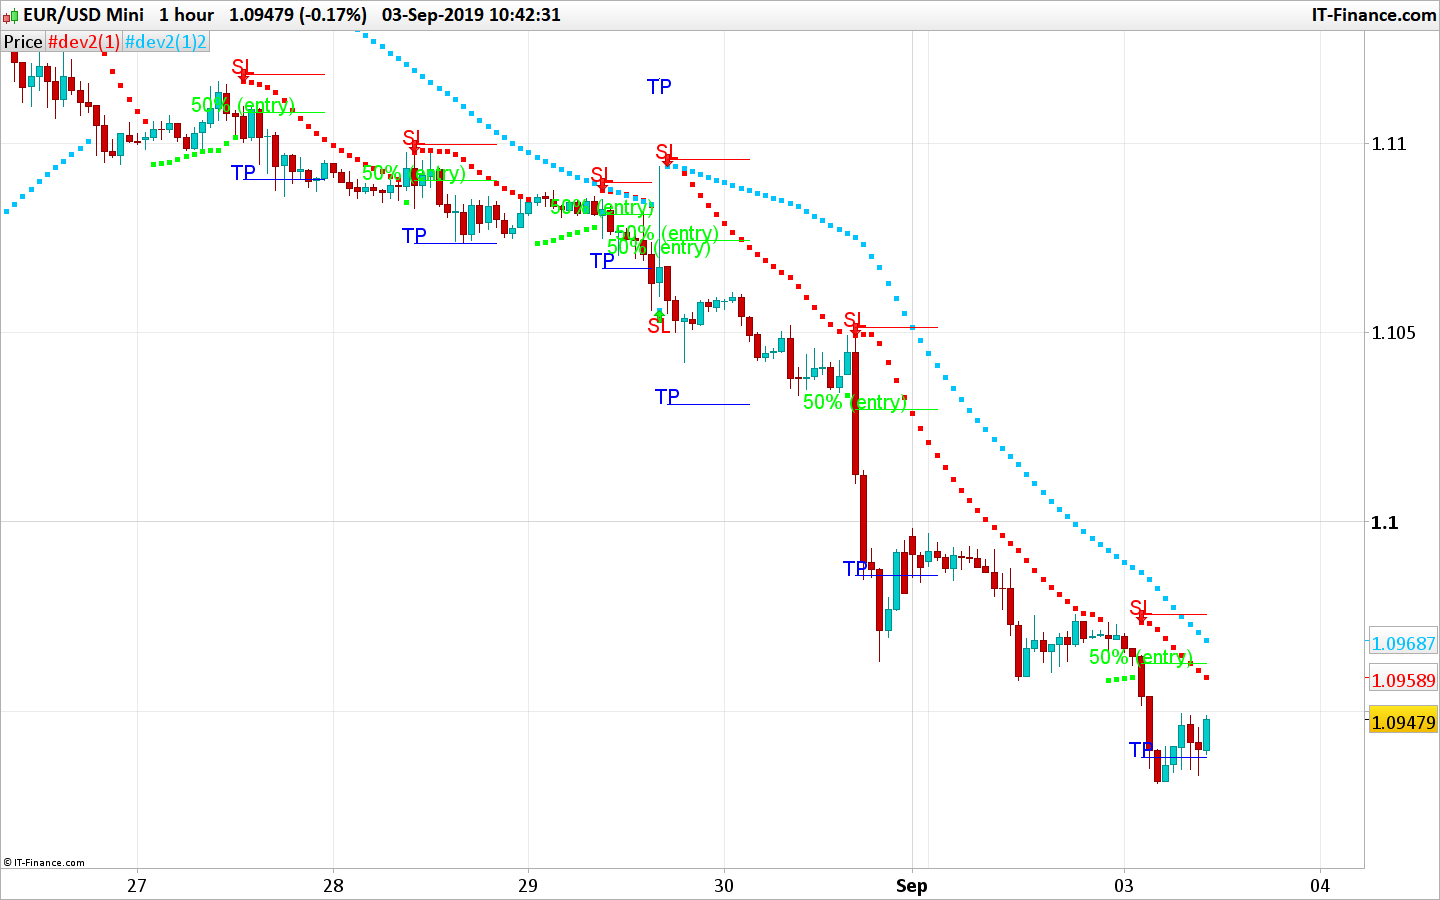
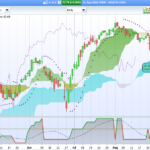
This scalping indicator was requested in the indicators’ forum, it contains 2 parabolic SAR of different settings and plot automatically entry, stoploss and target levels calculated with Fibonacci retracement.
The rules are:
LONG
- When price breaks up through the 0.02 & 0.2 PSAR you draw a Fibonacci retracement
- from the closest last significant low (before pirce broke PSAR)
- to the high of the bar that broke the PSAR.
- This gives you your PROFIT TARGET at 161.8% Level
- and your ENTRY ar 50% level
- STOP = Last Signifcant low -2 Pips
SHORT
- When price breaks down through the 0.02 & 0.2 PSAR you draw a Fibonacci retracement
- from the closest last significant high (before pirce broke PSAR)
- to the low of the bar that broke the PSAR.
- This gives you your PROFIT TARGET at 161.8% Level
- and your ENTRY ar 50% level
- STOP = Last Signifcant high +2 Pips
//PRC_Scalping with Parabolic SAR and Fibonacci | indicator
//03.09.2019
//Nicolas @ www.prorealcode.com
//Sharing ProRealTime knowledge

// --- settings
plotbar=10 //bars duration for plotting the fib zones
// --- end of settings

sarfast=SAR[0.02,0.02,0.2]
sarslow=SAR[0.005,0.005,0.05]

//colors
if close>sarfast then //bullish trend
 r=0
 g=255
else //bearish trend
 r=255
 g=0
endif

//highs and lows
if close<sarfast then
 ll=min(ll,low)
else
 hh=max(hh,high)
endif

if close>sarfast and close[1]<sarfast[1]  then //new bullish signal
 fibo0=ll
 ll=sarslow //reset ll
 if close>sarslow then
  startbar=barindex
  irange=high-fibo0
  entry = fibo0+(irange/2)
  itarget = fibo0+irange*1.618
  istop = fibo0-2*pointsize
  drawarrowup(startbar,fibo0) coloured(0,255,0)
  drawtext("50% (entry)",barindex,entry-2*pointsize,dialog,standard,20) coloured(0,255,0)
  drawtext("SL",barindex,istop-2*pointsize,dialog,standard,20) coloured(255,0,0)
  drawtext("TP",barindex,itarget-2*pointsize,dialog,standard,20) coloured(0,0,255)
 endif
endif
if close<sarfast and close[1]>sarfast[1] then //new bearish signal
 fibo0=hh
 hh=0 //reset hh
 if  close<sarslow then
  startbar=barindex
  irange=fibo0-low
  entry = fibo0-(irange/2)
  itarget = fibo0-irange*1.618
  istop = fibo0+2*pointsize
  drawarrowdown(startbar,fibo0) coloured(255,0,0)
  drawtext("50% (entry)",barindex,entry+2*pointsize,dialog,standard,20) coloured(0,255,0)
  drawtext("SL",barindex,istop+2*pointsize,dialog,standard,20) coloured(255,0,0)
  drawtext("TP",barindex,itarget+2*pointsize,dialog,standard,20) coloured(0,0,255)
 endif
endif

//plot fib zones
if barindex-startbar<=plotbar then
 if close>sarslow then //bullish trend
  drawsegment(startbar,istop,barindex,istop) coloured(255,0,0) //stoploss
  drawsegment(startbar,entry,barindex,entry) coloured(0,255,0) //entry at 50% fibo
  drawsegment(startbar,itarget,barindex,itarget) coloured(0,0,255) //target at 161.8% fibo
 endif
 if close<sarslow then //bearish trend
  drawsegment(startbar,istop,barindex,istop) coloured(255,0,0) //stoploss
  drawsegment(startbar,entry,barindex,entry) coloured(0,255,0) //entry at 50% fibo
  drawsegment(startbar,itarget,barindex,itarget) coloured(0,0,255) //target at 161.8% fibo
 endif
endif

return sarfast coloured(r,g,0) style(point,5),sarslow coloured(0,195,255)  style(point,5)
Comments
You must be logged in to post a comment.

Bonjour Nicolas, merci pour ce code qui a l'air intéressant. Comment ajouter dans le code l'indication pour qu'il ne s'affiche que sur une plage horaire spécifique, par exemple de 9h a 22 h ? De plus comment pourrions nous placer une alerte lorsque le signal Entry Apparait afin de ne pas être toujours en train de surveiller tous les graphes ? Merci encore pour tout le travail fourni


Bonjour Nicolas, j'espère que vous allez bien. Je vous remercie pour ce code, j'ai une petite question au niveau d'une variable. À la ligne numéro 24 de votre code, vous déclarez la variable "ll" comme ceux-ci "ll=min(ll,low)". Cependant, je me demande à quoi elle est égale ? Car vous l'utilisez comme argument dans la fonction min(args, args) toujours à la ligne 24. Car dans ma logique pour moi, elle est nulle car aucune valeur lui est attribué avant... J'imagine qu'il y a un concept que je dois ignorer propre au langage PRT. Pouvez m'éclairer svp ? Je vous remercie d'avance pour votre réponse et je vous souhaite une bonne journée, bien à vous, Tom's - Leofi.

required above mt4 indicators & mt4 template plz

Bonjour Nicolas, merci pour ton aide précieuse. J aimerai avoir un indic sur le graphe avec des buy et sell dés que 2 hakenashi vert sont cassés à la baisse ( sell) ou 2 HA rouge sont cassés à la hausse( buy). Existe t'il ce code sur PRT? Géraud

Defparam cumulateorders = False possize = 1 plotbar = 10 //no of bars to keep stop orders valid buffer = 2*pointsize sarfast=SAR[0.02,0.02,0.2] sarslow=SAR[0.005,0.005,0.05] FibTarget = 1.618 FibStop = 50 //Expressed as percentage //highs and lows if close sarfast and close[1] sarslow) or (barindex - startbar <= plotbar) then startbar = barindex irange = high - fibo0 entry = fibo0 + (irange/(100/FibStop)) itarget = fibo0 + irange*FibTarget istop = fibo0 - buffer Buy possize contract at entry-buffer stop Set stop ploss (entry-buffer) - (istop-buffer) Set target pprofit (itarget-buffer) - (entry-buffer) endif endif if (close sarfast[1]) Then//new bearish signal fibo0 = hh hh = 0 //reset hh if (close < sarslow) or (barindex - startbar <= plotbar) then startbar = barindex irange = fibo0 - low entry = fibo0 - (irange/(100/FibStop)) itarget = fibo0 - irange*FibTarget istop = fibo0 + buffer Sellshort possize contract at entry+buffer stop Set stop ploss (entry+buffer) + (istop+buffer) Set target pprofit (entry+buffer) - (itarget+buffer) endif endif

hello juanj, can you send the code repair by your good care to try scalping please?



How can i get the chart to where my price is? it always open in new window and i tried adding price but did not work

nicolas e possibile farlo diventare un sistema di treding e chi potrebbe farmelo