







Z-Score Distance From VWAP
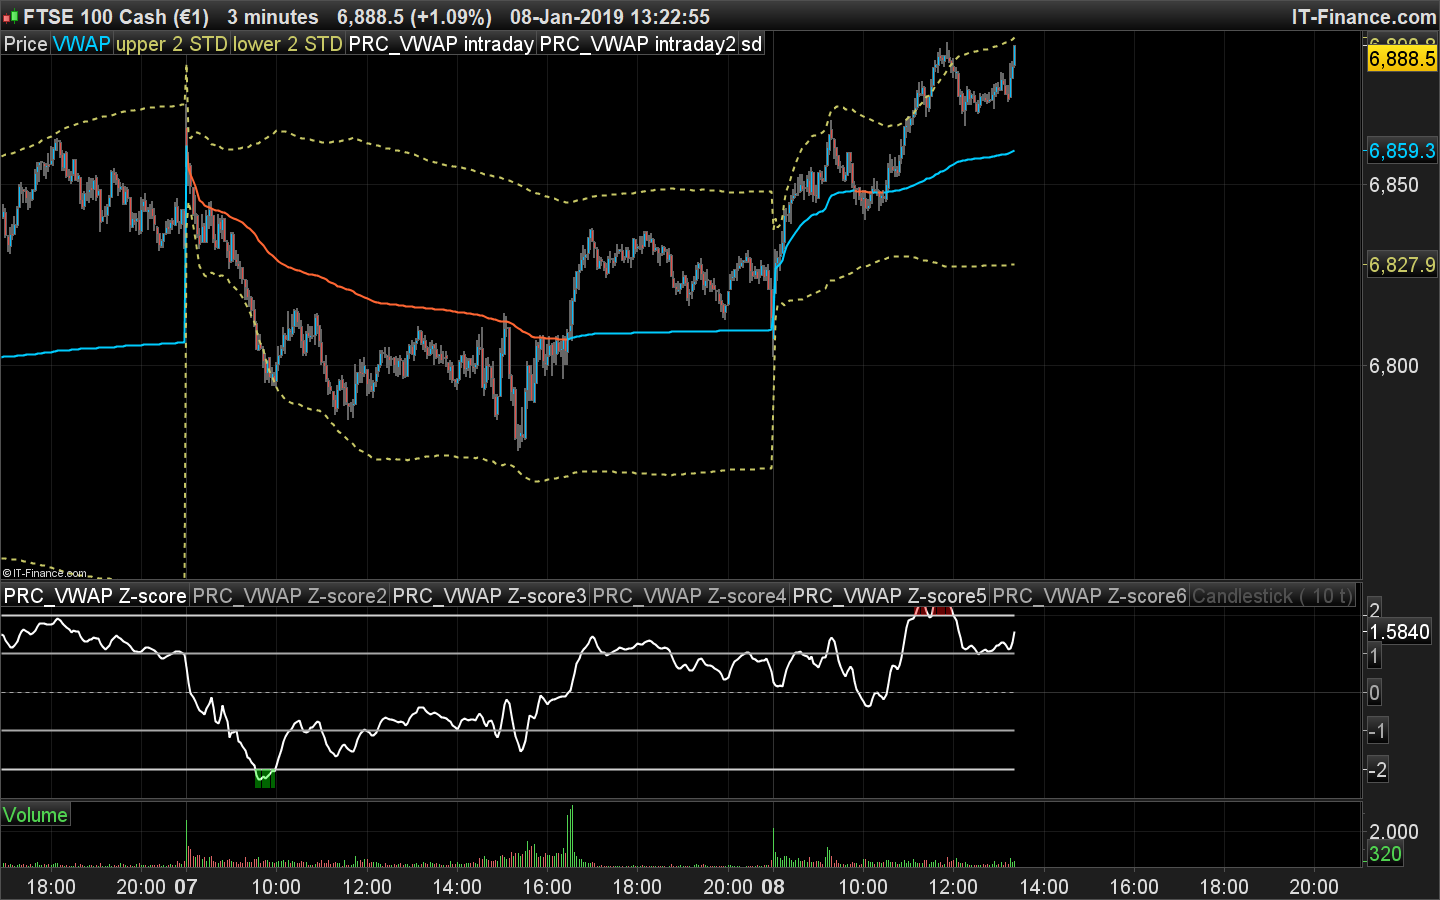
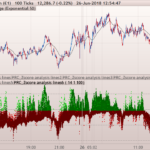
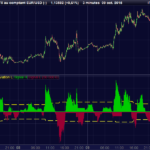
In this indicator, the Z-Score distance is the current standard deviation from the intraday VWAP of the price.
If the exceed a certain deviation (such as 2 standard deviation), the indicator highlight an oversold or overbought area from which the price could tend to return to its mean, the VWAP.
The VWAP is the Volume Weighted Average Price, in this indicator it is compute only for intraday trading because it resets its own value on each new day.
I included a minimal period setting for the calculation of the standard deviation (default period is 100), as soon as 100 bars have elapsed the SD is calculated with the summation of all present bar during the day (such as the VWAP does too), and a smoothing function for the curve (not used by default).
//PRC_VWAP Z-score
//08.01.2019
//Nicolas @ www.prorealcode.com
//Sharing ProRealTime knowledge

// --- settings
SDminPeriod = 100 //minimal period to compute the Standard Deviation
smoothZscore = 0 //smooth the curve? (0=false ; 1=true)
// --- end of settings

d = max(2,intradaybarindex)//max(1, intradaybarindex)
if intradaybarindex=0 then
 vwap = (volume*customclose)/(volume)
else
 VWAP = SUMMATION[d](volume*customclose)/SUMMATION[d](volume)
endif

sd = SUMMATION[max(SDminPeriod,d)](max(abs(high-vwap),abs(vwap-low)))/max(SDminPeriod,d)

if smoothZscore then
 zscore=average[3]((close-vwap)/sd)
else
 zscore = (close-vwap)/sd
endif

if zscore>=2 then
 drawcandle(2,2.5,2,2.5) coloured(255,0,0,100) bordercolor(0,0,0,0)
endif
if zscore<=-2 then
 drawcandle(-2,-2.5,-2,-2.5) coloured(0,255,0,100) bordercolor(0,0,0,0)
endif

RETURN zscore style(line,2), 1 coloured(168,168,168) style(line,2), 2 coloured(210,210,210) style(line,2), -1 coloured(168,168,168) style(line,2), -2 coloured(210,210,210) style(line,2), 0 coloured(168,168,168) style(dottedline)
Comments
You must be logged in to post a comment.

Merci nicolas, j'ai déjà pris cette version et en plus je suis sur les futures. Par contre du coup je viens de l'installer sur CFD (PRT V10.3) et là je n'ai pas le bug ... Ca vient donc de la V11 sur Future et c'est de ma faute car vous indiquiez bien que c'était pour la V10.3 ... J'essayerai de chercher pourquoi mais en attendant je vais le laisser sur la 10.3 ! Merci
Bonjour, je suis tombé sur cet indicateur par des recherches sur les écarts types et il me semble réellement excellent. Il donne une "information" nouvelle vis à vis d'autres indicateurs. Le seul soucis c'est qu'il s'affiche la première fois (je vois bien la courbe) mais disparait à chaque nouvelle bougie (ie minute si UT1, 5 minute si UT5). Pour le faire réapparaitre il suffit que je modifie la période par exemple ce qui le fait se recalculer et s'afficher. Si je comprends le problème je ne vois pas pourquoi il y en a un et encore moins comment le résoudre ... Merci par avance, Arnaud

Bonsoir Nicolas, Merci pour cet indicateur. Même s'il n'y a officiellement pas de volume sur les CFD, le Vwap est quand même calculé et apparait sur les charts CFD type Dax UT 15 (en Daily - et même sur des unités de temps plus petites - 60 min par exemple). Très instructif ! En revanche, cet indicateur VWAP - Z score est sûrement bien pratique, mais il n'apparait pas. Serait-il possible de lui permettre d'être utilisable aussi avec des CFD ? Merci. :) Bon début de semaine.

Thank you!
why doesn´t work on Dax?

hi nicolas, when im making a strategy out of this i get the error "PRC_VWAP z-score" called from "vwap z-score" returns 6 values but your code needs 7. how can i fix this?