Finite Volume Element (FVE)

Finite Volume Element (FVE)

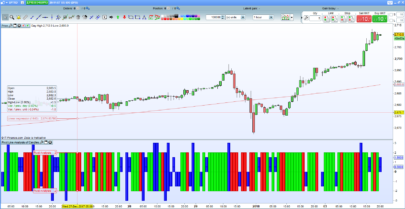
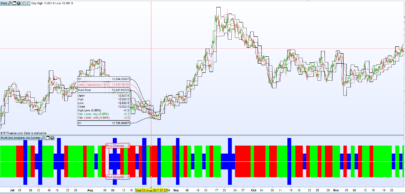
FVE is a money flow indicator but with two important differences from existing money flow indicators:

It resolves contradictions between intraday money flow indicators (such as Chaikin’s money flow) and interday money flow indicators (like On Balance Volume) by taking into account both intra- and interday price action.
Unlike other money flow indicators which add or subtract all volume even if the security closed just 1 cent higher than the previous close, FVE uses a volatility threshold to take into account minimal price changes.
The FVE provides 3 types of signals:

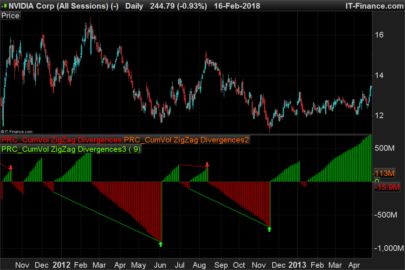
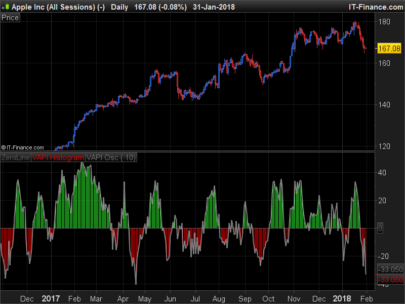
The strongest signal is divergence between price and the indicator. Divergence can provide leading signals of breakouts or warnings of impending corrections. The classic method for detecting divergence is for FVE to make lower highs while price makes higher highs (negative divergence). An alternative method is to draw the linear regression line on both charts, and compare the slopes. A logical buy signal would be for FVE, diverging from price, to rise sharply and make a series higher highs and/or higher lows.
The most obvious and coincident signal is the slope of the FVE line. An upward slope indicates that the bulls are in control and the opposite for downward.
This is a unique and very important property of this indicator. Values above zero are bullish and indicate accumulation while values below zero indicate distribution. FVE crossing the zero line indicates that the short to intermediate balance of power is changing from the bulls to the bears or vice versa. The best scenario is when a stock is in the process of building a base, and FVE diverges from price and rises to cross the zero line from below, at a sharp angle. Conversely the crossing of the zero line from above is a bearish signal to liquidate positions or initiate a short trade.

Parameters

FVE period (p = 22)

Share this

Risk disclosure:

No information on this site is investment advice or a solicitation to buy or sell any financial instrument. Past performance is not indicative of future results. Trading may expose you to risk of loss greater than your deposits and is only suitable for experienced investors who have sufficient financial means to bear such risk.

ProRealTime ITF files and other attachments : How to import ITF files into ProRealTime platform?

PRC is also on YouTube, subscribe to our channel for exclusive content and tutorials

avatar
Register or

Likes

avatar avatar avatar avatar
Related users ' posts
Matt B RolanBay, L'ellipse apparaît-elle à la bougie notifiée et reste ?
gianlucapegaso scusa Gagry ma il programm da copiare è quello con tutte le modifiche di cui ho letto nei va...
Valentinocorse bonjour a tous , superbe travail j'aimerai si possible une indication pour modifier l'indic...
GraHal Is this the Discussion Topic you need @Gregg https://www.prorealcode.com/topic/scalping-i...
bertrandpinoy bonjour Nicolas y a t il une possibilité de signal sonore dès qu une vente ou un achat serai...
Nicolas Oui cela nécessitera une adaptation du code cependant, merci de formuler une demande sur le ...
Nicolas Oui pourquoi pas? :)
claudiofred Bonjour Nicolas, merci encore pour ce super indicateur. se demander s'il est possible d'écr...
Nicolas Screener déjà présent sur le forum ici: https://www.prorealcode.com/topic/indicador-lastmans...
Nicolas Your picture is too small, but for sure the problem is about the fact you are still using v1...
Rory Dryden Thanks. This looks useful.
Edelmiro Un millón... de gracias... me gustaría más, poder ofrecer euros; pero va a ser que no puedo,...
swapping Oups nicolas ! je pense que tu a oublié de mettre les variables "setting" accessible en exte...
Nicolas Je viens de vérifier, elles y sont pourtant?
swapping Mea culpa, j'ai fait un bête (copier/coller) et forcément cela ne pouvait pas y être puisqu'...
rb-72 Thank you, area of twist by dilatacion of the price, missing part of the code that is not pu...
Thomas007 after reading your blog now I understand why there is only a part of your code here. I'm try...
Juanjo Hola¡¡ la estrategia se podria aplicar sobre acciones con marco temporal diario?? gracias.
Marcel If you are interested in my way of trading, please follow me on Twitter @MvvTrading
Genotik Excellent, merci !
diegofe_2000 Excelente indicador, felicitaciones, muy bueno
Van Salt Hi Bianca, the indicator shows you some interesting cluster-zones from long- and shortterm f...
Vinci1966 Questo indicatore è molto interessante. Mi sono permesso di apportare alcune modifiche nell'...
Vinci1966 // VAN SALT´s <> Version 20171105 // This Indicator draws the Shortterm and Longtern ...
Jessar Hello, could you tell me how to use this indicator? I think the simplest things can still be...
Nicolas Please open a new forum topic, and respect the posting rules. Add a precise description of w...
FXTT ok will do, apologies, as I said I am new here. many thanks
Noobywan Version v2 including requested additions: https://www.prorealcode.com/prorealtime-indicators...
Nicolas
8 years ago
Genotik Merci !
Vinks_o_7 I looked at your page: It's written: Method 2: Current High less the previous Close (absolu...
gabri You are right, I will change it, Thank you!!
Vinks_o_7 Nope...I THANK YOU FOR ALL THE GOOD WORK YOU DID ;-)
WarningTrading Comment peut on la comparer ? comme ceci ? cela ne me donne plus le message d'erreur manque...
sally31120 Bonjour, je n'arrive pas à créer ce screener close > supertrend extended2[1] la réponse...
Nicolas voir ce sujet pour un screener basé sur Supertrend Extended: https://www.prorealcode.com/top...
crolakstrading Hi Nicolas.. I'm really big fan of this indicator! is there any possibility to make this ind...
Nicolas Yes, that's possible. Please open a new topic in the forum.
crolakstrading Just saw your reply thank you!! I will open up a new topic!!
gabri Agree. Many of those indicators are using very similar ideas. ADX is a very powerful and und...
Marcel But still it is a (lagging) derivation of price itself.
gabri All the indicators are lagging because they are all based on historical data.
Trading_En_El_Ibex35 Para calcular el punto pivote y los niveles de soporte y resistencia para operar durante la ...
supertiti Hola mis disculpas, creia que tu eres Jose Antonio Madrigal ! gracias por las explicaci...
Trading_En_El_Ibex35 espero que las explicaciones te hayan sido de ayuda saludos
TAC Bolsa This indicator give trading signals depending of the crosses of overbought and oversold area...
Juanjo Hola. El indicador es válido para acciones en periodo diario? Gracias
TAC Bolsa Hola Juanjo la información del indicador y otros la puede encontrar en el BLog. https://w...
rb-72 5 Minutes, 15 Minutes, The most effective 1 Hour below 0 or above 0 as a turn signal in the ...
Andraxx Interpretación de el indicador??? Gracias
TAC Bolsa Oscilador que hace una medición ponderara basado en la distancia entre precio y una media Mó...
JohnScher indicators i did fond, no problem, but a basic code to trade maybe RSI divergence didn´t fou...
Daniel3987 Please how do I add the prc candle strength to my mt5 on an iPhone
Nicolas You can't, this indicator is made to be used with prorealtime trading platform.
Kolle I don't know but i am doing something wrong but obvious to others. I download this indicator...
Nicolas Change the price scale to use "price only".
Kolle Hi. Thank you so much for helping out Nicolas. At last i found where to set the configurati...

Top