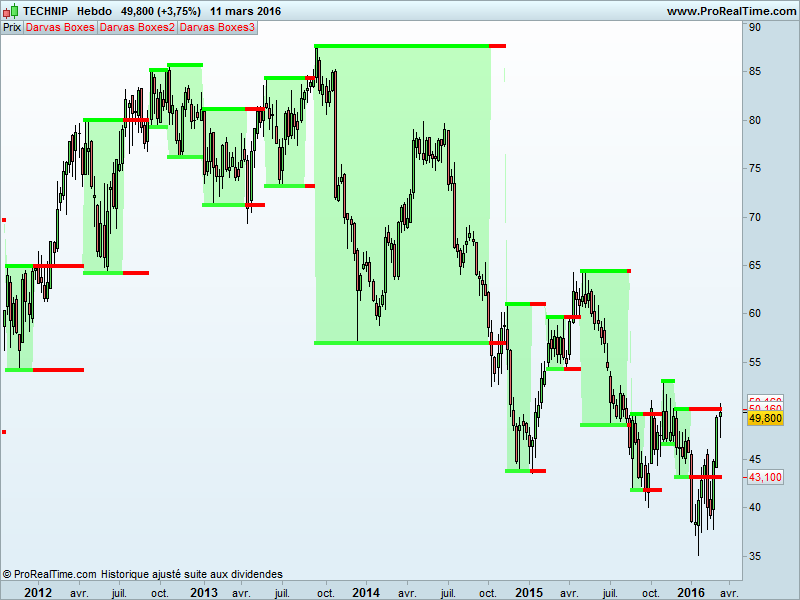
Back in the fifty, Nicolas Darvas was a wall-street personality. He used his boxes method, for automatic entry and stoploss, and made a fortune ..
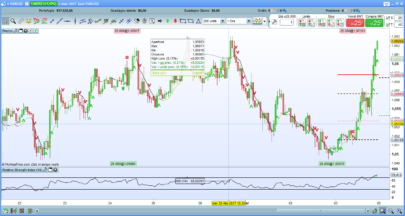
Darvas identified the high of a box file once that action had not reached a high after three consecutive days and ditto for the lower limit, no new low after 3 consecutive days. Other criteria were also considered to constitute an input point.
But each overflow of the high limit once he was in position, he made a new entry with new add orders. The stop was always placed on the lower limit of the box
Warning from “hk-lisse” on his blog:
- Indicator introduce a bullish bias because to form a new box, we always start to draw it from the top
- The code make use of future price that are not known at present time
1234567891011121314151617181920212223242526272829303132333435363738394041424344454647484950515253545556rem from hk_lisse blogk=48once tth=undefinedonce ttl=undefinedn=(k*2)-4p=(n/2)-1h1=dpo[n](high)moyh=high-h1hi=(moyh-moyh[1]+(high[p])/n)*nhi=(round(hi*100))/100l1=dpo[n](low)moyl=low-l1lo=(moyl-moyl[1]+(low[p])/n)*nlo=(round(lo*100))/100low1=(round(low*100))/100high1=(round(high*100))/100if barindex > 100 thenif box=1 and (high1>tth or low1<ttl) thenbox=0flag=0endifif box=0 and flag=0 and high1>=hi[46] and high1>=hi[45] and high1>=hi[44] thenth=high1flag=1endifif box=0 and flag=1 thenfor zz=0 to 44if hi[47-zz-1]>th or hi[47-zz-2]>th or hi[47-zz-3]>th thenflag=0breakendifif lo[47-zz]<lo[47-zz-1] and lo[47-zz]<lo[47-zz-2] and lo[47-zz]<lo[47-zz-3] thenbox=1tth=thttl=lo[47-zz]breakendifnextendifelsetth=undefinedttl=undefinedendifif box=1 thenba=ttlelseba=tthendifif box=1 thencol=1elsecol=-1endifreturn ba coloured by col , tth coloured by col,ttl coloured by col
For drawing purpose : add a fill color between the 1 and 2 return values.
Set the first one in points, the second and third one in large points.
Share this
No information on this site is investment advice or a solicitation to buy or sell any financial instrument. Past performance is not indicative of future results. Trading may expose you to risk of loss greater than your deposits and is only suitable for experienced investors who have sufficient financial means to bear such risk.
ProRealTime ITF files and other attachments :
Find other exclusive trading pro-tools on ![]()
PRC is also on YouTube, subscribe to our channel for exclusive content and tutorials


hi how do i place this code on the chart itself? the site only allows me to write the code only when i click the indicator box but then this indicator shows below the chart !!
if i click the wranch tool it doesnt open the code writing page !!
another thing i wanted to ask is – i have another code for darvas box but i cant insert it into the site it wont eccept it
can u help me with solving what is wrong with the code
n=4
h=highest[n]
l=lowest[n]
once b=2
v=h
if h=high[n-1] and high[n-1] > high and high[n-1] > low and {b = 1 or b = 2 } then
v=h
b=0
else
if l = low[n-1] and low[n-1] < low and low[n-1] < high and { b = 0 or b = 2 } then
v = 1
b = 1
else
v = v[1]
endif
endif
return v
hi sorry …i got it i pasted your indicator so it went into the site list of indicators then i clicked on the wranch of the price chart and added it on the chart so i see it on the price chart now but how do i paint it
and can you help me with my code ?
thanks
Thanks so much for sharing this excellent strategy! In my PRT 2.0 version it fits best when Box > Box3 and is sold when Box3 >= Box. The results are unbelievable! Thank you so much!
PRT says, that “the instruction “DPO” can not be used in the automated trading mode. What does that mean, guys? Unfortunately by that I can’t use it. Does anyone know what this means?
Hi – I find the Darvas box repaints, making the call to buy/sell unreliable. How can repainting be prevented? The issue occurs on all time scales.
https://www.prorealcode.com/topic/dpo/
Results: http://thepatternsite.com/Darvas.html