Volatility breakout indicator

v10.3
Volatility breakout indicator

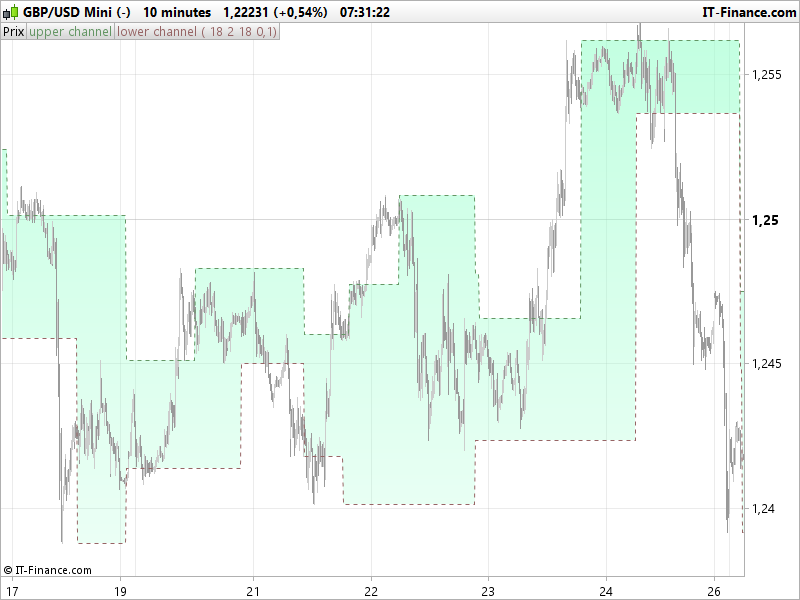
The Volatility Cycle Breakout indicator draws range boxes overlaid on the price chart. The upper and lower side of the boxes are made from recent Fractals. New boxes will be drawn only if the volatility is weak and if the new fractals discovered are far enough from the current upper and lower ones.

The volatility cycle is extracted from Bollinger Bands (InpBandsPeriod=18 is the bands period). Original indicator is here: Volatility Cycle

Fractals lookback periods can be adapted to catch new fractals far in the history or near of the current price (cp=10).

The “change” variable is the percent variation needed to change the support and resistance levels of the boxes (0.1% seems to work fine for intraday timeframes on forex pairs for instance). This setting is important because it will reduce the noises of “moving boxes” each time new Fractals are discovered, specially when price is ranging. It results perfect range boxes on price to play mean reversion strategy when price is not moving enough to make real breakout.

Original concept (modified since) come from a topic in French forum.

All ideas are welcome and could result in new good indicators, don’t hesitate to post them in forums!


Share this

Risk disclosure:

No information on this site is investment advice or a solicitation to buy or sell any financial instrument. Past performance is not indicative of future results. Trading may expose you to risk of loss greater than your deposits and is only suitable for experienced investors who have sufficient financial means to bear such risk.

ProRealTime ITF files and other attachments : How to import ITF files into ProRealTime platform?

PRC is also on YouTube, subscribe to our channel for exclusive content and tutorials

  1. ghary • 03/15/2017 #

    Bonjour,
    Bravo Nicolas pour l’indicateur, est il possible d’en sortir un screener ?
    Merci

  2. Marius • 03/15/2017 #

    Hi Nicolas,
    thanks a lot for you contribution here. I never learned scripting, so I am dependend on guys like you who share their work, so thanks again. I would like to know if its´complicated to code something similar to Bollinger Bands, but formed out of two moving averages. It would be great if the colour of the sma or ema “cloud” could change, once the moving averages cross. I am a long time dreamer of such a cloud in the price field, where I can  chose  ema or sma and the number of them (20,50,34, whatever). Or does such indicator already exist in PRT? I searched a lot but could not find anything.

    • Nicolas • 03/15/2017 #

      Hi Marius, for new indicator code request, please use the ProBuilder forum instead! : https://www.prorealcode.com/forum/prorealtime-english-forum/probuilder-support/
      Thanks a lot.

  3. ghary • 03/15/2017 #

    Bonjour Nicolas 
    l’idee du screener serait de sortir les actifs dont le prix se situerait à l’intérieur de la boxe lors de la baisse de la volatilité afin de préparer la sortie à la hausse ou à la baisse. 
    Je ne sais pas si cela est assez clair. 

    • Nicolas • 03/15/2017 #

      Oui bien sûr, il faudrait créer une demande spécifique dans le forum dédié à ProBuilder, merci.

  4. ghary • 03/15/2017 #

    Bonjour 
    c’est fait j’ai mis la demande dans le forum français pro screener, c’est bien la qu’il fallait ouvrir le tropic ? 
     
    Merci encore pour le travail. 
     

  5. Francesco78 • 03/15/2017 #

    Thank you Nicolas, 
    I have copied your nice indicator, but it shows in the lower part of the chart instead of overlapping the price chart.
    What am I missing?
    Many thanks
    Francesco 

  6. Abz • 03/15/2017 #

     hi , you need to add the indicator from the “price” menu in chart

  7. Francesco • 03/15/2017 #

    Thank you Abz!

  8. phanz • 03/15/2017 #

    Hi Nicolas, this is an interesting strategy. For long position, I assume entry when prices crosses over the upper band. For exit, do you recommend prices crosses under the upper band, or prices crosses under the lower band? What’s your thoughts?

avatar
Register or

Likes

avatar avatar avatar avatar avatar avatar avatar avatar avatar avatar avatar avatar avatar avatar avatar avatar

+7 more likes

Related users ' posts
kats Bonsoir, cet indicateur est vraiment très bien avec plusieurs possibilités en coloration . ...
roccafragius Thank you Ivan for your indicators, very very interesting!!!!
Gaspare Ciao Ivan si puo' inserire una strategia su questo indicatore per ottimizzare le variabil...
Fgats https://www.prorealcode.com/topic/indicateur-3-sigma-documentation/ lien pour la documentat...
DELBERT Bonjour , merci pour le partage et la traduction , je vais essayer d'assimiler ce nouvelle i...
jacquesgermain sì da aggiungere
Maik2404 auf welchen Wert muss ich die Kompresionsperiode stellen?
jacquesgermain — Période de compression : ce paramètre détermine la période de rétrospection utilisée pour ...
Fgats
6 months ago
bousalahane hello, thank you for sharing, I’m not top strong in the programation part, there is a way to...
Fgats Hi, With this indicator I just wanted to show the interest that can exist to synthesize th...
davidguerreir how to adapt nbStdSig values ?
FXtonio @RICOU en 1 minutes avec un filtre de tendance ZLSMA 200 et eventuellement un rsi 7 , 69% de...
JC_Bywan For people interested in the screener: https://www.prorealcode.com/topic/screener-buy-sell-m...
octum Gracias NJicolas. Las lineas 35 y 36 dan fallo. (¿Es adrede para iniciados?) Puedes co...
geroniman bonjour si je comprends bien, qaund els points sont verts on regarde pour un long, le blanc ...
Alfy No, the dots only show the compression of the volatility. There are 3 levels of "squeeze" wh...
ted.hulsman Hi Alfy, I'm trying to understand your indicator, so I made the Bollinger Bands and the Kelt...
AndPar Buongiorno Nicolas, vorrei provare questo indicatore, ma quando lo inserisco in PRT mi vengo...
Nicolas Basta aggiungerlo al prezzo https://www.prorealcode.com/blog/video-tutorials/how-to-add-an-i...
Aragorna hello Nicolas, this indicator works with the last Beta version of PRT? Ive seen tha many in...
SnorreDK Works extremely well - How? How do u implement this in a startegy? Breakoutstrategy?
Keyeming Thanks, but yes same question as above, some explanations on how to read it would be appreci...
Bateson Bonjour. Merci beaucoup ! J'ai installé l'indicateur sur PRT 11 mais pour des raisons qui ...
Sever
2 years ago
CederTrader Hi Denis, does this indicator add to the chart as panel, or on the candles. Thanks
Nicolas Add it on the price chart as described in this video: https://www.prorealcode.com/blog/video...
Denis Hello Nicolas and Ceder Trader, Sorry, I only just saw your replies. The indicator is alre...
bab el franco hello once installed I have no results despite different options of markets or temporality
RubberToe Is there something we are missing here, I just get the same curved line as well...
Khaled @Nicolas, Hi Nicolas, I've downloaded the itf and it doesn't display as an Oscillator, it"s ...
sal157011 I think the problem here is that you must feed the trigonometric functions cos and sin with ...
Nicolas Sorry there was a small issue in the code, i have changed the attached itf file and updated ...
Mitchy14 Hi Nicholas, apologies, I am usually fairly good at implementing your creations (for which I...
Nicolas Are you using PRT version pre-v11? TIMEFRAME for indicators is possible since months for pro...

Top