







Darvas Boxes
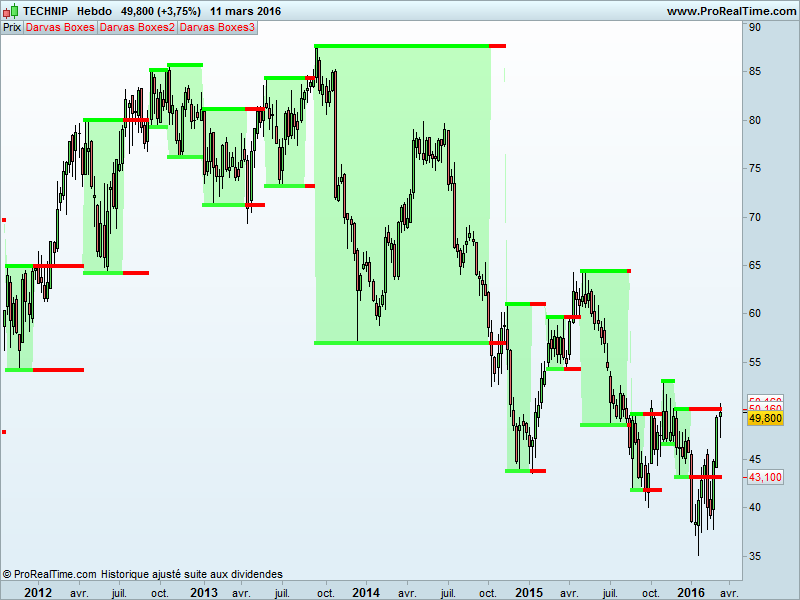
Back in the fifty, Nicolas Darvas was a wall-street personality. He used his boxes method, for automatic entry and stoploss, and made a fortune ..
Darvas identified the high of a box file once that action had not reached a high after three consecutive days and ditto for the lower limit, no new low after 3 consecutive days. Other criteria were also considered to constitute an input point.
But each overflow of the high limit once he was in position, he made a new entry with new add orders. The stop was always placed on the lower limit of the box
Warning from “hk-lisse” on his blog:
- Indicator introduce a bullish bias because to form a new box, we always start to draw it from the top
- The code make use of future price that are not known at present time
rem from hk_lisse blog
k=48
once tth=undefined
once ttl=undefined
n=(k*2)-4
p=(n/2)-1
h1=dpo[n](high)
moyh=high-h1
hi=(moyh-moyh[1]+(high[p])/n)*n
hi=(round(hi*100))/100
l1=dpo[n](low)
moyl=low-l1
lo=(moyl-moyl[1]+(low[p])/n)*n
lo=(round(lo*100))/100
low1=(round(low*100))/100
high1=(round(high*100))/100

if barindex > 100 then
 if box=1 and (high1>tth or low1<ttl) then
  box=0
  flag=0
 endif
 if box=0 and flag=0 and high1>=hi[46] and high1>=hi[45] and high1>=hi[44] then
  th=high1
  flag=1
 endif
 if box=0 and flag=1 then
  for zz=0 to 44
   if  hi[47-zz-1]>th or hi[47-zz-2]>th or hi[47-zz-3]>th then
    flag=0
  break
  endif
  if lo[47-zz]<lo[47-zz-1] and lo[47-zz]<lo[47-zz-2] and lo[47-zz]<lo[47-zz-3] then
   box=1
   tth=th
   ttl=lo[47-zz]
  break
  endif
 next
endif
else
  tth=undefined
  ttl=undefined
 endif
  if box=1 then
   ba=ttl
  else
   ba=tth
  endif
  if box=1 then
   col=1
  else
   col=-1
  endif

return ba coloured by col , tth coloured by col,ttl coloured by col
For drawing purpose : add a fill color between the 1 and 2 return values.
Set the first one in points, the second and third one in large points.
Comments
You must be logged in to post a comment.


PRT says, that "the instruction "DPO" can not be used in the automated trading mode. What does that mean, guys? Unfortunately by that I can't use it. Does anyone know what this means?
Thanks so much for sharing this excellent strategy! In my PRT 2.0 version it fits best when Box > Box3 and is sold when Box3 >= Box. The results are unbelievable! Thank you so much!

hi how do i place this code on the chart itself? the site only allows me to write the code only when i click the indicator box but then this indicator shows below the chart !!
if i click the wranch tool it doesnt open the code writing page !!
another thing i wanted to ask is - i have another code for darvas box but i cant insert it into the site it wont eccept it
can u help me with solving what is wrong with the code
https://www.prorealcode.com/topic/dpo/ Results: http://thepatternsite.com/Darvas.html