







SuperTrend adaptive periods (r-squared)
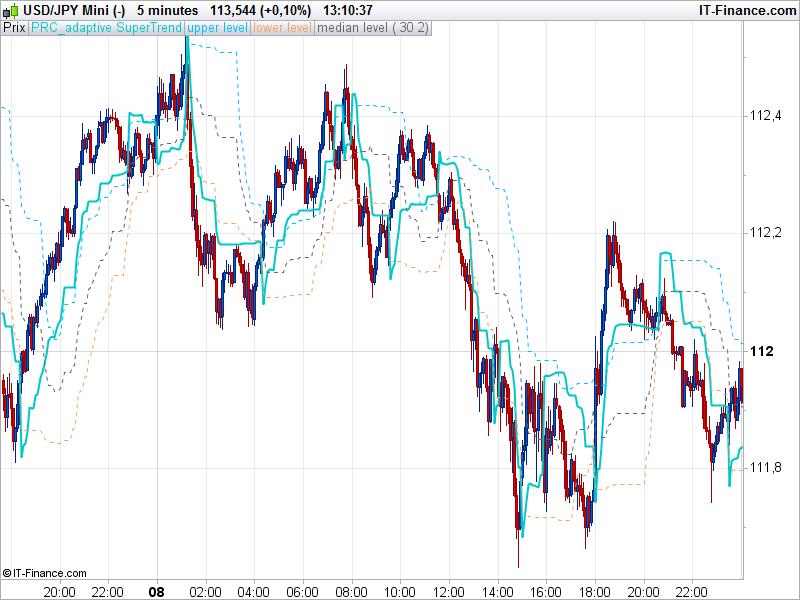
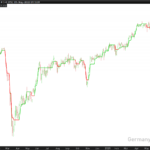
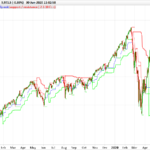
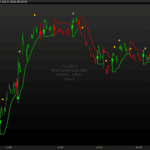
New SuperTrend indicator version made of adaptive periods with comparison made from the coefficient of determination / average of the least squares.
The adaptive formula makes the SuperTrend more reactive to the little fluctuation of the market while still doing what it is supposed to do: be a trend following indicator.
Another great idea of this indicator is to draw “floating levels” above or below the SuperTrend which are calculated with percentage of the highest and lowest values of the SuperTrend within the last Y “flLookBack” periods. These floating levels could act as filter to detect / prevent false trend reverse.
The adaptive function code of this indicator can be use in many other indicators and new original concept, I suppose I’ll post more of them into the library in the future days/weeks.
Another indicator made of this kind of adaptive periods if the r-squared adaptive exponential moving average already posted in the prorealtime code library here.
//PRC_adaptive SuperTrend (r-square method) | indicator
//10.02.2017
//Nicolas @ www.prorealcode.com
//Sharing ProRealTime knowledge

// --- parameters
// Period = 20
// mult = 2
// ---

Data = customclose
//Period = 20

SumX  = 0
SumXX = 0
SumXY = 0
SumYY = 0
SumY  = 0

if barindex>Period then

// adaptive r-squared periods
for k=0 to period-1 do
 tprice = Data[k]
 SumX  = SumX+(k+1)
 SumXX = SumXX+((k+1)*(k+1))
 SumXY = SumXY+((k+1)*tprice)
 SumYY = SumYY+(tprice*tprice)
 SumY  = SumY+tprice
next

Q1  = SumXY - SumX*SumY/period
Q2  = SumXX - SumX*SumX/period
Q3  = SumYY - SumY*SumY/period

iRsq=((Q1*Q1)/(Q2*Q3))

avg = supertrend[mult,round(Period+Period*(iRsq-0.25))]

//floating levels
flLookBack      = 25 // Floating levels lookback period
flLevelUp       = 90 // Floating levels up level %
flLevelDown     = 10 // Floating levels down level %
mini   = lowest[flLookBack](avg)
maxi   = highest[flLookBack](avg)
rrange = maxi-mini
flu    = mini+flLevelUp*rrange/100.0
fld    = mini+flLevelDown*rrange/100.0
flm    = mini+0.5*rrange

endif

RETURN avg coloured(0,200,200) STYLE(line,2), flu coloured(0,191,255) STYLE(dottedline,1) as "upper level", fld coloured(244,164,96) STYLE(dottedline,1) as "lower level", flm coloured(100,100,100) STYLE(dottedline,1) as "median level"
Comments
You must be logged in to post a comment.

Everything here is free, I do not sell anything and "tell people what they like to hear", I'm sorry you are thinking that. There are many more other websites where you could make this kind of remark but I don't think it is really adapted here, because I spent all days answering any kind of questions on forums and code for free any queries to help people without asking nothing. I encourage no one to use my code or whatever others made by people who are willing to share their work with the community. If you can't stand what you read here, please move on to another place. I still don't have understood your comment about the place where I live and work.. Anyway, I have no time for trolls but I'm pleased you "still learn valuable things from your website".
What is the use of this indicator ? When I use in my supertrend systems, with comparable parameters für period and mult, it starts wildly bouncing around the price. I get enormous and very fast fluctuations that destroy any trend following capabilities. On the other hand, when the parameter mult is increased enough to stop these fluctuations for most of the time, I see no advantage to the normal supertrend. Usually, it is not a good idea to change the period length within a supertrend while it is being calculated. The reason is that the size of ATR, with which the supertrend is calculated, varies with the period length. So, when you compare a supertrend, say with period 8 and with period 10 and the same mutiplier mult, in one case the supertrend may be above the price and in the other case below the price. When the periods are constantly changed, you will get a supertrend that bounces around the price instead of showing clear uninterrupted trends.
That's why there is no color on this version of the supertrend instead of the normal one. Even if price is jumping above or below the supertrend, it doesn't mean that the trend is actually changing, percentile floating levels "could act as filter to detect / prevent false trend reverse." . This indicator is a concept: use correlation with a r-squared line to adapt the period of the indicator, it results in a supertrend more versatile, but also change the way we are using it usually, I totally agree. Thanks for your feedback!


Ok Nicolas, il didn't know it was a translation of a mt4 code (May be indicate it in your text)
Something who could be more interesting if to you use the same idea but with the Hurst exponent (correlate more with the trend than the r2 who correlate with LR). It exists on mt4 not on prt if I remember.
http://www.greattradingsystems.com/indicators/hurst-exponent-indicator-for-mt4/
Have a nice sunday and thanks
Zilliq
Thanks Nicolas for this great work! I would like to understand the math behind it in order to convert it to Python code.