

Wing's Trend Line Bands - (Support and Resistance)
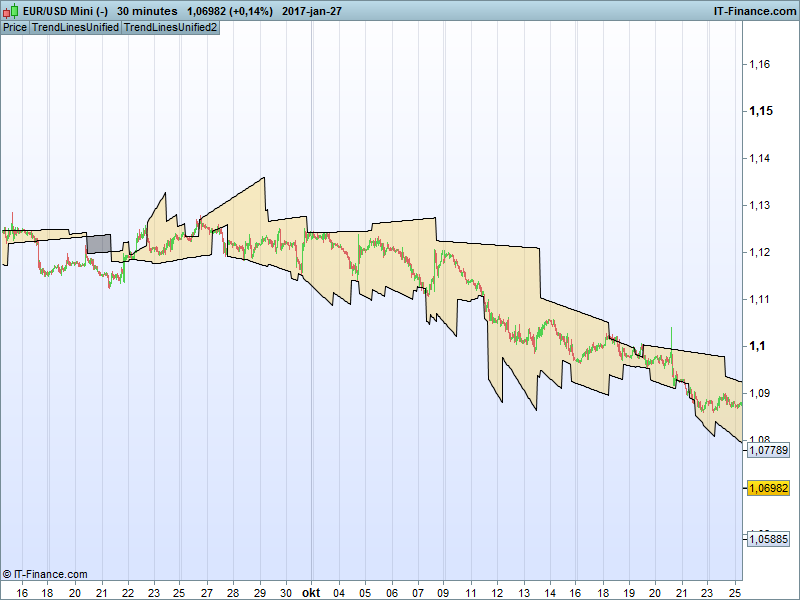
Wing’s Trend Line Bands – (Support and Resistance)
This is an unconventional indicator I have created in PRT 10.2. I have not seen anything similar.
It calculates twelve different trend lines, six that resemble levels of support and six that resemble levels of resistance. They are then averaged into two trend lines, to form a band around the price. The ‘band’ does not behave like for example a bollinger band. Trend Line Bands are more dynamic since they are drawn between different high/low points, and are therefore, straight.
How to trade:
Appropriate timeframe, security and system is for you to find. Remember that this indicator is experimental and can be developed in many ways. Trend Line Bands can be traded in at least three ways that I have found:
- Mean reversion (price bouncing on the bands)
- Breakout (decisive move through a band)
- Band convergence (The algorithm can output a line of support ABOVE the line of resistance. This is a sign of upcoming trend reversal and should not be traded in the ways mentioned above.)
////////////////////////////////////////////////////
//
// Wing's Trend Line Bands - (Support and Resistance)
//
// Made by user "Wing" of ProRealCode.com
// https://www.prorealcode.com/user/wing/
//
//////////////////////////////////////////////////
//
// Parameter:

p = 7

//////////////////////////////////////////////////


rs=RSI[p]


once t1=0
once t2=0
once t3=0
once t4=0

once b1=0
once b2=0
once b3=0
once b4=0


once top=0

if rs[4]>70  and high[4]>high[3] and high[4]>high[2] and high[4]>high[1] and high[4]>high and top=0 then
t4=t3
t3=t2
t2=t1
t1=barindex-4
top=6
endif

if rs[4]<30  and low[4]<low[3] and low[4]<low[2] and low[4]<low[1] and low[4]<low and top=0 then
b4=b3
b3=b2
b2=b1
b1=barindex-4
top=6
endif

if top>0 then
top=top-1
endif

// tops

if high[barindex-t2]>high[barindex-t1] then
linet1=high[barindex-t2]-(((barindex-t2)*sqrt(square(high[barindex-t1]-high[barindex-t2])))/(t1-t2))
else
linet1=high[barindex-t2]+(((barindex-t2)*sqrt(square(high[barindex-t1]-high[barindex-t2])))/(t1-t2))
endif

if high[barindex-t3]>high[barindex-t2] then
linet2=high[barindex-t3]-(((barindex-t3)*sqrt(square(high[barindex-t2]-high[barindex-t3])))/(t2-t3))
else
linet2=high[barindex-t3]+(((barindex-t3)*sqrt(square(high[barindex-t2]-high[barindex-t3])))/(t2-t3))
endif

if high[barindex-t3]>high[barindex-t1] then
linet21=high[barindex-t3]-(((barindex-t3)*sqrt(square(high[barindex-t1]-high[barindex-t3])))/(t1-t3))
else
linet21=high[barindex-t3]+(((barindex-t3)*sqrt(square(high[barindex-t1]-high[barindex-t3])))/(t1-t3))
endif

if high[barindex-t4]>high[barindex-t1] then
linet3=high[barindex-t4]-(((barindex-t4)*sqrt(square(high[barindex-t1]-high[barindex-t4])))/(t1-t4))
else
linet3=high[barindex-t4]+(((barindex-t4)*sqrt(square(high[barindex-t1]-high[barindex-t4])))/(t1-t4))
endif

if high[barindex-t4]>high[barindex-t2] then
linet31=high[barindex-t4]-(((barindex-t4)*sqrt(square(high[barindex-t2]-high[barindex-t4])))/(t2-t4))
else
linet31=high[barindex-t4]+(((barindex-t4)*sqrt(square(high[barindex-t2]-high[barindex-t4])))/(t2-t4))
endif

if high[barindex-t4]>high[barindex-t3] then
linet32=high[barindex-t4]-(((barindex-t4)*sqrt(square(high[barindex-t3]-high[barindex-t4])))/(t3-t4))
else
linet32=high[barindex-t4]+(((barindex-t4)*sqrt(square(high[barindex-t3]-high[barindex-t4])))/(t3-t4))
endif

// bots

if low[barindex-b2]>low[barindex-b1] then
lineb1=low[barindex-b2]-(((barindex-t2)*sqrt(square(low[barindex-b1]-low[barindex-b2])))/(b1-b2))
else
lineb1=low[barindex-b2]+(((barindex-b2)*sqrt(square(low[barindex-b1]-low[barindex-b2])))/(b1-b2))
endif

if low[barindex-b3]>low[barindex-b2] then
lineb2=low[barindex-b3]-(((barindex-b3)*sqrt(square(low[barindex-b2]-low[barindex-b3])))/(b2-b3))
else
lineb2=low[barindex-b3]+(((barindex-b3)*sqrt(square(low[barindex-b2]-low[barindex-b3])))/(b2-b3))
endif

if low[barindex-b3]>low[barindex-b1] then
lineb21=low[barindex-b3]-(((barindex-b3)*sqrt(square(low[barindex-b1]-low[barindex-b3])))/(b1-b3))
else
lineb21=low[barindex-b3]+(((barindex-b3)*sqrt(square(low[barindex-b1]-low[barindex-b3])))/(b1-b3))
endif

if low[barindex-b4]>low[barindex-b1] then
lineb3=low[barindex-b4]-(((barindex-b4)*sqrt(square(low[barindex-b1]-low[barindex-b4])))/(b1-b4))
else
lineb3=low[barindex-b4]+(((barindex-b4)*sqrt(square(low[barindex-b1]-low[barindex-b4])))/(b1-b4))
endif

if low[barindex-b4]>low[barindex-b2] then
lineb31=low[barindex-b4]-(((barindex-b4)*sqrt(square(low[barindex-b2]-low[barindex-b4])))/(b2-b4))
else
lineb31=low[barindex-b4]+(((barindex-b4)*sqrt(square(low[barindex-b2]-low[barindex-b4])))/(b2-b4))
endif

if low[barindex-b4]>low[barindex-b3] then
lineb32=low[barindex-b4]-(((barindex-b4)*sqrt(square(low[barindex-b3]-low[barindex-b4])))/(b3-b4))
else
lineb32=low[barindex-b4]+(((barindex-b4)*sqrt(square(low[barindex-b3]-low[barindex-b4])))/(b3-b4))
endif


// return values

resistance=(linet1+ linet2+ linet21+ linet3+ linet31+ linet32)/6
support=(lineb1+ lineb2+ lineb21+ lineb3+ lineb31+ lineb32)/6
midpoint=(resistance+support)/2

return resistance, support, midpoint