GRaB candlesticks indicator

v10.3
GRaB candlesticks indicator

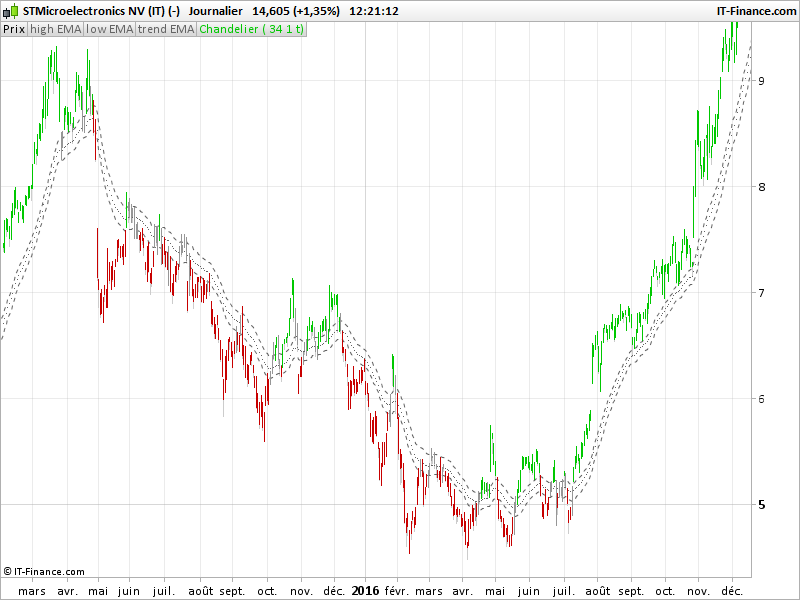
The GRaB candlesticks indicator draws candlesticks of 3 different colours according to the actual trend calculated with a combination of 3 exponential moving average of the same period but applied to high, low and close:

– 34 period exponential moving average on the high
– 34 period exponential moving average on the close
– 34 period exponential moving average on the low
(periods and moving average type can be modified in the indicator parameter to find the more suitable sets for each instrument and timeframe).

According to the original author of this tool, this is how it should be used: 

GRaB Candles are an extension of my 34EMA Wave and are simply a visual tool. I use them to determine the momentum and organization of a market trend. They are also a nice tool to use for traders looking at multiple charts and screens. They make my charts “glance-able” – in other words – I can make a some important decisions about price action on a specific time frame quickly “at a glance”. Typically an uptrend will have almost all green GRaB candles, a downtrend will have almost all red GRaB candles, and the more grey GRaB candles that I see, the higher the likelihood that the trend is correcting and/or in transition or that the market is trend is sideways (accumulation or distribution).

This indicator has been translated from 3 different MQL4 ones (1 for each candlestick type), by a request on English ProBuilder forum.


Share this

Risk disclosure:

No information on this site is investment advice or a solicitation to buy or sell any financial instrument. Past performance is not indicative of future results. Trading may expose you to risk of loss greater than your deposits and is only suitable for experienced investors who have sufficient financial means to bear such risk.

ProRealTime ITF files and other attachments : How to import ITF files into ProRealTime platform?

PRC is also on YouTube, subscribe to our channel for exclusive content and tutorials

  1. supertiti • 03/01/2017 #

    Bonjour Nicolas
    Est il possible de colorer le ruban formé par EMAhigh et EMAlow ?
    Si oui ? peux-tu nous en donner la façon de faire
    merci, bons trades à tous

    • Nicolas • 03/01/2017 #

      Aucune instruction ne permet de colorier un espace entre 2 variables. Il faut utiliser le remplissage ordinaire de la fenêtre de configuration de l’indicateur.

  2. supertiti • 03/01/2017 #

    merci , oui c’est ce que je fais. Je voulais juste savoir si on pouvait le coder.
    Bonne après midi

  3. ghary • 03/01/2017 #

    Bonjour peut on mettre les moyennes mobiles en invisible sur le code ? afin de ne pas les avoir sur le graphique …
    Merci

  4. Patrick O'Halloran • 03/01/2017 #

    HELLO  it will not let me change the color of the candle sticks do you know how 
     

  5. zen83 • 03/01/2017 #

    Hi Pat, have a look on the code present at the very bottom of this post
    https://www.prorealcode.com/topic/grab-candlesticks-indicator/
    it should fulfill your expectation
    Zen
     

  6. Patrick O'Halloran • 03/01/2017 #

     thank you zen but i am  no good with the code  i have no idea what to do thank you 
     

  7. gabri • 03/01/2017 #

    So, where is the instruction
    EMAh = average[EMAperiod,mmTYPE](high)
    coming from?  I cannot find any tutorial on it?
     

    • Nicolas • 03/01/2017 #

      This second parameter of the average term is here to define the average type, you’ll find details in the documentation there : https://www.prorealcode.com/documentation/average/

  8. gabri • 03/01/2017 #

    Thanks a lot Nicolas. I keep using the manuals from the help tag on the software but I guess the most update version of the commands are on line 🙂

    • Nicolas • 03/01/2017 #

      I try to keep the online documentation up to date, because I’d like to add more examples in this part of the website. But due to amounts of queries on forums, I still didn’t have do it.. 

  9. gabri • 03/01/2017 #

    Nicolas,
    I added some lines to the indicator you translated. They reflect the setting that Raghee Horner is using in her webinars. She uses light color candles when the close is higher than the open and dark color candles when close is lower than open.
    //PRC_GRaB candlesticks | indicator//01.03.2017//Nicolas @ http://www.prorealcode.com//Sharing ProRealTime knowledge//converted from MT4 code
    //— parametersEMAperiod=34mmTYPE=1 //(mm type)// —
    EMAh = average[EMAperiod,mmTYPE](high)EMAl = average[EMAperiod,mmTYPE](low)EMAc = average[EMAperiod,mmTYPE](close)
    bodyhigh = max(open,close)bodylow = min(open,close)
    if(open<=close and close > EMAH) thenLongWickUp = highLongCandleUp = bodyHighLongWickDown = lowLongCandleDown = bodyLowr=50g=200b=0elsif(open>=close and close > EMAH) thenLongWickUp = lowLongCandleUp = bodyLowLongWickDown = highLongCandleDown = bodyHighr=50g=150b=0elsif(open<=close and close < EMAL) thenShortWickUp = highShortCandleUp = bodyHighShortWickDown = lowShortCandleDown = bodyLowr=200g=50b=0elsif(open>=close and close < EMAL) thenShortWickUp = lowShortCandleUp = bodyLowShortWickDown = highShortCandleDown = bodyHighr=150g=50b=0elsif(open<=close and close < EMAH and close > EMAL) thenRangeWickUp = highRangeCandleUp = bodyHighRangeWickDown = lowRangeCandleDown = bodyLowr=50g=150b=250elsif(open>=close and close < EMAH and close > EMAL) thenRangeWickUp = lowRangeCandleUp = bodyLowRangeWickDown = highRangeCandleDown = bodyHighr=50g=0b=150endif//bullish candlesticksif close>EMAH thenDRAWCANDLE(LongCandleDown,LongWickUp,LongWickDown,LongCandleUp) coloured(r,g,b)endif
    //bearish candlesticksif close<EMAL thenDRAWCANDLE(ShortCandleDown,ShortWickUp,ShortWickDown,ShortCandleUp) coloured(r,g,b)endif
    //neutral candlesticks (range)if close<EMAH and close>EMAL thenDRAWCANDLE(RangeCandleDown,RangeWickUp,RangeWickDown,RangeCandleUp) coloured(r,g,b)endif
    RETURN EMAH coloured(0,200,100) style(dottedline) as “high EMA”, EMAL coloured(255,0,0) style(dottedline) as “low EMA”, EMAC coloured(0,0,255) style(dottedline) as “trend EMA”, exponentialaverage[13](close) as “EMA13”
     

  10. derelman • 03/01/2017 #

    Hi, 
           I cannot get any of these indicators to display on the chart and not the indicator window. Please help.
    Thanks
    Derelman

    • Nicolas • 03/01/2017 #

      Add it on the price instead, by using the wrench on the upper left side of the price chart.

  11. robertanthonyuk • 03/01/2017 #

    How would you change candlesticks to “heiken Ashi” Candles.Please advise

  12. jelogui • 03/01/2017 #

    bonjour Nicolas,
    bravo pour cet indicateur assez complexe et qui fonctionne parfaitement.
    sincèrement je n’y serais pas parvenu moi même.
    d’ailleurs j’ai essayé sans succès de me servir du fond pour générer un screener qui déclencherait des signaux à la hausse ou à la baisse lors de cassure du ruban en clôture.
    mais il y a trop de if et de elsif pour arriver à transformer tout ça en C1, C2, etc …
    alors évidemment je me tourne vers vous. si vous pouviez réaliser un tel screener, ce serait génial.
    et alors avec en plus une flèche basse ou haute de couleurs pour préciser le signal, alors là … ce serait la cerise sur le gâteau !
    merci d’avance :-)))

    • Nicolas • 03/01/2017 #

      Merci de formuler cette demande sur le forum Probuilder, je m’en chargerai dès que possible.

    • jelogui • 03/01/2017 #

      merci beaucoup Nicolas, je m’en occupe.

  13. zeD22 • 03/01/2017 #

    Hello There Nicolas,

    When i try to copy the code i get an Error says: the following variable is not defined – EMAperiod, mmTYPE

    Can you help me or anyone 🙂 thanks.

    PROBLEM SOLVED Thanks!!

    • Nicolas • 03/01/2017 #

      Download the itf file and import it.

avatar
Register or

Likes

avatar avatar avatar avatar avatar avatar avatar avatar avatar avatar avatar avatar avatar avatar avatar
Related users ' posts
Vinks_o_7 Hi Bruno Could you tell me where I can find more info about Laguerre candlesick please ?
Vinks_o_7 oops sorry did not see that one had to untick the standard Price to see your candle...
avatar
Anonymous This is very useful, look forward to testing it out. Thank you very much
idunnomuch IS this working in the latest version of prorealtime? I get the indicator, but not over my c...
bernardmorel egalement apparait en dessous du graphique mais vide
bernardmorel Bonjour est t il possible de remettre en ligne the strat car il y a une indication qui d...
bibifricotin Je pense avoir compris dans la première colonne exemple 92 le 9 indique la période et le 2 ...
Leo_da_Pisa It seems to work very well. Good for confirmation. Thanks for sharing Vivien.
Pablo Carmona del Moral hola juanjo, muchas gracias por este screener que nos has compartido. creo que lo voy a util...
Pablo Carmona del Moral para el volumen he cambiado: // Volumen significativo VS=volume>2*(average[10](volume[1...
Juanjo Muchas Gracias Pablo, ...Tengo varios screener, uno lo tengo adaptado para operar intradía, ...
RGKP Hi Vonasi, great work! But what I do not understand is that the statistics change according ...
mr_delta Hi https://www.prorealcode.com/user/vonasi/ I am interested in in scanning for a similar set...
Vonasi Minor Bug Fix Please download an updated version with a minor bug fix from here: https://www...
Jesper Great share!
capgros Bonjour @Nicolas, Thanks a lot for this tool, it is very useful for me. I would like to s...
Hans63 Would you add the possibility to color also the Heikin Ashi and bar chart?
Nicolas That's possible, please open a new topic in the indicator forum explaining what you need exa...
Victor.Strand Hi Pableitor, the code is just great; i was playing a lil bit with these factors, darwsegmen...
micky_red Hi, I have tried to use this indicator in version 12 and it doesn't work. Do you know how...
Victor.Strand Hey Micky, indicator works well, justpaste the code on the platform, or save it as an "itf" ...
ckat55 Thank you Nicolas, is there any way that an alert can be set for when the dot appears?
Nicolas yes, change the last line with: RETURN wrb,qh and set an alarm with the alert tool for ea...
ckat55 Thank you Nicolas, I will try it.
Ravindra Khanna copied it to pro real time not working. what to do?
GraHal Wow! Thank you Vonasi, great idea!
Vonasi No Problem GraHal. Please share anything interesting that you find using it.
Vonasi I've made a small improvement by adding a Buy and Hold line for comparison. This line can be...
JohnScher indicators i did fond, no problem, but a basic code to trade maybe RSI divergence didn´t fou...
Daniel3987 Please how do I add the prc candle strength to my mt5 on an iPhone
Nicolas You can't, this indicator is made to be used with prorealtime trading platform.
777dks hi this doesnot seem to work on forex, any ideas? thanks.
4example excellent, thank you
avatar
Anonymous Thanks for sharing! On the other hand can we remove the vertical gray lines?
ShaunG Appreciated! Thanks 100%
tonbijl good afternoon when i enter the code i get an error message Syntax error

Top