Smoothed Heikin Ashi with Stochastic Signals

v10.3
Smoothed Heikin Ashi with Stochastic Signals

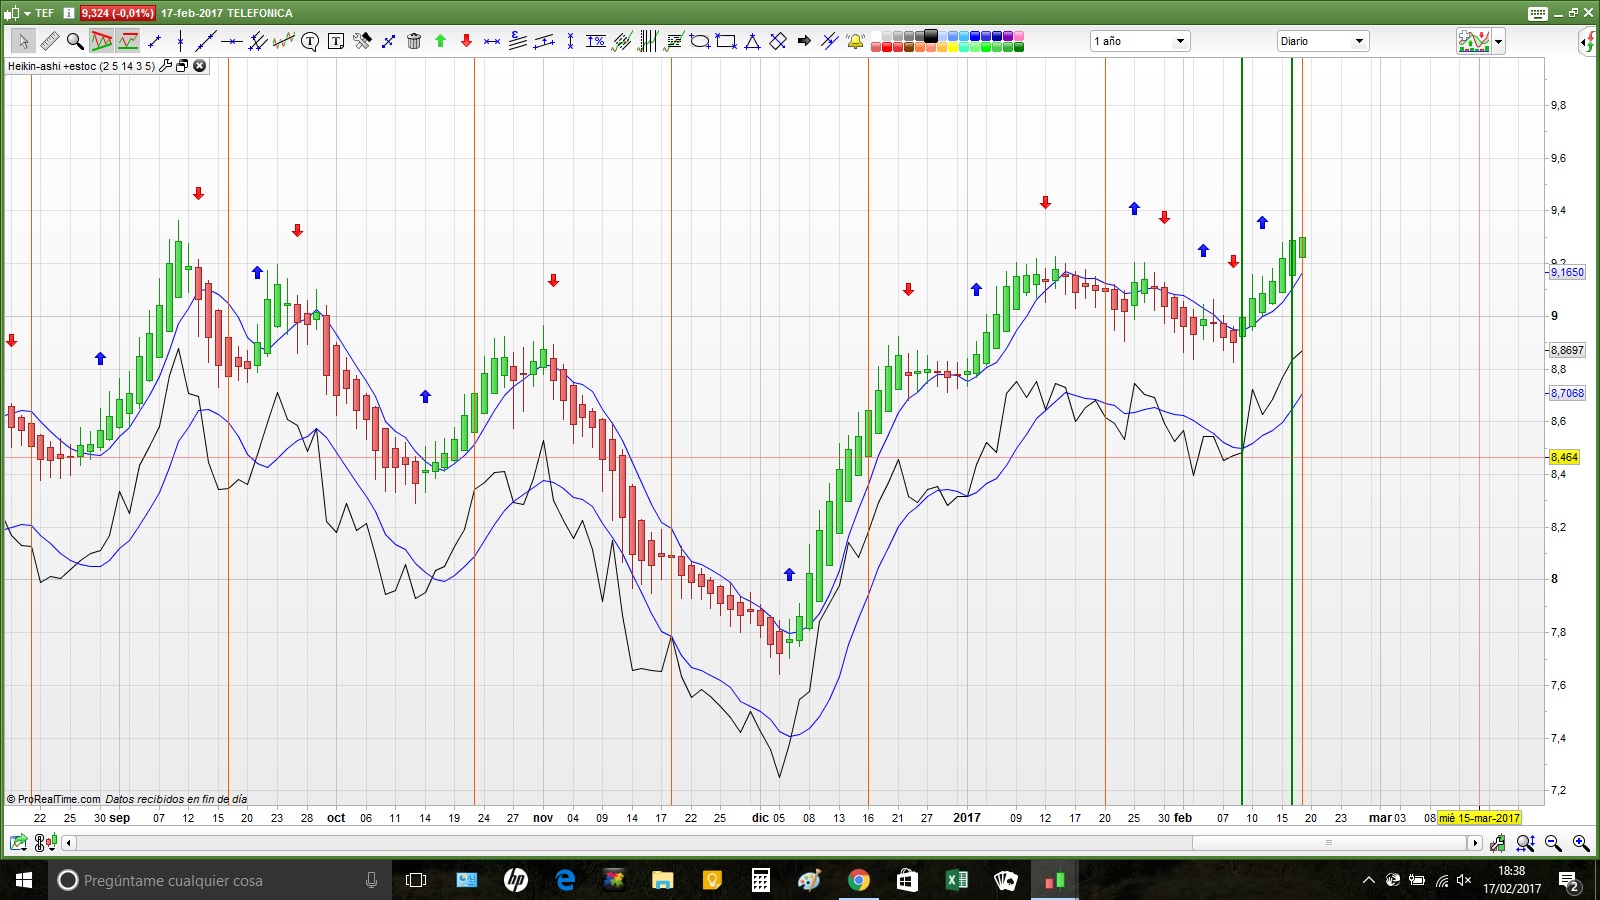
Second version of my previous heikin-ashi with stochastic including drawing a vertical orange line on every 3rd Friday of the month, which signals the end of options/warrants, due to the impact it has on closing values.


Rules in Heikin-Ashi:

1- White body sequence = upward trend.
  Sequence of black bodies = downtrend.
2- Strong bullish trend = Large white bodies and no lower shadows.
Strong bearish trend = Large black bodies without upper shadows.
3- When the tendency weakens small bodies appear with possible upper and / or lower shadows.
4- A consolidation occurs when small bodies appear with both shadows both above and below.
5- The reversal of a trend can be suspected with the appearance of small bodies with both upper and lower long shadows, or a sudden change of color

Share this

Risk disclosure:

No information on this site is investment advice or a solicitation to buy or sell any financial instrument. Past performance is not indicative of future results. Trading may expose you to risk of loss greater than your deposits and is only suitable for experienced investors who have sufficient financial means to bear such risk.

ProRealTime ITF files and other attachments : How to import ITF files into ProRealTime platform?

PRC is also on YouTube, subscribe to our channel for exclusive content and tutorials

  1. diegodesilva • 02/19/2017 #

    Hola Rafa,
     
     
    gracias por el gran trabajo!
    Muy interesante.
     
    Hay algunos puntos que no me quedan claros, hay alguna documentacion adicional que pueda leer?
    Muchas gracias.
     
    Un saludo.

    • rafadonl2 • 02/19/2017 #

      Hola Diego.
      Me imagino que te refieres a la documentación del Heikin-Ashi.  Hay montones de artículos que describen el funcionamiento.  
      En cualquier caso, no dudes en preguntarme lo que no entiendas y, si puedo, te lo aclaro. 
      En cuanto al “indicador” es, como verás, una mezcla de Heikin-ashi y del estocástico.
      Un cordial saludo.

    • rafadonl2 • 02/19/2017 #

      Diego:  
      hay un libro de José Luís Cárpatos titulado “Leones contra Gacelas” que habla de este indicador así como de otros muchos.  No baja al detalle, pero vale para descubrir un poco la filosofía que subyace detrás.  
      Te paso varios enlaces que te pueden ayudar.
      https://www.xtb.com/es/heikin-ashi-conceptos-basicos-y-operativa-de-trading-con-este-tipo-de-velas-modificadas-kb
      http://www.finanzas.com/noticias/mercados/bolsas/20140616/heikin-ashi-conceptos-basicos-2692751.html
      http://www.novatostradingclub.com/analisis-tecnico/velas-heiken-ashi/            éste es anti heikin ashi
      http://www.estrategiasdeinversion.com/invertir-corto/experto/analisis-tecnico-atresmedia-velas-heikin-ashi-313628   éste es un buen ejemplo.
      También encontrarás en Rankia, IG, etc.
      Lo que está claro es que siempre que “suavizas” las curvas , eliminas ruido, pero pierdes flexibilidad. No puedes aplicar los patrones de velas, porque los precios están modificados. Pero para trabajar con tendencias a medio plazo, a mí me parecen bastante válidas. Y si las aplicas a escala semanal en vez de a diaria, verás como confirman muchas cosas.   Mi sugerencia es que se usen como un indicador más que aporta información válida pero no es la panacea y que no se debería invertir sólo en base a este indicados. 
      El añadirle el estocástico, persigue darle cierta agilidad ya que éste si que es rápido detectando cambios. 
      Las curvas que te dibuja debajo, están desplazadas por claridad de gráficos, que si no, te dejas los ojos.  Usa los canales y los dojis como figuras a identificar. 
      Mi experiencia es que, a veces, cuando el cuerpo te pide salirte o entrar, te ayuda a posponer y mejorar la decisión. Y sobre todo lo hace menos sensible a la triple hora bruja del tercer viernes de cada mes. 
      Espero que te ayude y disculpa el retraso, pero he estado liado y no he podido contestarte antes.
      Un cordial saludo.

  2. lagjan • 02/19/2017 #

    Hello can please tell me how to install the indicator correct. After upload j don’t get the same result as above,HA candle are very small and on one line?

    • Nicolas • 02/19/2017 #

      Set the vertical axis to use the price only (in price settings).

    • lagjan • 02/19/2017 #

      Thanks Nicolas it helps,,,but what are the settings of variable? After upload the code and use price setting j dont get arrow and stochastic. Thanks for the help,,j just run PRT for a few weeks now so nead to learn a lot

  3. rafadonl2 • 02/19/2017 #

    Nicolas is right. You have to set up thevertical axis. When you install and run the indicator, if you modify it you may access to variables defined. Even so, in the screen you may modify them for this specific screen. In the indicator, you have as remarks the value used (at the begining). You may identify also by the sentence ONCE.
    If still have doubts, pkease let me know.
    Regards.

  4. Misheck • 02/19/2017 #

    Hi Rafa,

    Is it possible for you to translate this code to pinescript (tradingview) i would like to back test it. It looks really interesting

  5. oraclus • 02/19/2017 #

    Bonjour il existe l’indicateur Heikin Ashi smoothed with signals sur ce lien
    https://www.prorealcode.com/prorealtime-indicators/heikin-ashi-smoothed-signals/
    avec ce le screener ici https://www.prorealcode.com/topic/sreener-per-heikin-ashi-smooth-and-signals/
    Je souhaiterais avoir le screener de cet indicateur qui lui ressemble et qui est plus précis :
    Heikin Ashi lissé avec signaux stochastiques
    avec le lien ici
    quelqu’un pourrait il m’aider
    Merci

  6. oraclus • 02/19/2017 #

    https://www.prorealcode.com/prorealtime-indicators/smoothed-heikin-ashi-stochastic/

  7. rafadonl2 • 02/19/2017 #

    Ca est la second version. Quand le marché est plain la première version produit beaucoup de signaux. la difficulté pour ca est la fixation de le paramètre margen qui est particulière pour chaque valeur

  8. wtangsiri • 02/19/2017 #

    Bonsoir
    Qu’appelez vous l’axe vertical et comment le définir ? Merci pour votre aide.

    • rafadonl2 • 02/19/2017 #

      Je viens de voir ce que vous voulez dire. Comme pour tout autre indicateur, vous devez définir la plage d’affichage, en utilisant la souris de l’ordinateur. Si vous ne le faites pas, les lignes peuvent être rapprochées et ne pas être visibles. C’est la même chose qu’avec le volume ou le prix.

  9. rafadonl2 • 02/19/2017 #

    Pardonnez-moi mais je ne sais pas ce que vous entendez par “axe vertical”. Serait-ce la ligne verticale qui reflète le troisième vendredi de chaque mois (en raison de l’expiration des contrats à terme et des options) ?. c’est automatique et ne constitue qu’un avertissement car ce jour-là, les mouvements du marché boursier sont influencés par l’expiration de ces options. Salut

avatar
Register or

Likes

avatar avatar avatar avatar avatar avatar avatar avatar avatar avatar avatar avatar avatar avatar avatar avatar
Related users ' posts
P. Marlowe Quite an impressive work, Iván. Extremely useful and accurate. Congratulations. Keep it up¡
lkiklkik i love it !!! thanks.
AntoGH Bonjour peut-on backtester cela ? Et si vous l'avez fait pourriez vous nous donner le code.....
Nicolas désolé c'est un oubli de ma part, tu peux supprimer cette ligne, elle n'est plus utile dans ...
DELBERT Bonjour , Nicolas , merci pour ta réponse , je suis en effet avec PRT 10.3 , et j'ai bidouil...
RakeshPoluri I have a question about the bands on the candles. Is it bollinger bands or something else?
Nicolas I think that's 2 Bollinger Bands
Nicolas Merci d'ouvrir un sujet dans le forum des screeners en respectant les règles de publication ...
Pensera Bravo Nicolas ! Tu es en quelque sorte l’inventeur de Metascore…(oups je viens de lire jusqu...
Nicolas Dans un but d'investissement pure, et non spéculatif.
superfalcio Hello, on the 2h timeframe I got a better performance in terms of win% and profit factor. I ...
Jiankyr82 Juan thanks for sharing, I had played with it few days, as also try to catch up on my pro-re...
Lespa212 Hi Samsampop, are you using this strategy? did you add a SL and an exit in case of a trend ...
woktrade Superbe !
Vonasi An updated version with a bug fix can be found here: https://www.prorealcode.com/topic/dis...
snucke hey Vonasi is it possible you can help me get this indicator to show how much a market mo...
kbrooks323 Hello would someone be willing to release a scan code for this? that would be helpful as I s...
Nicolas You can do easily this screener by using the assisted creation tool. It would take you about...
kbrooks323 I just figured it out thanks!
Vinks_o_7 Vonasi you're a beast !!! ;-)))
pableitor Amazing indicator , you are pushing PRT to the limit! But looking at the scatter its not c...
Nicolas
4 years ago
KDJ
KDJ
3
Indicators
fireleg79 Bonsoir Nicolas. Merci pour tout ton travail. Quand tu auras le temps pourras-tu jeter un oe...
Sejibi Bonsoir, En remplaçant percentJ = 3 * percentD - 2 * percentK par percentJ = 3 * perc...
JMARTY Bonjour, A la recherche d'un indicateur détectant les divergences sur DMI, je tombe sur ce...
Jan Wind Thanks for sharing ! The Gain/Loss ratio is a bit low, 1,16, hardly offset the risks take...
drive whats the period ?
Lucas0000 Hola. estoy buscando un programador en proorder, para hacer un programa basado en el Q-trend...
Sapo Thank you very much. as always your indicators are extremely effective. kind regards Vonasi.
mitsu21 Hi, it looks nice. I'll try it tomorrow thank you for your share kind regards bruno
kj1988 Thank you Vonasi for sharing this indicator. Very useful as a comfirmation to the price act...
michaelben Bonjour Nicolas . Je cherche une strategie pour faire du trading automatisé. J'ai essaye ave...
Nicolas En effet merci, erreur corrigée, la variable Risk affecte désormais comme il se doit les cal...
nader003 How can we get this indicator on MT4
Nicolas You can ask for private custom coding to our programming services: https://www.prorealcode.c...
Vinks_o_7 Great, thanks a lot Nicolas !
Teddy Coronak Top Nicolas ! Merci
Andyswede Thank's! Great indicator:)
AntoGH how did you backtest it ?
PastaPesto @AntoGH , I dont know if you are asking me, but my backtest was made in an IS of 4 years bet...
Ridder @PastaPesto Do you still running this and how is the results? Thanks
dau710 Are the Bulls Blue & the Bears Red?
dau710 Many thanks :)
Maik2404 es sind leider nur long Positionen und keine Short zu erkennen.
Maik2404 Vytautas: es bleibt aber nur bei long Auslösungen
ullle73 this one is not a winner, have backtested it on almost all pairs, does not have an edge
teddy58 Ich habe es mit N= 1,5 und N=2,5 getestet mit 200000 Einheiten. Es funktioniert leider erst ...
Matriciel I use this indicator to help me make a decision when there is a divergence. The divergences ...
Jan Wind Hi, I personnaly am not a big fan of ZIGZAG indicator, as it repaints itself during time. ...
XXXXVII Excellent indicateur ! Déterminer une tendance est devenu un jeu d'enfants ! Félicitation......
gregoire bonjour nicolas j ai cherché partout sur le net et impossible de trouvé ce que je recherch...
Nicolas Merci de poster une demande dans le forum des indicateurs, ainsi on pourra le coder dans ce ...

Top