Daily ATR range for intraday chart

v10.3
Daily ATR range for intraday chart

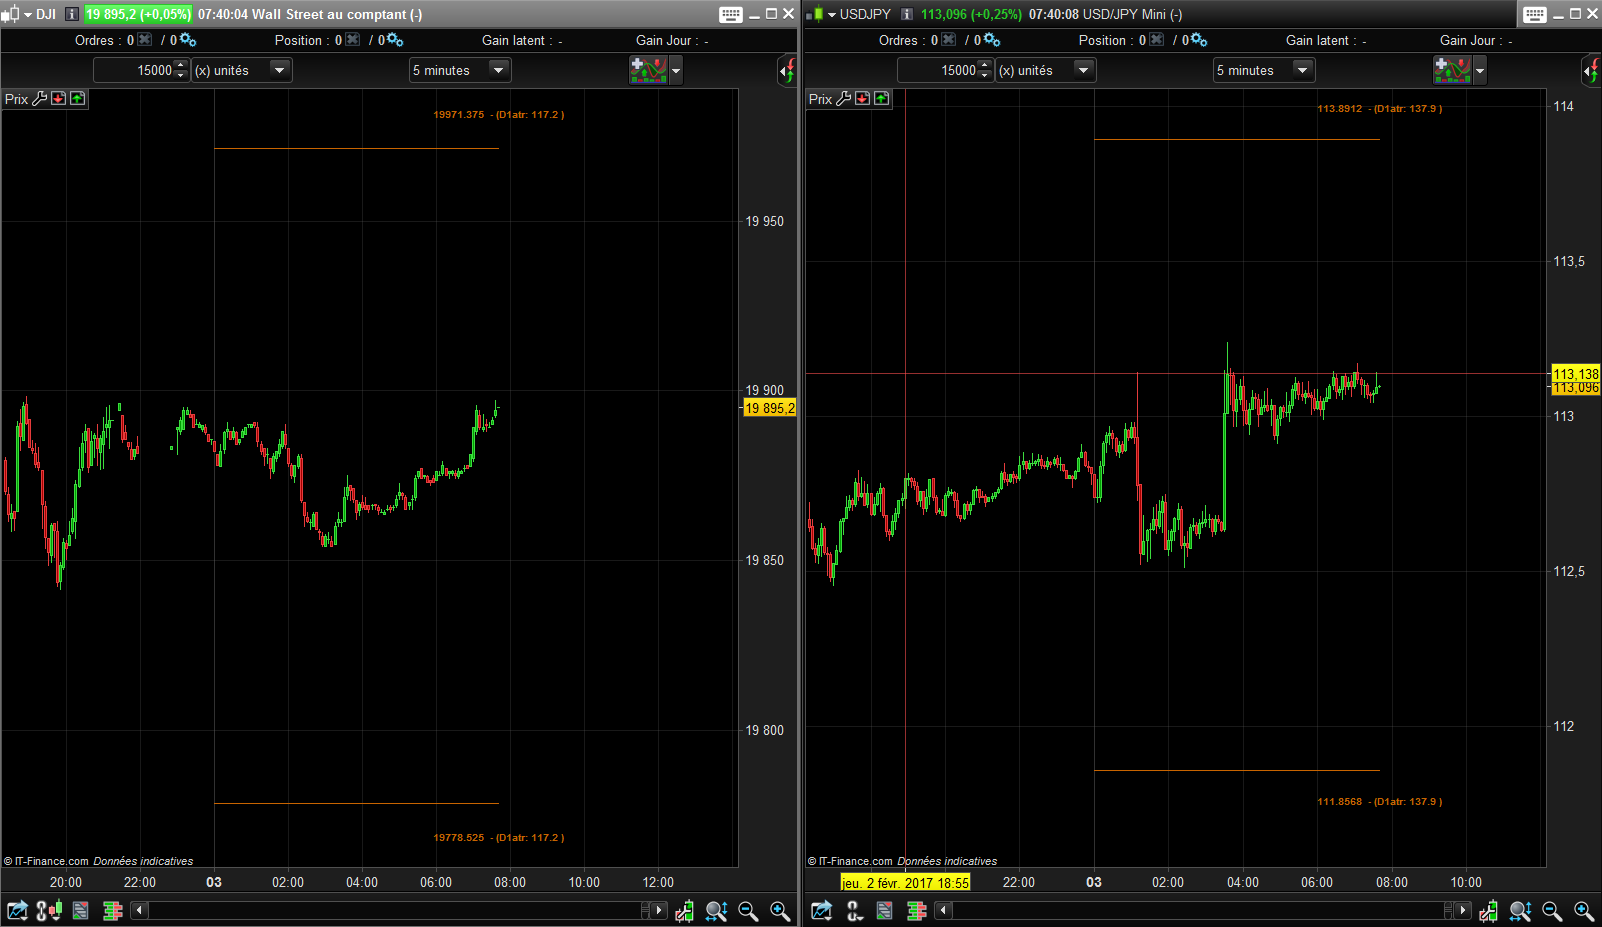
This indicator display graphically on any intraday chart, the daily Average True Range of the last 20 periods (periods can be modified in the indicator parameter of course) added or substract respectively to the current daily low and the daily high.

An upper and a lower line display these 2 values. I don’t know exactly how it is supposed to be traded, but I think it should be used as breakout of levels or bouncing trades.

This indicator seems to be known as “LEDGE ATR” and has been requested to be converted from MT4 version in our English forums (link in the indicator code).

Share this

Risk disclosure:

No information on this site is investment advice or a solicitation to buy or sell any financial instrument. Past performance is not indicative of future results. Trading may expose you to risk of loss greater than your deposits and is only suitable for experienced investors who have sufficient financial means to bear such risk.

ProRealTime ITF files and other attachments : How to import ITF files into ProRealTime platform?

PRC is also on YouTube, subscribe to our channel for exclusive content and tutorials

  1. DowBoy • 02/03/2017 #

    Hi Nicolas,
    Have a problem with this line of code
    defparam drawonlastbaronly=true
     
    Please complete the syntax of this line.
    ??
    Hope you can advise Nicolas
    Best regards
    DB
     

    • Nicolas • 02/03/2017 #

      This indicator is prorealtime 10.3 only compatible. If you are still using previous version, that’s why you get this error. 

  2. DowBoy • 02/03/2017 #

    Thanks for the heads up Nicolas!
    I’m actually using PRT Premium via IGIndex Spreadbet Account.
    At the moment they are still using v10.2
    Think I might drop them an email, see when upgrade is due!
    🙂
    Cheers Nicolas
    DB
     

  3. RoLaDay • 02/03/2017 #

    Hello Nicolas,
    i just tried this code but the program says “atrperiod” is not defined. I use PRT 10.3. Can you please help me with this? Thanks a lot

    • Nicolas • 02/03/2017 #

      Please download the ITF file and import it into your platform to get the parameter in your indicator window.

  4. RoLaDay • 02/03/2017 #

    Works great! Thanks!

  5. RoLaDay • 02/03/2017 #

    is it possible that the indicator works for the history too not only for the actual day? e.g. for backtesting?

    • Nicolas • 02/03/2017 #

      This could be possible but would need a complete recode of the indicator logic. You can add a query on forum, but I don’t know when I could make it.

  6. saulyte1 • 02/03/2017 #

    doesn’t work on IG PRT 10.3 get the indicator window when imported but empty and no projected levels on the chart as on yours…strange…

    • Nicolas • 02/03/2017 #

      Please add the indicator on price. Use the wrench in the upper left corner of the price chart to add the indicator. 

    • saulyte1 • 02/03/2017 #

      thank you,  seems to be working now.

  7. darraghcoyle@ • 02/03/2017 #

     hI,
    I have downloaded ITF file and imported it to PRT, when I choose the indicator I get a blank section with indicator name below main chart, how does it show on main screen.
     
    Thanks Darragh
     

    • Nicolas • 02/03/2017 #

      Please apply it on price instead (use the wrench at the upper left side of the price chart).

  8. darraghcoyle@ • 02/03/2017 #

    Nicolas,
    Yes , I did click on the wrench icon, but there is no option to apply on price, it only shows the name of the indicator . I have tried to attach screenshot but it says I cannot attach files to this .
     
    Darragh

  9. darraghcoyle@ • 02/03/2017 #

    got it sorted thanks

  10. DanT01 • 02/03/2017 #

    Hi Nicolas,

    Thanks very much for uploading this, works great. Is there a way to turn this into a scanner? I am basically after getting an alert when something breaks through the ATR indicator level but I am not sure how to set that up.

    Thanks
    Dan

    • Nicolas • 02/03/2017 #

      Please add new request in the appropriate forum. You can also use the assisted creation in the platform. Firstly, you’ll have to add the high end low ATR levels in the RETURN instruction.

  11. pseven5 • 02/03/2017 #

    Could anyone please help me install this. I am adding it via the wrench but it just appears greyed out and doesn’t display. Thanks

    • Nicolas • 02/03/2017 #

      What timeframe? Be sure to add sufficient xx Bars displayd for the indicator to compute correctly.

  12. crolakstrading • 02/03/2017 #

    Hi Nicolas,
    this is used as a bouncing off strategy… lets say the market open of the candle and bounce off from daily ATR!!! not sure why it doesn’t match the Daily ATR indicator on prorealtime? Example: on the FTSE my indicator Daily ATR 14 period says 92.548 but your one says D1atr:138.9 ?? any reason why? please help??

    • Nicolas • 02/03/2017 #

      Did you change the period to 14 in this indicator too? Are you using customized timezone for FTSE?

    • crolakstrading • 02/03/2017 #

      hi Nicolas,
      yes i have change the in this indicator time to 14 and also tried with 20 and im using this indicator on the 15min chart.. but either 14 period or 20 period doesnt match the normal daily ATR period 14 or 20?
      EX: today FTSE – daily ATR = 88.49 and the indicator shows as D1atr 132.9
      EURJPY Daily ATR (14)= 127.6 and the indicator(14) 102.4
      GBPUSD daily ATR =133.1 and indicator D1atr = 118.33

    • Nicolas • 02/03/2017 #

      Be sure to have sufficient bars displayed on your chart for the indicator to compute correctly.

    • crolakstrading • 02/03/2017 #

      the indicator would show any lines if threre’s not enough sufficient bars displayed .. so 15mins i use minimum 1000 units.. i have tried even 1month but get the same results?? not sure why???

  13. crolakstrading • 02/03/2017 #

    sorry i meant the indicator would NOT show any lines if threre’s not enough sufficient bars displayed .. so 15mins i use minimum 1000 units..

  14. crolakstrading • 02/03/2017 #

    at least 20pips difference pretty much all the markets!!!!

    • Nicolas • 02/03/2017 #

      Yes, but that’s a translation of the original code someone asked in forums.

    • crolakstrading • 02/03/2017 #

      hi Nicolas.. please is there’s a way to fix this? what am i doing wrong? iis everyone else get the right daily ART shown as the indicator??? when i change the ATR period to 7 on the indicator.. that will come a bit closer to daily 14 period ATR!!!!

  15. crolakstrading • 02/03/2017 #

    what can i do to change this in to the right daily ATR? is it something to do with the timezone?

  16. Nbrfx • 02/03/2017 #

    how can i use this indicator on Mt4 ?

    • Nicolas • 02/03/2017 #

      Our website does not provide indicators for MT4, we are using ProRealTime trading platform: http://www.prorealtime.com .
      If you want some of them to be converted, you ask for private paid assistance to our programming services: https://www.prorealcode.com/trading-programming-services/

  17. marcara • 02/03/2017 #

    Thanks Nicolas. It it working great! It is what I was lokking for! Many thanks! Is it possible to recde it in order to have it as an standalone indicator? As It is in the normal ATR .. soIt will be psssible o have historicata, averages and so on,.. Many thanks

    • Nicolas • 02/03/2017 #

      Change the last line to
      RETURN htr,ltr

  18. igoren • 02/03/2017 #

    Dear Nicolas et all, why do bodies and wicks in MT4 and PRT are different? what time setting I shud use to sync them, pls?

    • Nicolas • 02/03/2017 #

      I don’t know, depends of your broker timezone.

  19. Fab666 • 02/03/2017 #

    Hi Nicolas
    I was the person who asked for this code to be made a couple years back, I stopped using it once It wasn’t matching the default PRT 20day number that the below chart indicator produces, I was wondering if you every updated it with a fix? The code I have for this is attached, would appreciate your feedback thanks

    defparam drawonlastbaronly=true

    // — parameters
    ATRperiod = 20
    // —

    dTR = 0
    for i = 0 to ATRperiod
    dTR=dTR+max(abs(Dhigh(i)-Dlow(i)),max(abs(Dhigh(i)-Dclose(i+1)),abs(Dlow(i)-Dclose(i+1))))
    next

    avg = dTR/ATRperiod
    converted = round(avg/pointsize*10)/10

    htr = Dlow(0)+avg[1]
    ltr = Dhigh(0)-avg[1]

    if intradaybarindex=0 then
    begin=barindex
    endif

    drawsegment(begin,htr,barindex,htr) coloured(200,100,0)
    drawtext(“#htr# – (D1atr: #converted#)”,barindex,htr+10*pointsize,Dialog,Bold,10) coloured(200,100,0)
    drawsegment(begin,ltr,barindex,ltr) coloured(200,100,0)
    drawtext(“#ltr# – (D1atr: #converted#)”,barindex,ltr-10*pointsize,Dialog,Bold,10) coloured(200,100,0)

    return

    • Nicolas • 02/03/2017 #

      Try with this modification:
      for i = 0 to ATRperiod-1

    • julien1978 • 02/03/2017 #

      The ADR value that is plotted intraday does not match the value of the regular ATR indicator of the daily timeframe (for the same period of course).

      Example:
      The ATR (20) value of the daily chart of the EURUSD is currently 105 today and was 108 last friday.
      But this indicator is calculating a 89,7 ADR.

      Is there a way to fix this?

      Any help would be appreciated.

  20. Fab666 • 02/03/2017 #
  21. Fab666 • 02/03/2017 #
  22. Fab666 • 02/03/2017 #
  23. julien1978 • 02/03/2017 #

    Hello Nicolas, this topic is a bit old but the problem of this indicator has never been addressed.

    The ADR value that is plotted intraday does not match the value of the regular ATR indicator of the daily timeframe (for the same period of course).

    Example:
    The ATR (20) value of the daily chart of the EURUSD is currently 105 today and was 108 last friday.
    But this indicator is calculating a 89,7 ADR.

    Is there a way to fix this?

    Any help would be appreciated.

    • Fab666 • 02/03/2017 #

      I’ve tried to get a fix for this also but no luck, it doesn’t print the correct data as far as I’ve tested. A shame as its a very important factor. Ideally a daily/weekly/monthly ATR self adjusting would be very useful, but I’m no coder

  24. Seabiscuit • 02/03/2017 #

    Hi! With the new PRT update, this indicator does not work anymore

avatar
Register or

Likes

avatar avatar avatar avatar avatar avatar avatar avatar avatar avatar avatar avatar
Related users ' posts
Iván
2 months ago
finplus Bonjour, une petite demande concernant cet indicateur : comment faire pour que lorsque la bo...
LucasBest Bonjour, la coloration des bandes se fait ligne 111 et 112 à l'aide des instructions colorbe...
Ciccarelli Franco Hai ragione, mi dava valori alti perchè usavo questo loss "SET STP LOSS 1xAverageTrueRange{1...
YvesRobert Hello davidelaferla, how do you put a stop loss and where exactly ? the moment you enter on ...
Hypersimo Buongiorno Davide a quale distanza inserire stop loss e tp nella strategia? grazie
Nicolas Je ne rencontre pas ce problème avec le NASDAQ par exemple, ce serait plus simple d'ouvrir u...
YvesRobert Bonjour Nicolas, en effet ca marche, je me suis trompé, j'ai bien tout le tracé. C'est parce...
oliTR Bonjour, les conditions longCond et shortCond ne contiennent-elles pas une condition qui s'a...
Jiacky
2 years ago
Range Factor
Range Factor
0
Indicators
Sever
2 years ago
Stenozar Hi Sever, how can I visualize the coloured areas?
Sever Hi Stenozar, You need to add the color zones yourself , just go to Add Color Zone To set ...
Xenotrax A première vue, sa à l'air d'être un indicateur très puissant sur de petites temporalités, j...
merri Bonjour Nicolas, Comment transformer cet indicateur en bot sur PRT ?
Nicolas Cela a déjà été fait, voir ce sujet: https://www.prorealcode.com/topic/strategia-con-lindica...
Boris Hi IVMcm, thanks for your amazing work. I have tested all of your indicators and use some of...
IV Mcm With pleasure and thanks!
ashiash how to use this indicator can i use tradingview platform
Seabiscuit Hi! I like this indicator a lot, been using it on a 30 min timeframe and usually confirms my...
Ramahu Bonjour et merci pour cet indicateur ! je l'observe sur les actions du Nasdaq et la plupart ...
StephFor //ind1 = ZigZagPoint[2*averagetruerange[200]](close) avr = 3 //3% ind1 = ZigZag[avr](close...
Manu L. @Steph un grand merci pour ton aide mais :-( J'ai copier le code tel quel mais cependant j...
AlphaMauss Je n'ai pas réussi à faire fonctionner l'indicateur avec le code fourni en commentaire sur P...
IV Mcm Line 68 and 70, you must delete the instruction at the end of the line "" Bordercolor(0,0,0,...
BoutDePain This instruction is for the V11 maybe that you are using V10.3 then you can safely remove it.
Protagonist Bonjour, Je vois l'instruction inRange mais je ne trouve pas sa signification. Pouvez-vous...
Nicolas
3 years ago
Nicolas La définition des couleurs se situent entre les lignes 94 et 118. Selon le type de bougie (h...
Manu35250 Bonjour Nicolas, Est il possible de convertir cet indicateur en screener ? J'essaie depui...
Nicolas Bien sûr, merci de formuler la demande dans le forum approprié en respectant les règles de p...
PHAN100 bonjour, bravo à l'auteur pour cet indicateur visuel sur le graphique, il nous reste à va...
Nicolas Oui c'est possible. Merci de ne pas poster des demandes qui sont hors sujets. Pour les deman...
Igor Merci pour cet itf. Question : comment faire pour instruire un screener ?
Nicolas tester le croisement du Close avec la première valeur de l'indicateur : "TrailingStop", faci...

Top